. 2023 Apr 14;24(8):7298.
doi: 10.3390/ijms24087298.

Alveolar-Capillary Barrier Protection In Vitro: Lung Cell Type-Specific Effects and Molecular Mechanisms Induced by 1α, 25-Dihydroxyvitamin D3

Affiliations

Alveolar-Capillary Barrier Protection In Vitro: Lung Cell Type-Specific Effects and Molecular Mechanisms Induced by 1α, 25-Dihydroxyvitamin D3

Junyu Xiong et al. Int J Mol Sci. .

Abstract

Low serum levels of 1α, 25-dihydroxyvitamin D3 (VD3) are associated with a higher mortality in trauma patients with sepsis or ARDS. However, the molecular mechanisms behind this observation are not yet understood. VD3 is known to stimulate lung maturity, alveolar type II cell differentiation, or pulmonary surfactant synthesis and guides epithelial defense during infection. In this study, we investigated the impact of VD3 on the alveolar-capillary barrier in a co-culture model of alveolar epithelial cells and microvascular endothelial cells respectively in the individual cell types. After stimulation with bacterial LPS (lipopolysaccharide), gene expression of inflammatory cytokines, surfactant proteins, transport proteins, antimicrobial peptide, and doublecortin-like kinase 1 (DCLK1) were analyzed by real-time PCR, while corresponding proteins were evaluated by ELISA, immune-fluorescence, or Western blot. The effect of VD3 on the intracellular protein composition in H441 cells was analyzed by quantitative liquid chromatography-mass spectrometry-based proteomics. VD3 effectively protected the alveolar-capillary barrier against LPS treatment, as indicated by TEER measurement and morphological assessment. VD3 did not inhibit the IL-6 secretion by H441 and OEC but restricted the diffusion of IL-6 to the epithelial compartment. Further, VD3 could significantly suppress the surfactant protein A expression induced in the co-culture system by LPS treatment. VD3 induced high levels of the antimicrobial peptide LL-37, which counteracted effects by LPS and strengthened the barrier. Quantitative proteomics identified VD3-dependent protein abundance changes ranging from constitutional extracellular matrix components and surfactant-associated proteins to immune-regulatory molecules. DCLK1, as a newly described target molecule for VD3, was prominently stimulated by VD3 (10 nM) and seems to influence the alveolar-epithelial cell barrier and regeneration.

Keywords: DCLK1; LC-MS; LPS; VD3; alveolar epithelial cells; co-culture; lung barrier; quantitative proteomics.


Conflict of interest statement

The authors declare no conflict of interest.

Figures

Figure 1
Figure 1
Experimental setup and design of the co-culture of NCI-H441/OECs in the Transwell® systems for the TEER measurement.
Figure 2
Figure 2
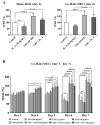
TEER measurement from the Transwell® systems to investigate the effects of VD3 (10 nM) on the barrier integral resistance. (A) TEER measurement on day 6 of the mono-culture of NCI-H441 cells and co-culture of NCI-H441/OECs treated with VD3 (10 nM) and IL-6 (10 ng/mL). (B). Temporal development of TEER from day 3 to day 7 of the co-culture of NCI-H441/OECs treated with VD3 (10 nM) and different doses of LPS (100 ng/mL, 1 μg/mL, 10 μg/mL). The treatment was performed as depicted schematically in Figure 1 for IL-6 or LPS in independent experiments. The measured TEER values were analyzed as relative ratios in percentage (%) in comparison with the control group and shown as mean values ± SD from at least three independent experimental sets (n ≥ 3). * p ˂ 0.05, ** p ˂ 0.01, **** p ˂ 0.0001, two-way ANOVA.
Figure 3
Figure 3
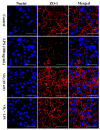
Immunofluorescence analysis of the tight junction molecule, ZO-1, in NCI-H441 cells. The NCI-H441 cells were treated with the conditioned media from the mono-culture of VD3 (10 nM) and LPS (100 ng/mL)-treated OECs to restore the co-culture condition in the Transwell® system. The cell nuclei were counterstained with Hoechst (blue) and ZO-1 in NCI-H441 cells was stained with anti-ZO-1 antibody (rabbit) and Alexa 555 (donkey, anti-rabbit) (red), magnification: 63 folds, scale bar: 50 μm.
Figure 4
Figure 4
Secretion analyses of pro-inflammatory cytokines from NCI-H441 cells and OECs from different cell culture systems. (A) IL-6 secretion from the co-culture of NCI-H441/OECs treated with VD3 (10 nM) and different doses of LPS (100 ng/mL, 1 μg/mL, 10 μg/mL). The supernatants were collected on day 7 from both apical and basolateral compartments of Transwells® from three individual co-culture experimental sets (n = 3). (B) IL-6 and IL-8 secretions from the mono-culture of NCI-H441 cells and OECs treated with VD3 (10 nM) and LPS (100 ng/mL). The supernatants were collected on day 7 from the mono-cultures. The values were depicted as pg/mL and shown as mean values ± SD from at least three independent experimental sets (n ≥ 3). * p ˂ 0.05, ** p ˂ 0.01, *** p ˂ 0.001, **** p ˂ 0.0001, one-way ANOVA.
Figure 5
Figure 5
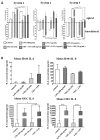
mRNA levels of SP-A and LL-37 in NCI-H441 cells. (A) mRNA levels of SP-A in NCI-H441 cells from the co-culture of NCI-H441/OECs and mono-culture of NCI-H441 cells treated with VD3 (10 nM) and LPS (100 ng/mL). (B) mRNA levels of LL-37 in NCI-H441 cells from both the co-culture of NCI-H441/OECs treated with VD3 (10 nM) and different doses of LPS (100 ng/mL, 1 μg/mL, 10 μg/mL) and the mono-culture of NCI-H441 cells treated with VD3 (10 nM) and LPS (100 ng/mL). The mRNA levels were analyzed through real-time PCR. The values were shown as mean values ± SD from at least three independent experiments (n ≥ 3). *** p ˂ 0.001, **** p ˂ 0.0001, one-way ANOVA.
Figure 6
Figure 6
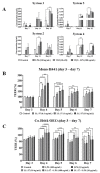
The secretion levels of LL-37 in NCI-H441 cells and its effect on the barrier properties. (A) LL-37 secretion of NCI-H441 cells from four individual modified mono-cultures of NCI-H441 cells with VD3 (10 nM) and LPS (100 ng/mL) treatments (n = 4). The cell culture period was extended to 15 days, and the medium supernatants were collected on day 7, 11, and 15, with medium exchange every 4 days. (B) TEER measurement from day 3 to day 7 of the mono-culture of NCI-H441 cells grown on the apical side of the Transwell® filters. The 1 µM dexamethasone and LL-37 treatments were applied from day 3 to day 7 with different doses (0.1 ng/mL, 1 ng/mL, 10 ng/mL). (C) TEER measurement from day 3 to day 7 of the co-culture of NCI-H441/OECs in the Transwells®. The cells were pretreated with LL-37 (10 ng/mL) and 1 µM dexamethasone on day 3 and treated with LPS (100 ng/mL, 10 µg/mL) on day 5 from the basolateral compartments for 48 h. The measured TEER values were analyzed as relative ratios in percentage (%) in comparison with the control group. The values were shown as mean values ± SD from at least four independent experiments (n ≥ 4). * p ˂ 0.05, ** p ˂ 0.01, *** p ˂ 0.001, **** p ˂ 0.0001, one- and two-way ANOVA.
Figure 7
Figure 7
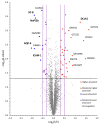
Protein abundance changes quantified by isobaric labeling and LC-MS/MS upon treatment of H44 cells with VD3. The volcano plot shows the relative changes of protein abundances: x-axis: log2 treatment (T) vs. control (C), the values correspond to the T/C values shown in Supplemental Tables S1–S4 y-axis: log10(p-value). Values above the horizontal dashed line are significant (α = 0.05). Protein abundance changes are classified into four groups: lower abundant; moderately lower abundant; moderately higher abundant; and higher abundant (indicated by vertical dashed lines from left to right). Differentially abundant proteins are annotated by colored labels, naming according to protein identifiers or abbreviations (Supplemental Tables S1–S4; for reasons of readability, only selected proteins are labeled).
Figure 8
Figure 8
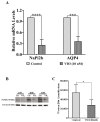
Expression of the cell membrane transport proteins NaPi2b and AQP4 in NCI-H441 cells. (A) mRNA levels of NaPi2b and AQP4 in NCI-H441 cells evaluated through real-time PCR from the mono-culture of NCI-H441 cells with dexamethasone (1 µM) and VD3 (10 nM) treatments (day 7). (B) Western blot of NaPi2b from the mono-culture of NCI-H441 cells with dexamethasone (1 µM) and VD3 (10 nM) treatment (day 7). (C) Quantification of the Western blots for NaPi2b in NCI-H441 cells. The values were shown as mean values ± SD from three independent experimental sets with the passage numbers of NCI-H441 cells between 57 and 59 (n = 3). * p ˂ 0.05, *** p ˂ 0.001, **** p ˂ 0.0001, one- and two-way ANOVA.
Figure 9
Figure 9
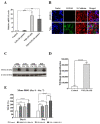
Expression of DCLK1 in the NCI-H441 cells. The expression of DCLK1 was analyzed from the mono-culture of NCI-H441 cells with dexamethasone (1 µM) and VD3 (10 nM) treatments and 7 days of cell culture. (A) mRNA levels of DCLK1 in NCI-H441 cells evaluated through real-time PCR. The cells were pretreated with VD3 (10 nM) and treated with LPS (10 µg/mL) on day 5 for 48 h. (B) Immunofluorescence analysis of DCLK1 in NCI-H441 cells after VD3 (10 nM) treatment and 7 days of culture. Blue: nuclei, green: DCLK1, red: E-cadherin, magnification: 40 folds, scale bar: 50 µm. (C) Western blot of DCLK1 from the mono-culture of NCI-H441 cells after VD3 (10 nM) treatment and 7 days of culture and (D) quantification. (E) Relative TEER values (%) of NCI-H441 cells treated with VD3 (10 nM) and DCLK1 inhibitor LRRK2-IN-1 (500 nM) on days 6 and 7. The values were shown as mean values ± SD from at least three independent experimental sets with the passage numbers of NCI-H441 cells between 56 and 59 (n ≥ 3). ** p ˂ 0.01, *** p ˂ 0.001, **** p ˂ 0.0001, one-way ANOVA, and t-test.

Similar articles

Cited by

References

    1. Gehr P., Bachofen M., Weibel E.R. The normal human lung: Ultrastructure and morphometric estimation of diffusion capacity. Respir. Physiol. 1978;32:121–140. doi: 10.1016/0034-5687(78)90104-4. - DOI - PubMed
    1. Assa A., Vong L., Pinnell L.J., Avitzur N., Johnson-Henry K.C., Sherman P.M. Vitamin D deficiency promotes epithelial barrier dysfunction and intestinal inflammation. J. Infect. Dis. 2014;210:1296–1305. doi: 10.1093/infdis/jiu235. - DOI - PubMed
    1. Foong R.E., Zosky G.R. Vitamin D deficiency and the lung: Disease initiator or disease modifier? Nutrients. 2013;5:2880–2900. doi: 10.3390/nu5082880. - DOI - PMC - PubMed
    1. Takahashi S., Maeda T., Sano Y., Nishihara H., Takeshita Y., Shimizu F., Kanda T. Active form of vitamin D directly protects the blood-brain barrier in multiple sclerosis. Clin. Exp. Neuroimmunol. 2017;8:244–254. doi: 10.1111/cen3.12398. - DOI
    1. Yin Z., Pintea V., Lin Y., Hammock B.D., Watsky M.A. Vitamin D enhances corneal epithelial barrier function. Investig. Ophthalmol. Vis. Sci. 2011;52:7359–7364. doi: 10.1167/iovs.11-7605. - DOI - PMC - PubMed