. 2023 Apr 14;24(8):7297.
doi: 10.3390/ijms24087297.

An Efficient 2D Protocol for Differentiation of iPSCs into Mature Postmitotic Dopaminergic Neurons: Application for Modeling Parkinson's Disease

Affiliations

An Efficient 2D Protocol for Differentiation of iPSCs into Mature Postmitotic Dopaminergic Neurons: Application for Modeling Parkinson's Disease

Olga S Lebedeva et al. Int J Mol Sci. .

Abstract

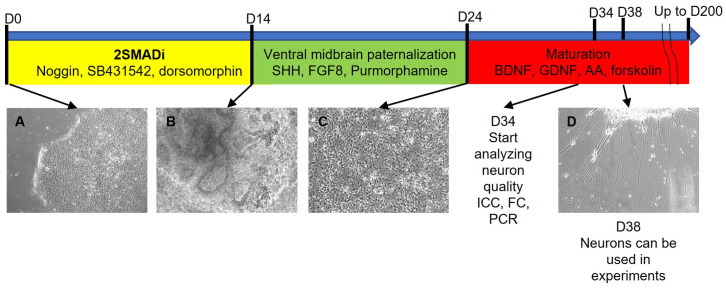
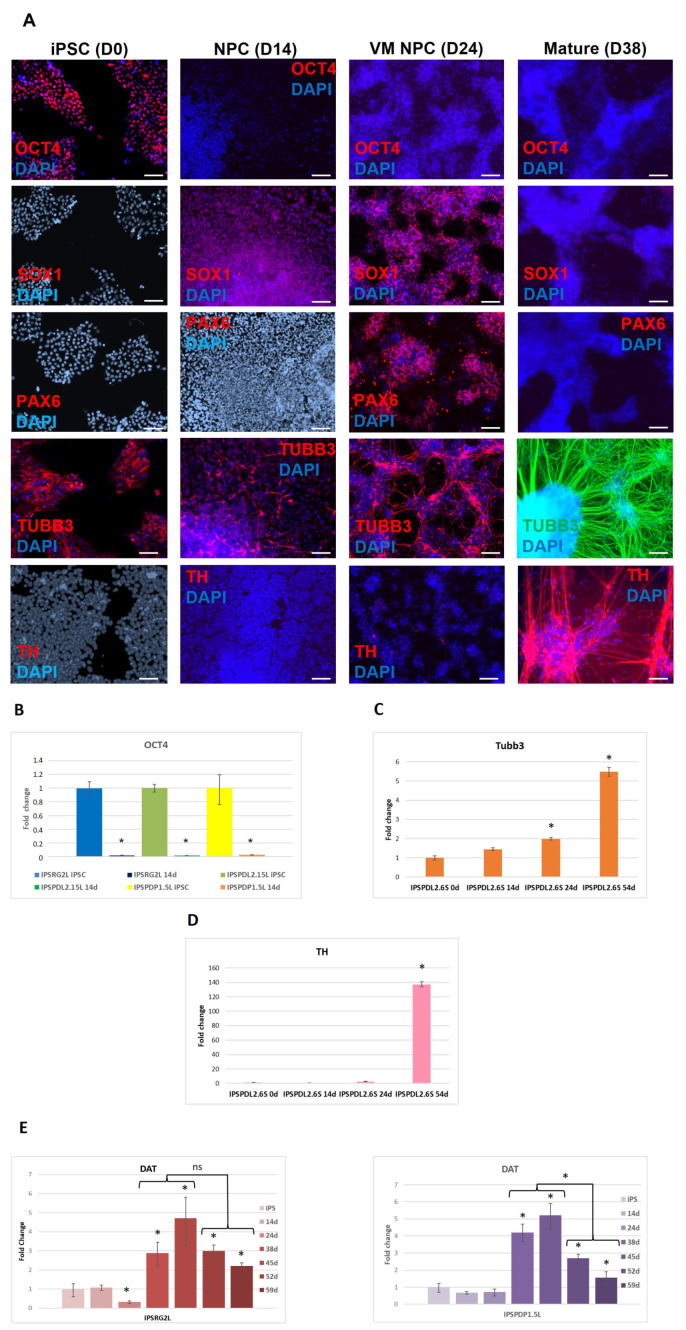
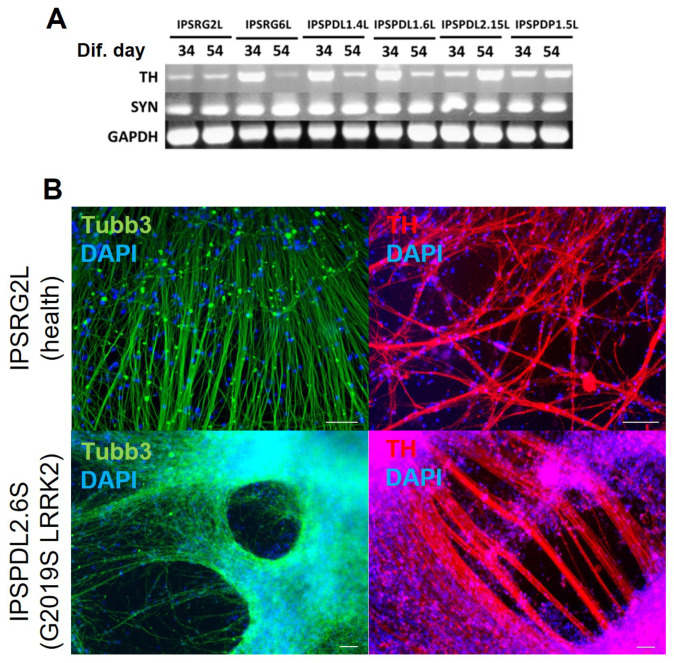
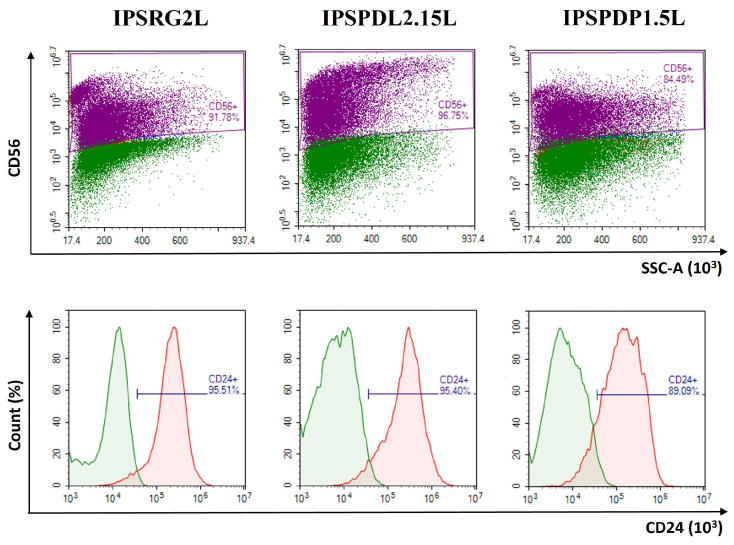
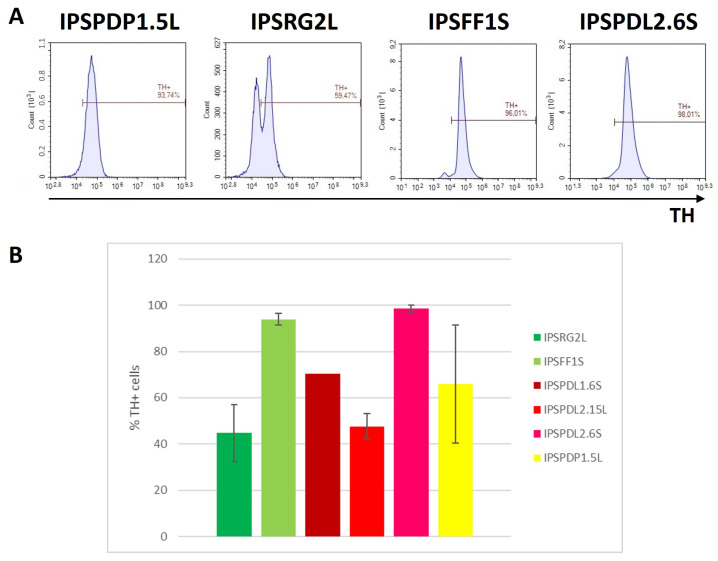
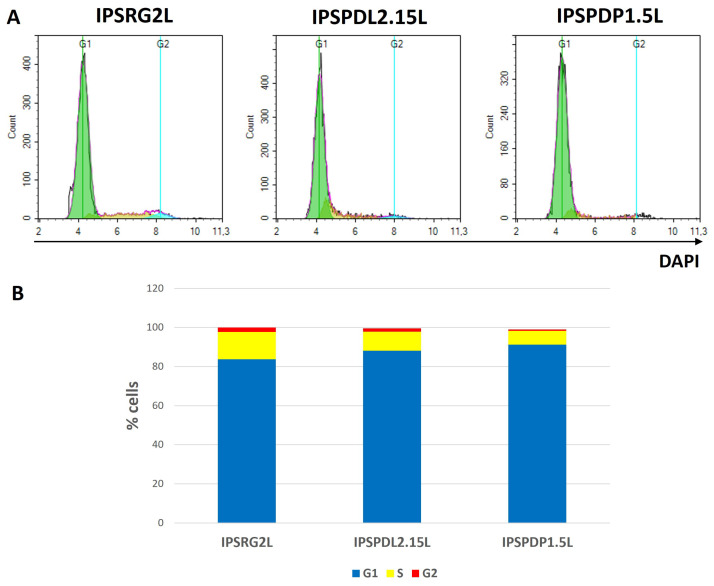
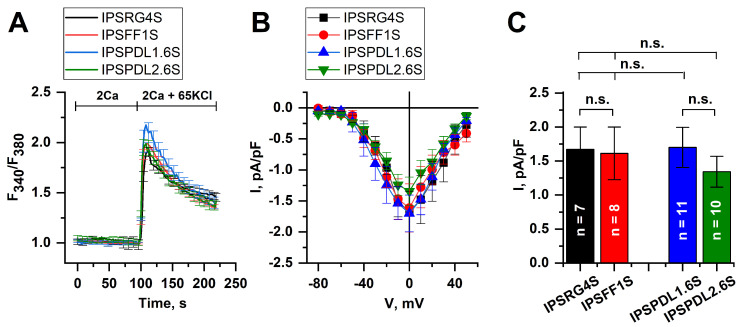
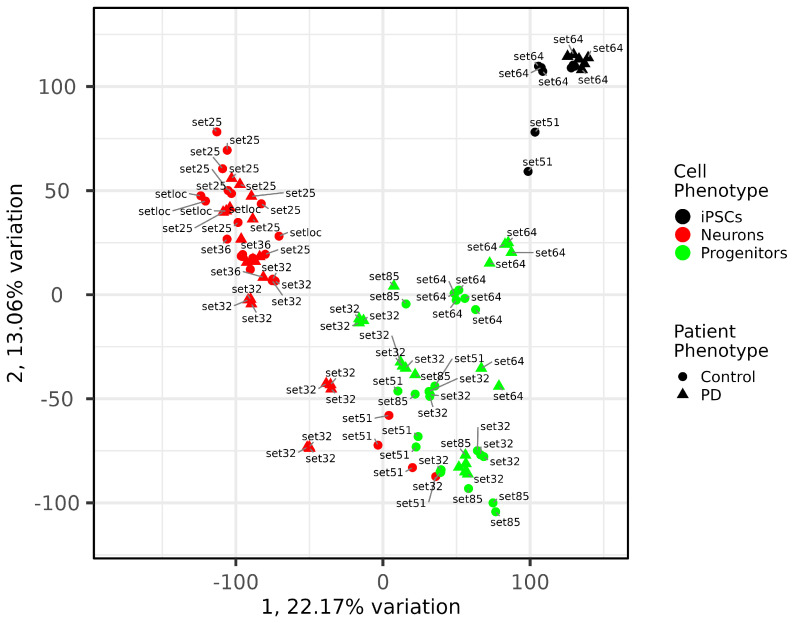
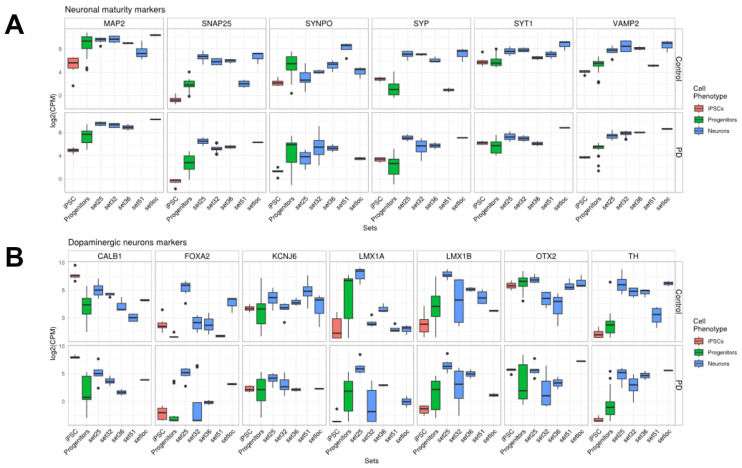
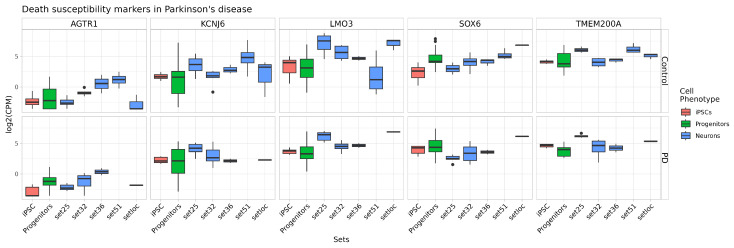
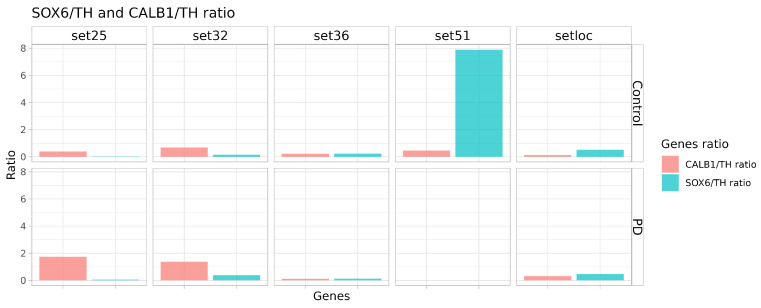
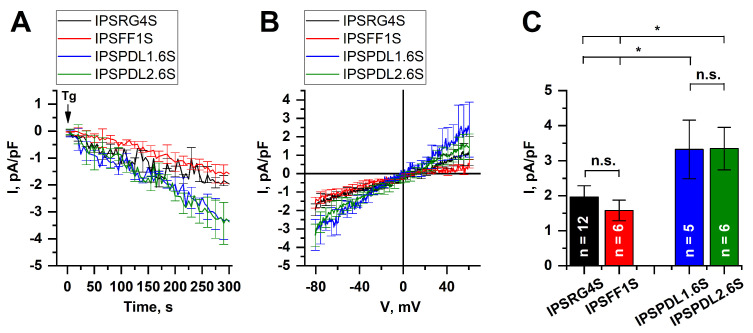
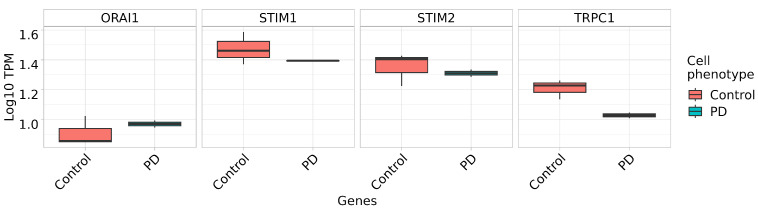
About 15% of patients with parkinsonism have a hereditary form of Parkinson's disease (PD). Studies on the early stages of PD pathogenesis are challenging due to the lack of relevant models. The most promising ones are models based on dopaminergic neurons (DAns) differentiated from induced pluripotent stem cells (iPSCs) of patients with hereditary forms of PD. This work describes a highly efficient 2D protocol for obtaining DAns from iPSCs. The protocol is rather simple, comparable in efficiency with previously published protocols, and does not require viral vectors. The resulting neurons have a similar transcriptome profile to previously published data for neurons, and have a high level of maturity marker expression. The proportion of sensitive (SOX6+) DAns in the population calculated from the level of gene expression is higher than resistant (CALB+) DAns. Electrophysiological studies of the DAns confirmed their voltage sensitivity and showed that a mutation in the PARK8 gene is associated with enhanced store-operated calcium entry. The study of high-purity DAns differentiated from the iPSCs of patients with hereditary PD using this differentiation protocol will allow for investigators to combine various research methods, from patch clamp to omics technologies, and maximize information about cell function in normal and pathological conditions.

Keywords: Parkinson’s disease; SOCE currents; calcium; differentiation protocol; disease modeling; high purity of neuron culture; iPSCs.


Conflict of interest statement

The authors declare no conflict of interest. The funders had no role in the design of the study; in the collection, analyses, or interpretation of data; in the writing of the manuscript, or in the decision to publish the results.

Figures

Figure 1
Figure 1
DAns differentiation protocol scheme. (A)—undifferentiated iPSCs in mTeSR1 media on Matrigel (differentiation day 0); (B)—common neural progenitors at the end of the first differentiation step (differentiation day 14); (C)—ventral midbrain neuronal progenitors at the end the second differentiation step (differentiation day 24); (D)—mature neurons at the third differentiation step (differentiation day 38). Magnification 100×.
Figure 2
Figure 2
Analysis of the expression of the pluripotent state marker and neuronal differentiation markers at different stages of differentiation. (A)—immunofluorescence analysis of sequential steps of differentiation for the expression of the pluripotent state marker OCT4, markers of neural progenitors SOX1, PAX6, neuronal marker β-III-tubulin and DAns marker tyrosine hydroxylase (TH) on the example of iPSC line IPSRG2L from a healthy donor. NPC—common neural progenitors (differentiation day 14), VMNPC—ventral midbrain neuronal progenitors (differentiation day 24), Mature—neurons (differentiation day 38). DAPI—blue, corresponding marker green or red. Scale bar 100 μM. (B)—Analysis of the expression level of OCT4 by real-time PCR in iPSCs and at differentiation day 14; IPSRG2L—iPSC line from healthy donor; IPSPDL2.15L—iPSC line from PD patient with mutation in PARK8 gene; IPSPDP1.5L—iPSC line from PD patient with mutation in PARK2 gene. (C)—Analysis of the expression level of β-III-tubulin by real-time PCR in iPSCs and at differentiation days 14, 24, 54 on the example of iPSC line IPSPDL2.6S—iPSC line from PD patient with mutation in PARK8 gene. (D)—Analysis of the expression level of TH by real-time PCR in iPSCs and at differentiation days 14, 24 and 54 on the example of iPSC line IPSPDL2.6S-iPSC from PD patient with mutation in PARK8 gene. (E)—Analysis of the expression level of DAT1 by real-time PCR in iPSCs and at differentiation days 14, 24, 38, 45, 52 and 59; IPSRG2L—iPSC line from healthy donor; IPSPDP1.5L—iPSC line from PD patient with mutation in PARK2 gene. *—the level of expression is statistically significantly different from the level of expression in iPSCs (p < 0.05). On the y-axis, the fold changes relative to iPSCs. The bars represent the mean ± SEM.
Figure 3
Figure 3
Analysis of neuronal cultures after 34 days of differentiation for expression of neuronal markers and a marker of the mature state of neurons by PCR and immunocytochemistry. (A)—PCR analysis of neuronal cultures, differentiated from healthy and PD iPSC lines. Expression of common neuronal marker (SYN, synaptophysin) and DAns marker (TH) was shown at 34 and 54 differentiation days. GAPDH—Glyceraldehyde 3-phosphate dehydrogenase. IPSRG2L, IPSRG6L—healthy donor iPSC lines; IPSPDL1.4L, IPSPDL1.6L, IPSPDL2.15L–iPSC lines from two PD patients with mutation in PARK8 gene; IPSPDP1.5L—iPSC line from PD patient with mutation in PARK2 gene. (B)—immunocytochemical analysis of neuronal cultures differentiated from IPSRG2L (healthy) and IPSPDL2.6S (mutation in PARK8 gene) IPSC lines on day 45 of differentiation. Green—β-III- tubulin, red—TH, blue—DAPI. Scale bar 100 μM.
Figure 4
Figure 4
Results of flow cytometry analysis of neurons differentiated from iPSCs obtained from the material of patients with PD and from a healthy donor, on differentiation day 65. Upper panel—CD56 (N-CAM)—neural cell adhesion molecule, bottom panel—CD24—cell adhesion molecule. IPSRG2L—iPSC line from healthy donor; IPSPDL2.15L—iPSC line from PD patient with mutation in PARK8 gene, IPSPDP1.5L—iPSC line from PD patient with mutation in PARK2 gene. The data are presented as an overlay image of plots for specific antibody-stained cells and isotype-control antibody-stained cells. Green—isotype control, violet—cells stained for N-CAM, red—cells stained for CD24.
Figure 5
Figure 5
Flow cytometry analysis of neurons differentiated from iPSCs obtained from the material of patients with PD and from a healthy donor, on differentiation day 65. (A)—anti-TH staining. IPSPDP1.5L—iPSC line from PD patient with mutation in PARK2 gene; IPSRG2L and IPSFF1S—iPSC lines from healthy donor; IPSPDL2.6S—iPSC line from PD patient with mutation in PARK8 gene. (B)—results of analysis of neuronal populations for TH expression presented in graphical view (n = 1–4). The bars represent the mean ± SEM.
Figure 6
Figure 6
Cell cycle analysis by flow cytometry. (A)—distribution of cells by phases of the cell cycle for neurons on day 65 of differentiation generated from IPSRG2L line obtained from a healthy donor (left), from IPSPDL2.15L line obtained from PD patient with mutation in PARK8 gene (middle), from IPSPDP1.5L line obtained from PD patient with mutation in PARK2 gene (right). (B)—the histogram shows the proportion of cells in G1, S and G2 phases of the cell cycle. Statistical data are shown in Table S1.
Figure 7
Figure 7
Depolarization-induced calcium influx in iPSC-derived DAns. (A)—average fluorescence amplitudes of calcium dye Fura-2 AM in DAns derived from PD patients (IPSPDL1.6S, blue line) and (IPSPDL2.6S, green line) with point mutation G2019S in PARK8 gene and healthy donors (IPSRG4S, black line) and (IPSFF1S, red line). The calcium influx was evoked by the application of 65 mM KCl that caused membrane depolarization and consequent calcium entry through voltage-gated channels. The curves are represented as mean ± SEM. (B)—average I–V curves of normalized voltage-gated calcium currents in DAns specific for PD patients (IPSPDL1.6S, blue line and IPSPDL2.6S, green line) and healthy donors (IPSRG4S, black line and IPSFF1S, red line). The number of experiments is depicted in panel (C). (C)—average amplitudes of voltage-gated calcium currents at the potential of 0 mV in DAns specific for PD patients (IPSPDL1.6S, blue bar) and (IPSPDL2.6S, green bar) and healthy donors (IPSRG4S, black bar) and (IPSFF1S, red bar). The amplitudes are represented as mean ± SEM (n = number of single-cell experiments), n.s. indicates the absence of statistically significant differences (p > 0.05).
Figure 8
Figure 8
PCA plot of comparing samples in 7 datasets. Samples mostly cluster according to their cell type.
Figure 9
Figure 9
Expression levels of markers of mature neurons, midbrain DAn as well as A9 and A10 subtypes of DAn in comparison between datasets. (A)—neuronal maturity markers; presents the genes responsible for the functioning of synaptic transmission (SYP, SYNPO, SNAP25, VAMP2, SYT1) and the cytoskeleton (MAP2). (B)—midbrain DAn markers (TH, FOXA2, LMX1A, LMX1B, OTX2), A9 subtype DAn marker (KCNJ6) and A10 subtype DAns marker (CALB1).
Figure 10
Figure 10
Expression levels of markers of vulnerable DAn subtype and resistant DAn subtype in comparison between datasets.
Figure 11
Figure 11
CALB1/TH and SOX6/TH ratio as an indirect assessment of the proportion of resistant and sensitive cells in the DAn cultures in comparison between datasets.
Figure 12
Figure 12
Store-operated calcium entry in iPSCs-derived dopaminergic neurons. (A)—Normalized SOC currents evoked by application of thapsigargin (1 μM) and represented as a function of time at a test potential of −80 mV in iPSC-based DAns specific to PD patients (IPSPDL1.6S, blue line and IPSPDL2.6S, green line) and healthy donors (IPSRG4S, black line and IPSFF1S, red line). Each trace is represented as mean ± SEM. (B)—Average I–V curves of normalized SOC currents evoked by the passive depletion of calcium stores with thapsigargin (1 μM) in iPSC-based DAns specific to PD patients (IPSPDL1.6S, blue line and IPSPDL2.6S, green line) and healthy donors (IPSRG4S, black line and IPSFF1S, red line). The I–V curves were plotted at the steady-state level of the SOC currents. The number of experiments is depicted in panel (C). (C)—Average amplitudes of the normalized SOC currents at the potential of −80 mV in DAns specific to PD patients (IPSPDL1.6S, blue bar and IPSPDL2.6S, green bar) and healthy donors (IPSRG4S, black bar and IPSFF1S, red bar). The amplitudes are represented as mean ± SEM (n = number of single-cell experiments), n.s. indicates the absence of statistically significant differences (p > 0.05). Asterisk indicates statistically significant differences (p < 0.05).
Figure 13
Figure 13
Expression of genes associated with the electrophysiological activity in setloc dataset. DAns differentiated from IPSFF1S represent “Control”, DAns differentiated from IPSPDL2.6S (mutation G2019S in LRRK2) represent ”PD”.

Similar articles

Cited by

References

    1. Gardner R.C., Burke J.F., Nettiksimmons J., Goldman S., Tanner C.M., Yaffe K. Traumatic brain injury in later life increases risk for P arkinson disease. Ann. Neurol. 2015;77:987–995. doi: 10.1002/ana.24396. - DOI - PMC - PubMed
    1. Lee P.C., Bordelon Y., Bronstein J., Ritz B. Traumatic brain injury, paraquat exposure, and their relationship to Parkinson disease. Neurology. 2012;79:2061–2066. doi: 10.1212/WNL.0b013e3182749f28. - DOI - PMC - PubMed
    1. Ratner M.H., Farb D.H., Ozer J., Feldman R.G., Durso R. Younger age at onset of sporadic Parkinson’s disease among subjects occupationally exposed to metals and pesticides. Interdiscip. Toxicol. 2014;7:123–133. doi: 10.2478/intox-2014-0017. - DOI - PMC - PubMed
    1. Drouin-Ouellet J., Barker R. Parkinson’s Disease in a Dish: What Patient Specific-Reprogrammed Somatic Cells Can Tell Us about Parkinson’s Disease, If Anything? Stem Cells Int. 2012;2012:926147. doi: 10.1155/2012/926147. - DOI - PMC - PubMed
    1. Sudhaman S., Prasad K., Behari M., Muthane U.B., Juyal R.C., Thelma B. Discovery of a frameshift mutation in podocalyxin-like (PODXL) gene, coding for a neural adhesion molecule, as causal for autosomal-recessive juvenile Parkinsonism. J. Med. Genet. 2016;53:450–456. doi: 10.1136/jmedgenet-2015-103459. - DOI - PubMed

MeSH terms