. 2023 Apr 15;24(8):7337.
doi: 10.3390/ijms24087337.

G-Protein β-Subunit Gene TaGB1-B Enhances Drought and Salt Resistance in Wheat

Affiliations

G-Protein β-Subunit Gene TaGB1-B Enhances Drought and Salt Resistance in Wheat

Xin-Xin Xiong et al. Int J Mol Sci. .

Abstract

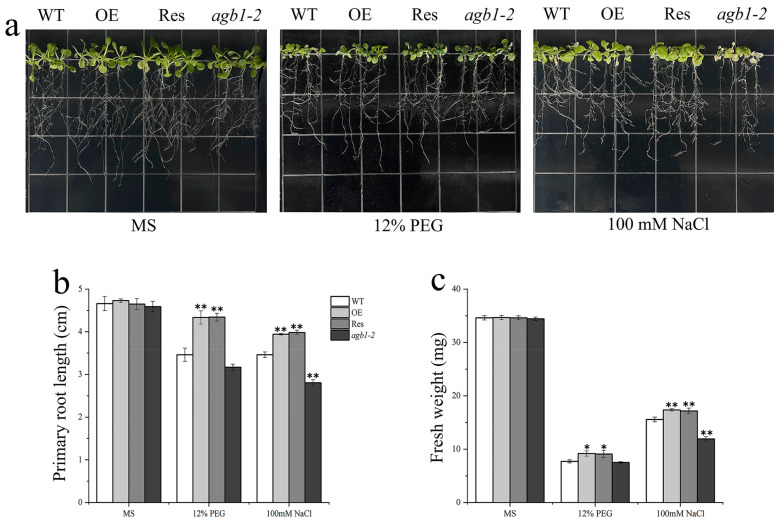
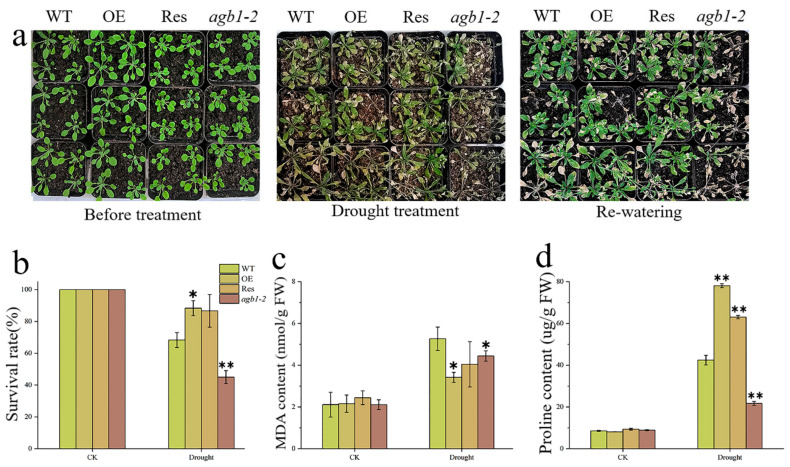
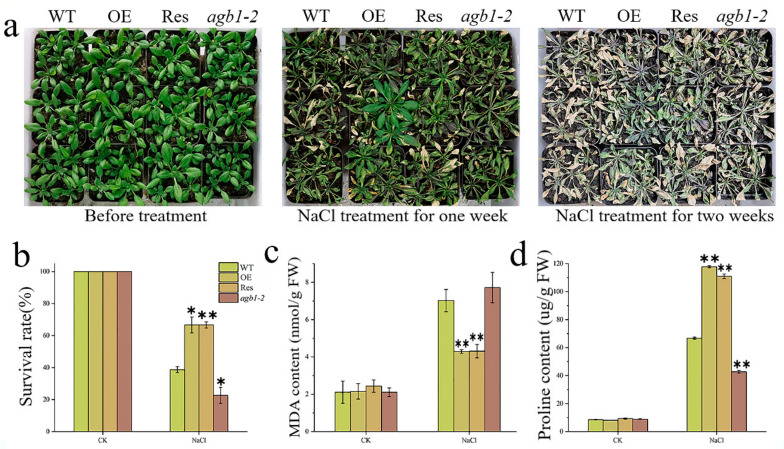
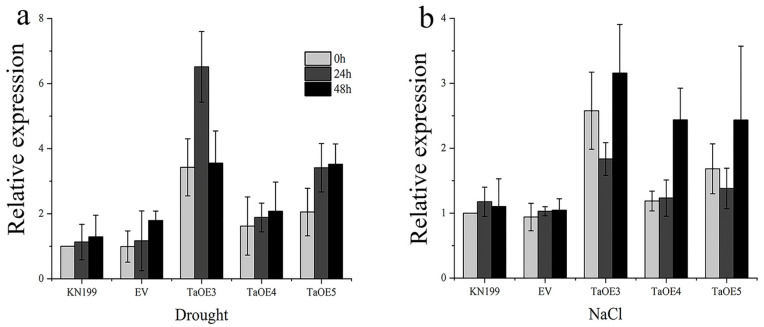
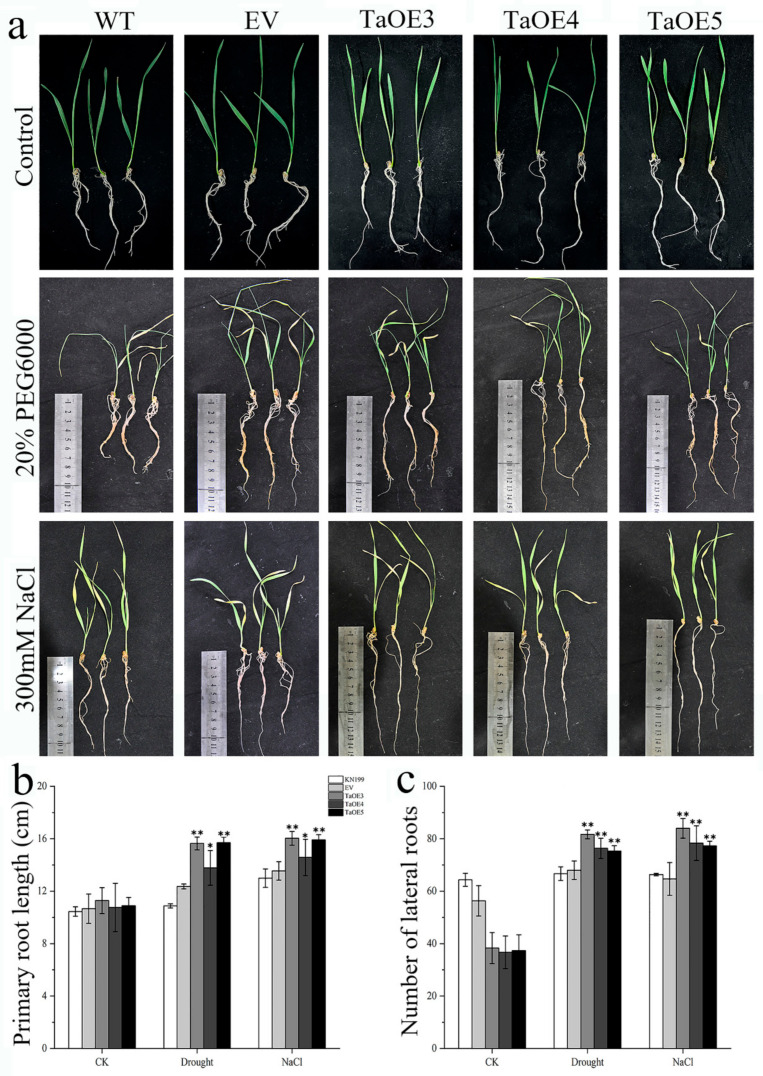
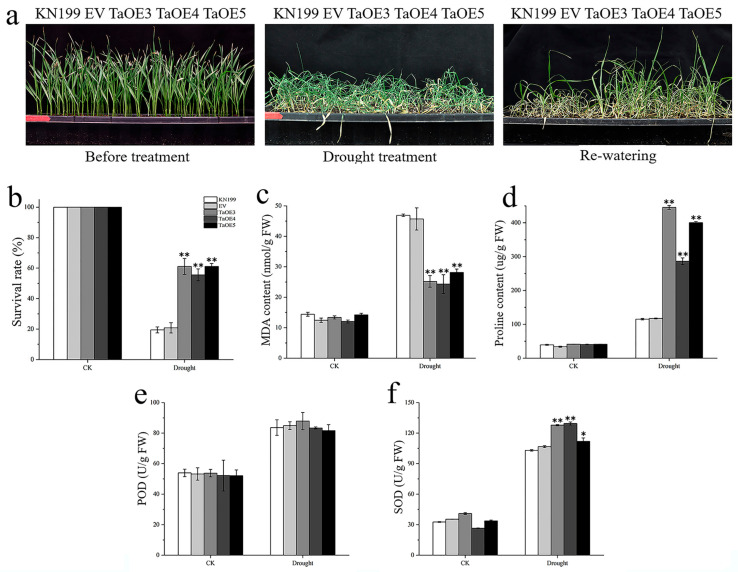
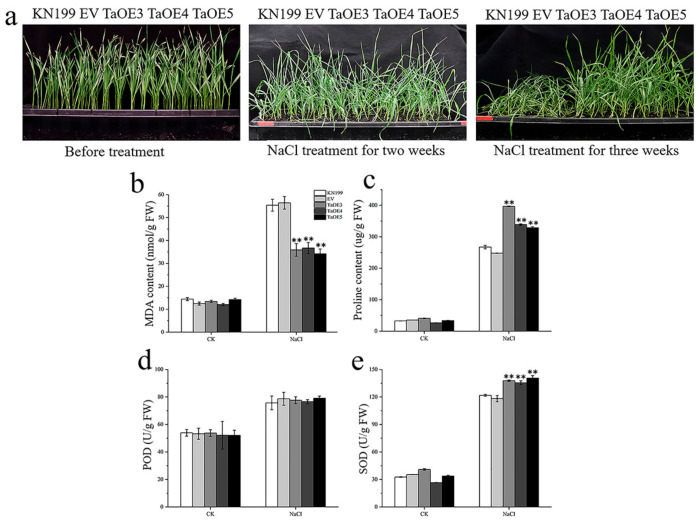
In the hexaploid wheat genome, there are three Gα genes, three Gβ and twelve Gγ genes, but the function of Gβ in wheat has not been explored. In this study, we obtained the overexpression of TaGB1 Arabidopsis plants through inflorescence infection, and the overexpression of wheat lines was obtained by gene bombardment. The results showed that under drought and NaCl treatment, the survival rate of Arabidopsis seedlings' overexpression of TaGB1-B was higher than that of the wild type, while the survival rate of the related mutant agb1-2 was lower than that of the wild type. The survival rate of wheat seedlings with TaGB1-B overexpression was higher than that of the control. In addition, under drought and salt stress, the levels of superoxide dismutase (SOD) and proline (Pro) in the wheat overexpression of TaGB1-B were higher than that of the control, and the concentration of malondialdehyde (MDA) was lower than that of the control. This indicates that TaGB1-B could improve the drought resistance and salt tolerance of Arabidopsis and wheat by scavenging active oxygen. Overall, this work provides a theoretical basis for wheat G-protein β-subunits in a further study, and new genetic resources for the cultivation of drought-tolerant and salt-tolerant wheat varieties.

Keywords: G-protein β-subunit; TaGB1; abiotic stress; wheat.


Conflict of interest statement

The authors declare that they have no conflict of interest.

Figures

Figure 1
Figure 1
The expression of TaGB1 homologs under different stress treatments in one-week-old wheat seedling (based on the wheat expression database). (a) Expression of TaGB1 homologs under drought stress in wheat variety TAM107. (b) Expression of TaGB1 homologs under heat stress in wheat variety TAM107. (c) Expression of TaGB1 homologs under drought and heat stress in wheat variety TAM107. (d) Expression of TaGB1 homologs under PEG6000 stress in wheat variety Gemmiza 10. (e) Expression of TaGB1 homologs under PEG6000 stress in wheat variety Giza 168.
Figure 2
Figure 2
The expression of TaGB1-B under different stress treatments and tissue-specific expression of TaGB1-B under drought and salt treatments in one-week-old wheat seedling. (a) The expression of TaGB1-B under NaCl treatment; (b) PEG6000; (c) cold; (d) drought; (e) heat; (f) ABA; (g) GA; (h) MeJA; and (i) ET. (j) Tissue-specific expression of TaGB1-B under drought treatment. (k) Tissue-specific expression of TaGB1-B under salt treatment. Error bars show standard deviations (mean ± SD and n = 3).
Figure 3
Figure 3
Germination assay of wild-type (WT), TaGB1-B overexpression Arabidopsis, mutant Arabidopsis (agb1-2) and complementary mutant (Res) seeds under PEG6000 treatment. (a) The phenotypes of WT, TaGB1-B overexpression Arabidopsis, mutant Arabidopsis (agb1-2) and complementary mutant seeds under 9% and 12% PEG6000 treatments. (b) The germination rates of WT, TaGB1-B overexpression Arabidopsis, mutant Arabidopsis (agb1-2) and complementary mutant seeds at different time points on the MS medium. (c) The germination rates under 9% PEG6000 treatment. (d) The germination rates under 12% PEG6000 treatment.
Figure 4
Figure 4
Germination assay of wild-type (WT), TaGB1-B overexpression Arabidopsis, Arabidopsis mutants (agb1-2) and complementary mutant (Res) seeds under NaCl treatment. (a) The phenotypes of WT, TaGB1-B overexpression of Arabidopsis, mutant Arabidopsis (agb1-2) and complementary mutant seeds under 100 mM and 150 mM NaCl treatments. (b) The germination rates of WT, TaGB1-B overexpression of Arabidopsis, mutant Arabidopsis (agb1-2) and complementary mutant seeds at different time points on the MS medium. (c) The germination rates under 100 mM NaCl treatment. (d) The germination rates under 150 mM NaCl treatment.
Figure 5
Figure 5
The overexpression of TaGB1-B enhanced the tolerance to drought and salt stresses in Arabidopsis. (a) Morphological differences between wild-type (WT), TaGB1-B overexpression Arabidopsis, mutant Arabidopsis (agb1-2) and complementary mutant seeds at seedling stages under PEG6000 treatment and NaCl. (b) Statistical analysis of root length. (c) Fresh weight. The error column represents the standard deviation (mean ± SD and n = 3), * and ** above each column indicate a significant difference compared with WT plants (* p < 0.05; ** p < 0.01).
Figure 6
Figure 6
The functional characteristics of drought tolerance of transgenic Arabidopsis with TaGB1-B gene under drought stress. (a) Phenotypic analysis of each plant line before treatment, 14 days after drought treatment, and 3 days after rehydration. (b) Survival rate of each line after drought stress. (c) The content of malondialdehyde (MDA) in Arabidopsis treated by drought. (d) Proline content. The data are expressed as the mean ± SDs (n = 3) of three experiments. * and ** above each column indicate a significant difference compared with WT plants (* p < 0.05; ** p < 0.01).
Figure 7
Figure 7
The functional characteristics of drought tolerance of transgenic Arabidopsis with TaGB1-B gene under NaCl stress. (a) Phenotypic analysis of each plant line before treatment, one week after NaCl treatment and two weeks after NaCl. (b) Survival rate of each line after NaCl stress. (c) The content of malondialdehyde (MDA) in Arabidopsis treated by NaCl. (d) Proline content. The data are expressed as the mean ± SDs (n = 3) of three experiments. * and ** above each column indicate a significant difference compared with WT plants (* p < 0.05; ** p < 0.01).
Figure 8
Figure 8
Transcription spectrum analysis of TaGB1-B transgenic wheat under drought and salt stress. (a) The expression level of TaGB1-B in each line under drought treatment. (b) The expression level of TaGB1-B of each line under NaCl treatment. Error bars show standard deviations (mean ± SD and n = 3).
Figure 9
Figure 9
TaGB1-B enhanced the drought and salt tolerance of wheat. (a) Drought and salt stress tolerance responses of TaGB1-B overexpression transgenic KN199 and the empty vector transgenic plants. (b) Primary root length. (c) Number of lateral roots. Data are presented as the mean ± standard deviation calculated from triplicates. * and ** above each column indicate a significant difference compared with WT plants (* p < 0.05; ** p < 0.01).
Figure 10
Figure 10
The functional characteristics of TaGB1-B overexpression wheat plants under drought stress. (a) Phenotypic analysis of TaGB1-B overexpression plants under normal treatment, drought stress treatment for 14 days and rehydration for 3 days. (b) The survival rate of each line after drought stress. (cf). Physiological index of wheat plant. (c) MDA content. (d) Proline content. (e) POD. (f) SOD. The error column represents the standard deviation (mean ± SD and n = 3), and * and ** above each column indicate a significant difference compared with WT plants (* p < 0.05; ** p < 0.01).
Figure 11
Figure 11
The functional characteristics of TaGB1-B overexpression wheat plants under NaCl stress. (a) Phenotypic analysis of TaGB1-B overexpression plants under normal treatment, NaCl stress treatment for two weeks and NaCl stress treatment for three weeks. (be) Physiological index of wheat plant. (b) MDA content. (c) Proline content. (d) POD. (e) SOD. The error column represents the standard deviation (mean ± SD and n = 3), and and ** above each column indicate a significant difference compared with WT plants (** p < 0.01).

Similar articles

Cited by

References

    1. Abdel Latef A.A.H., Kordrostami M., Zakir A., Zaki H., Saleh O.M. Eustress with H(2)O(2) Facilitates Plant Growth by Improving Tolerance to Salt Stress in Two Wheat Cultivars. Plants. 2019;8:303. doi: 10.3390/plants8090303. - DOI - PMC - PubMed
    1. Zhu J.-K. Abiotic stress signaling and responses in plants. Cell. 2016;167:313–324. doi: 10.1016/j.cell.2016.08.029. - DOI - PMC - PubMed
    1. Shao H., Liang Z., Shao M. Adaptation of higher plants to environmental stresses and stress signal transduction. Acta Ecol. Sin. 2005;25:1772–1781.
    1. Gilman A.G. G proteins: Transducers of receptor-generated signals. Annu. Rev. Biochem. 1987;56:615–649. doi: 10.1146/annurev.bi.56.070187.003151. - DOI - PubMed
    1. Sprang S.R. G protein mechanisms: Insights from structural analysis. Annu. Rev. Biochem. 1997;66:639–678. doi: 10.1146/annurev.biochem.66.1.639. - DOI - PubMed

MeSH terms

LinkOut - more resources