

Severe Acute Liver Dysfunction Induces Delayed Hepatocyte Swelling and Cytoplasmic Vacuolization, and Delayed Cortical Neuronal Cell Death
- PMID: 37108515
- PMCID: PMC10139143
- DOI: 10.3390/ijms24087351
Severe Acute Liver Dysfunction Induces Delayed Hepatocyte Swelling and Cytoplasmic Vacuolization, and Delayed Cortical Neuronal Cell Death
Abstract
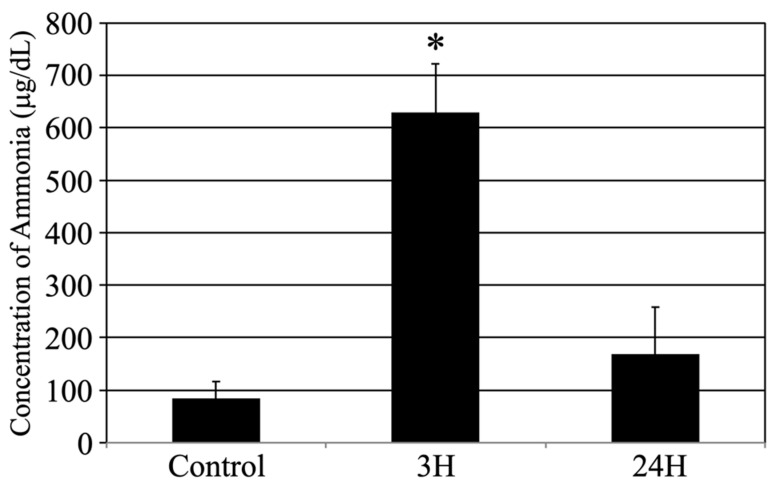
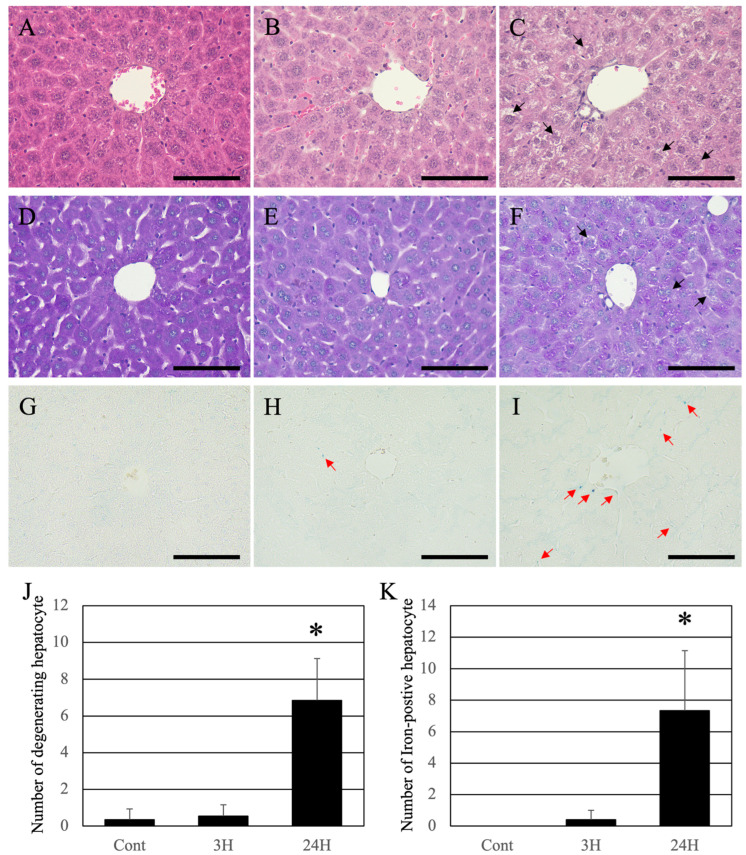
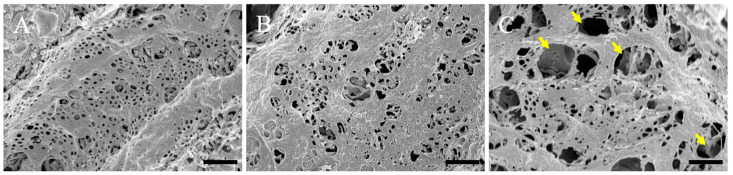
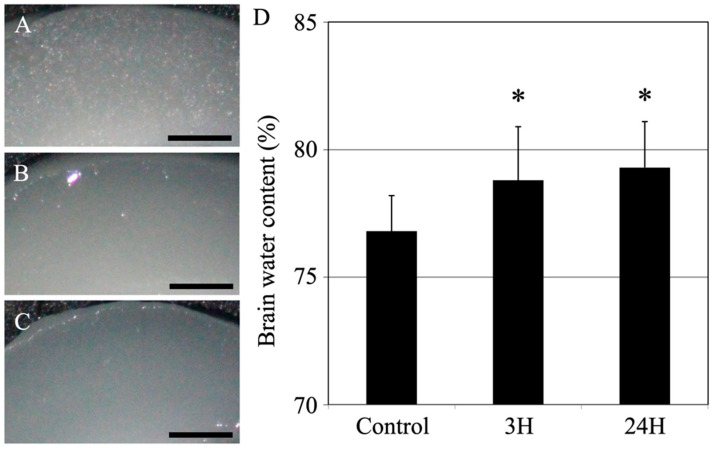
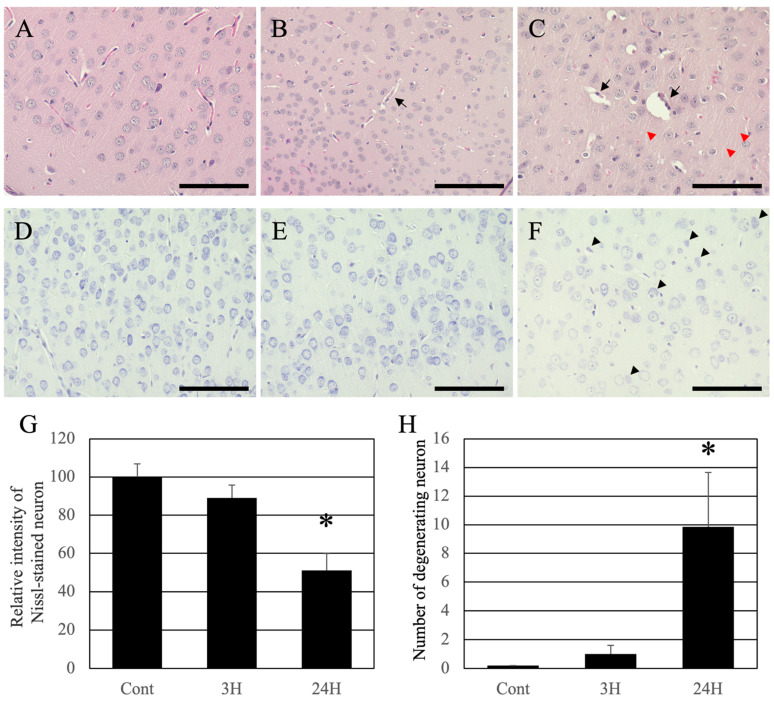
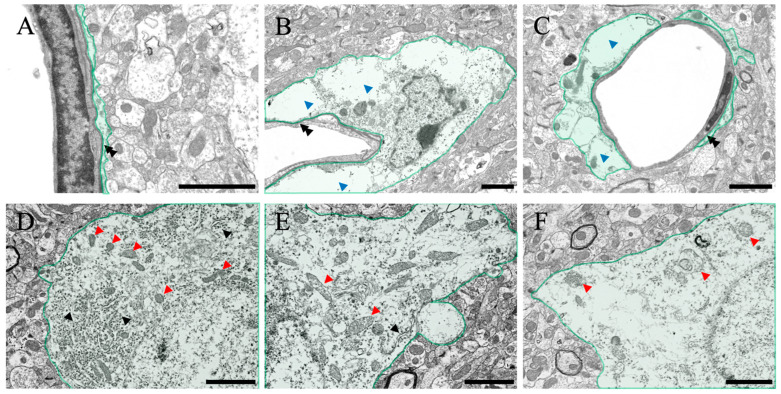
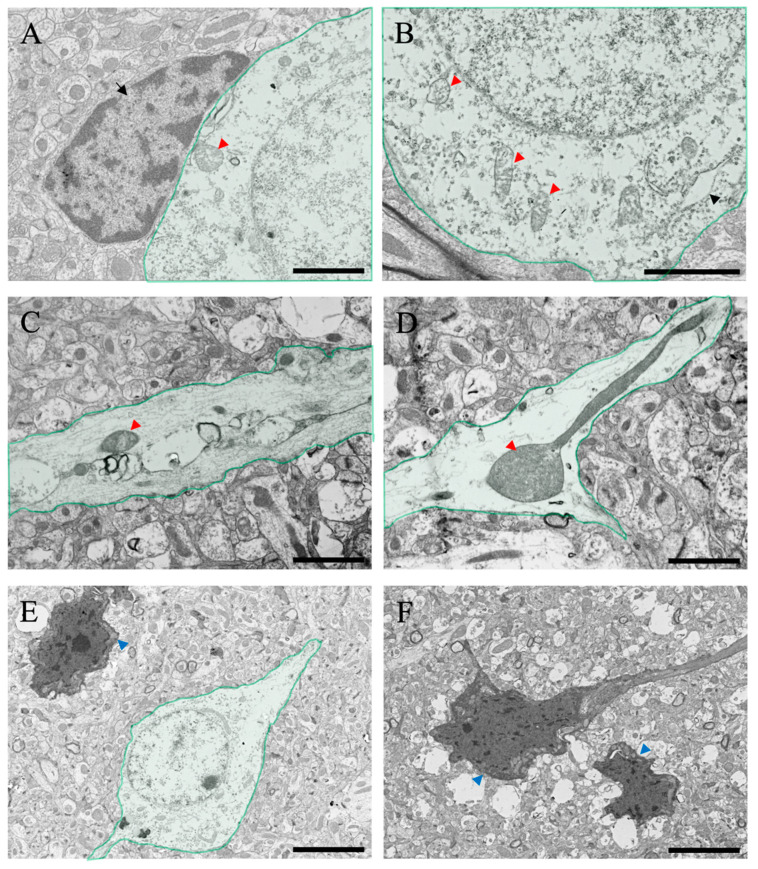
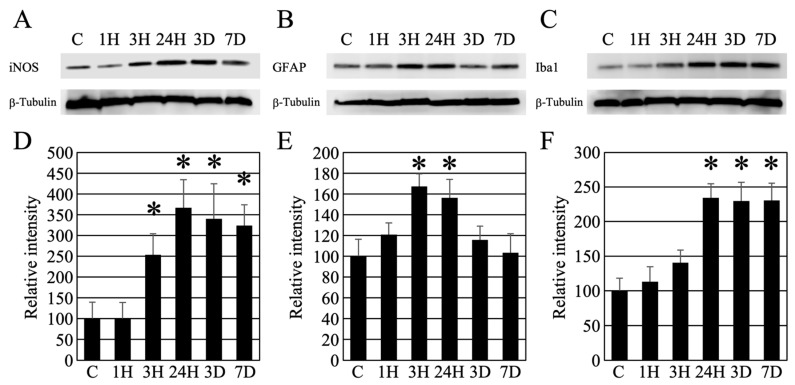
Liver dysfunction is the main cause of hepatic encephalopathy. However, histopathological changes in the brain associated with hepatic encephalopathy remain unclear. Therefore, we investigated pathological changes in the liver and brain using an acute hepatic encephalopathy mouse model. After administering ammonium acetate, a transient increase in the blood ammonia level was observed, which returned to normal levels after 24 h. Consciousness and motor levels also returned to normal. It was revealed that hepatocyte swelling, and cytoplasmic vacuolization progressed over time in the liver tissue. Blood biochemistry also suggested hepatocyte dysfunction. In the brain, histopathological changes, such as perivascular astrocyte swelling, were observed 3 h after ammonium acetate administration. Abnormalities in neuronal organelles, especially mitochondria and rough endoplasmic reticulum, were also observed. Additionally, neuronal cell death was observed 24 h post-ammonia treatment when blood ammonia levels had returned to normal. Activation of reactive microglia and increased expression of inducible nitric oxide synthase (iNOS) were also observed seven days after a transient increase in blood ammonia. These results suggest that delayed neuronal atrophy could be iNOS-mediated cell death due to activation of reactive microglia. The findings also suggest that severe acute hepatic encephalopathy causes continued delayed brain cytotoxicity even after consciousness recovery.
Keywords: astrocyte; brain edema; hepatic encephalopathy; iNOS; microglial cell; pathology; scanning electron microscope; transmission electron microscope.
Conflict of interest statement
The authors declare no conflict of interest.
Figures
Similar articles
-
NF-κB in the mechanism of brain edema in acute liver failure: studies in transgenic mice.Neurobiol Dis. 2011 Feb;41(2):498-507. doi: 10.1016/j.nbd.2010.10.021. Epub 2010 Nov 16. Neurobiol Dis. 2011. PMID: 21087666 Free PMC article.
-
Increased toll-like receptor 4 in cerebral endothelial cells contributes to the astrocyte swelling and brain edema in acute hepatic encephalopathy.J Neurochem. 2014 Mar;128(6):890-903. doi: 10.1111/jnc.12516. Epub 2013 Nov 22. J Neurochem. 2014. PMID: 24261962 Free PMC article.
-
Role of cerebral endothelial cells in the astrocyte swelling and brain edema associated with acute hepatic encephalopathy.Neuroscience. 2012 Aug 30;218:305-16. doi: 10.1016/j.neuroscience.2012.05.006. Epub 2012 May 17. Neuroscience. 2012. PMID: 22609932 Free PMC article.
-
Astrocyte swelling in hepatic encephalopathy: molecular perspective of cytotoxic edema.Metab Brain Dis. 2020 Apr;35(4):559-578. doi: 10.1007/s11011-020-00549-8. Epub 2020 Mar 7. Metab Brain Dis. 2020. PMID: 32146658 Review.
-
RNA oxidation and zinc in hepatic encephalopathy and hyperammonemia.Metab Brain Dis. 2009 Mar;24(1):119-34. doi: 10.1007/s11011-008-9125-2. Epub 2009 Jan 16. Metab Brain Dis. 2009. PMID: 19148713 Review.
Cited by
-
Cytoplasmic Vacuolization: A Fascinating Morphological Alteration From Cellular Stress to Cell Death.Cancer Sci. 2025 May;116(5):1181-1192. doi: 10.1111/cas.70013. Epub 2025 Feb 27. Cancer Sci. 2025. PMID: 40017124 Free PMC article. Review.
-
The Combination of Two Small Molecules Improves Neurological Parameters and Extends the Lifespan of C3H Strain Female Mice.Brain Behav. 2025 Jun;15(6):e70573. doi: 10.1002/brb3.70573. Brain Behav. 2025. PMID: 40444523 Free PMC article.
-
Histopathological Analysis of Lipopolysaccharide-Induced Liver Inflammation and Thrombus Formation in Mice: The Protective Effects of Aspirin.Curr Issues Mol Biol. 2024 Dec 18;46(12):14291-14303. doi: 10.3390/cimb46120856. Curr Issues Mol Biol. 2024. PMID: 39727984 Free PMC article.
References
-
- Stravitz R.T., Kramer A.H., Davern T., Shaikh A.O., Caldwell S.H., Mehta R.L., Blei A.T., Fontana R.J., McGuire B.M., Rossaro L., et al. Intensive care of patients with acute liver failure: Recommendations of the U.S. Acute Liver Failure Study Group. Crit. Care Med. 2007;35:2498–2508. doi: 10.1097/01.CCM.0000287592.94554.5F. - DOI - PubMed
MeSH terms
Substances
LinkOut - more resources
Full Text Sources
