. 2023 Apr 18;24(8):7418.
doi: 10.3390/ijms24087418.

NTS, NTSR1 and ERs in the Pituitary-Gonadal Axis of Cycling and Postnatal Female Rats after BPA Treatment

Affiliations

NTS, NTSR1 and ERs in the Pituitary-Gonadal Axis of Cycling and Postnatal Female Rats after BPA Treatment

Miriam González-Gómez et al. Int J Mol Sci. .

Abstract

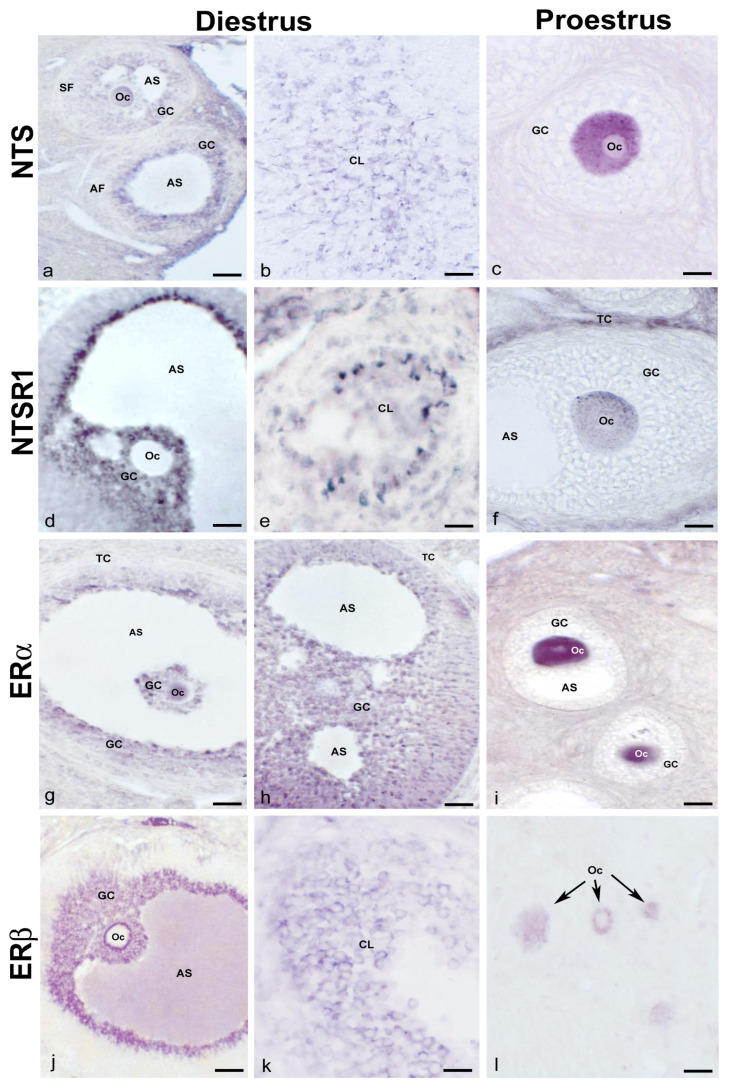
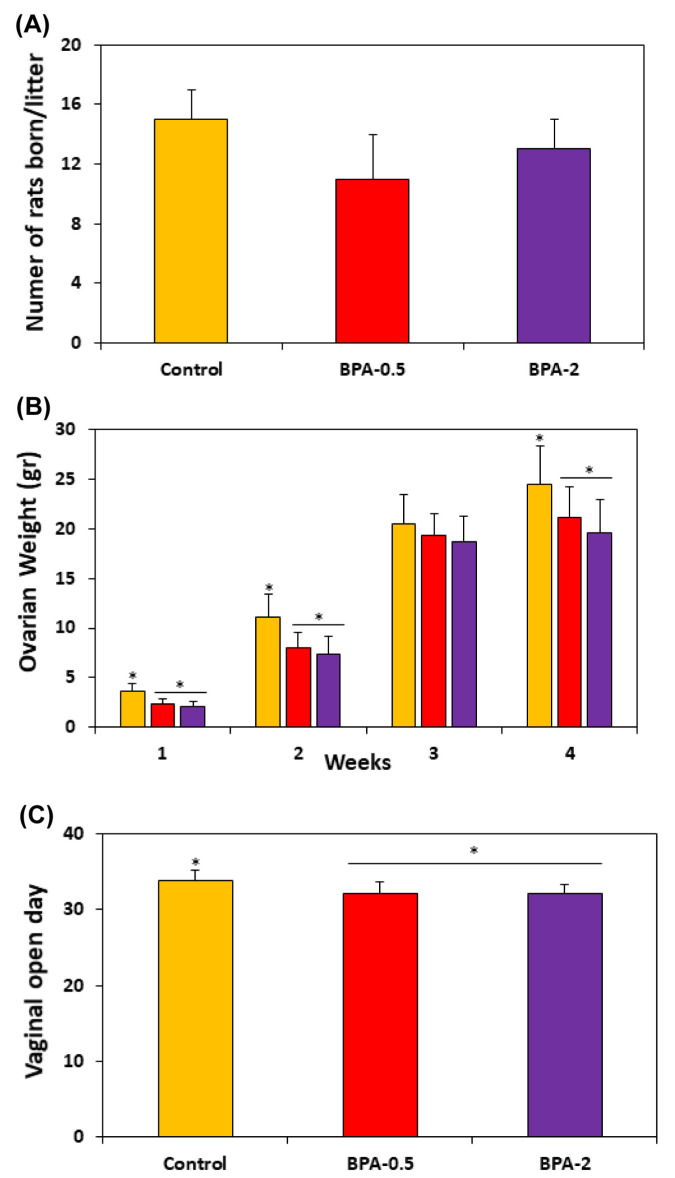
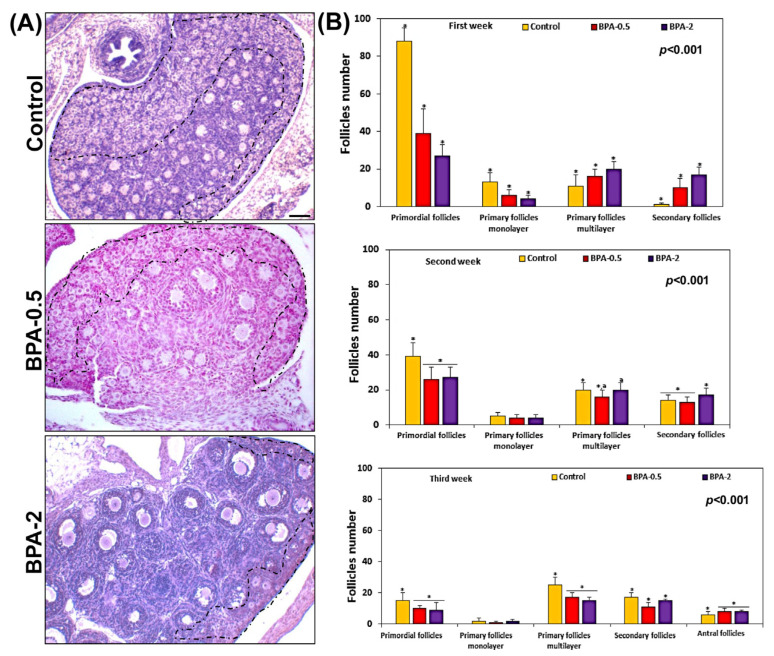
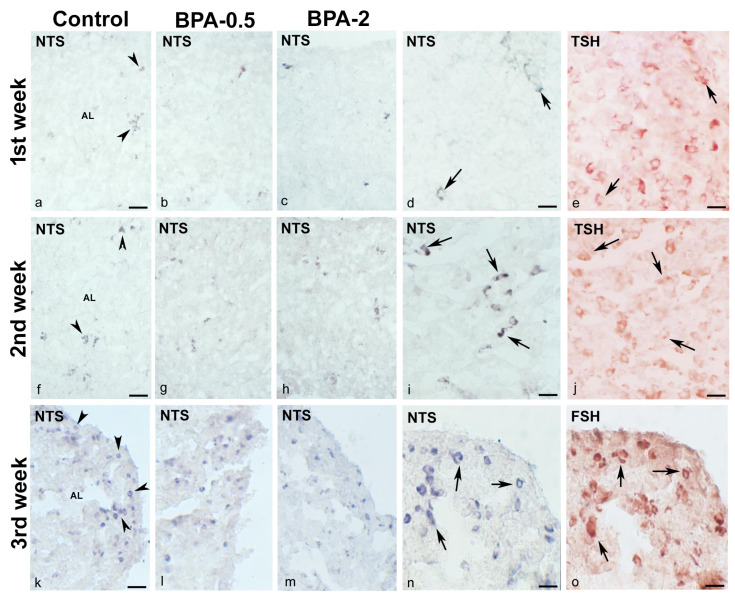
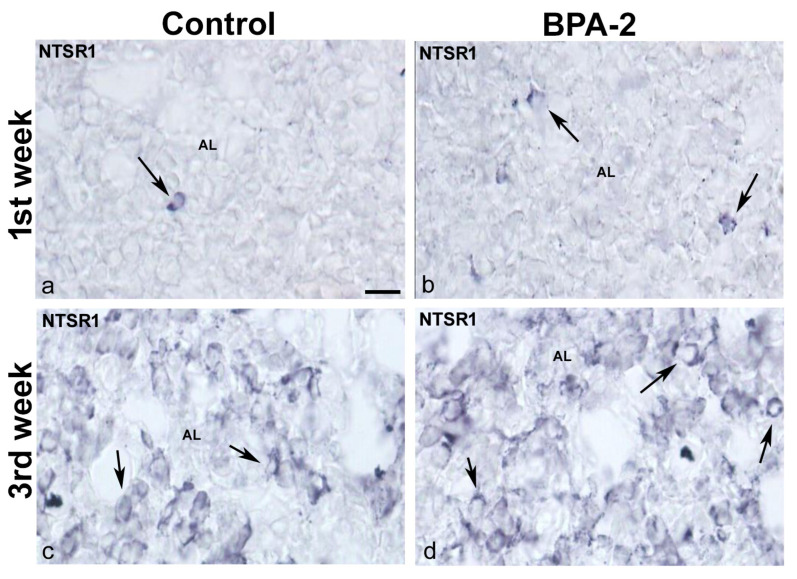
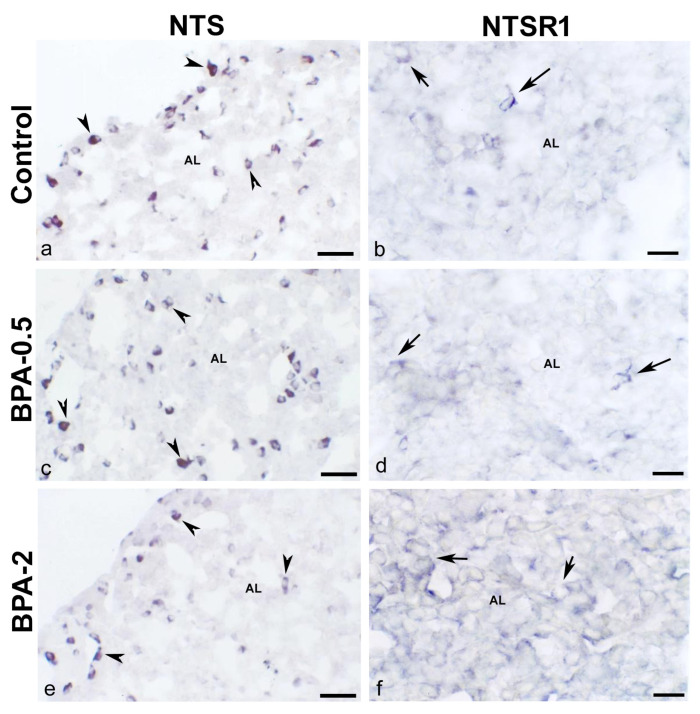
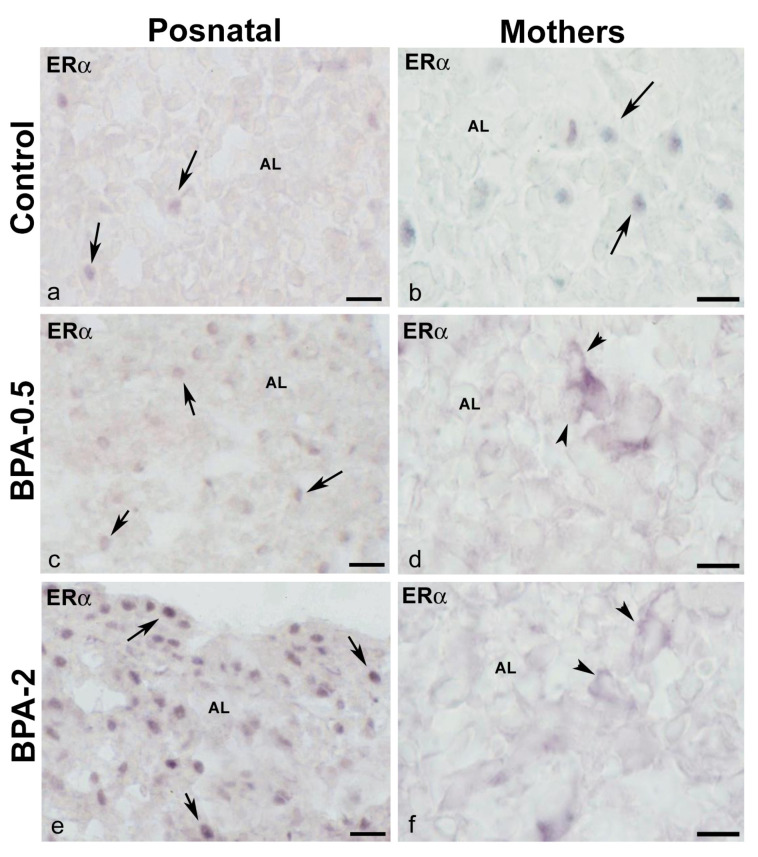
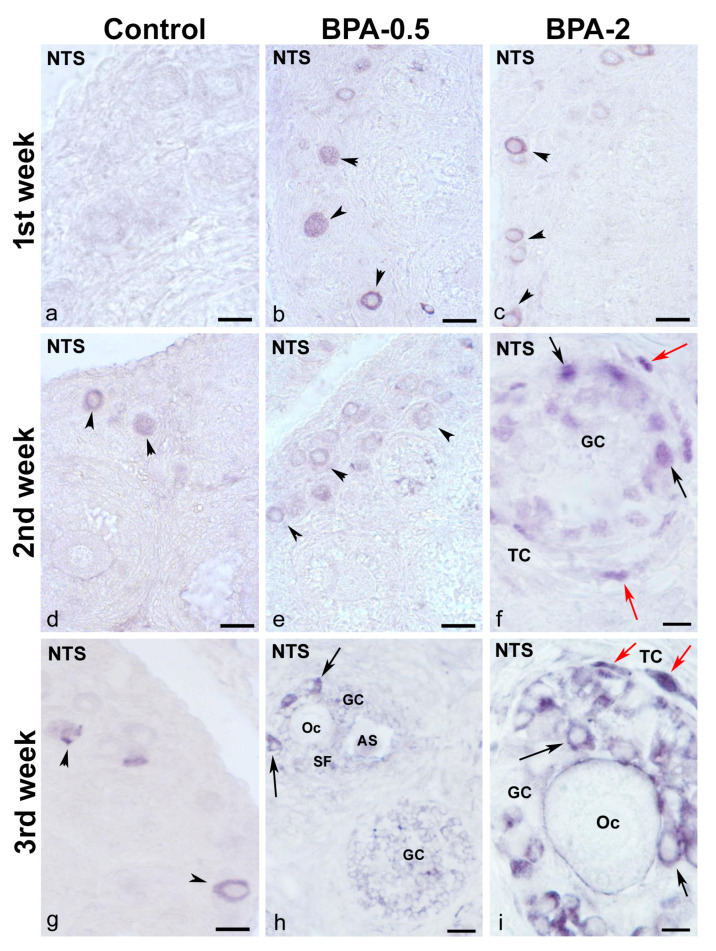
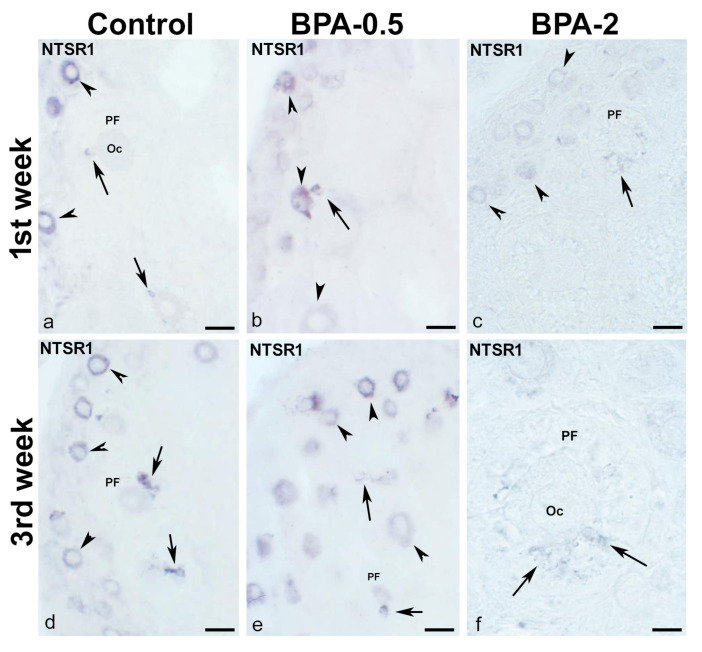
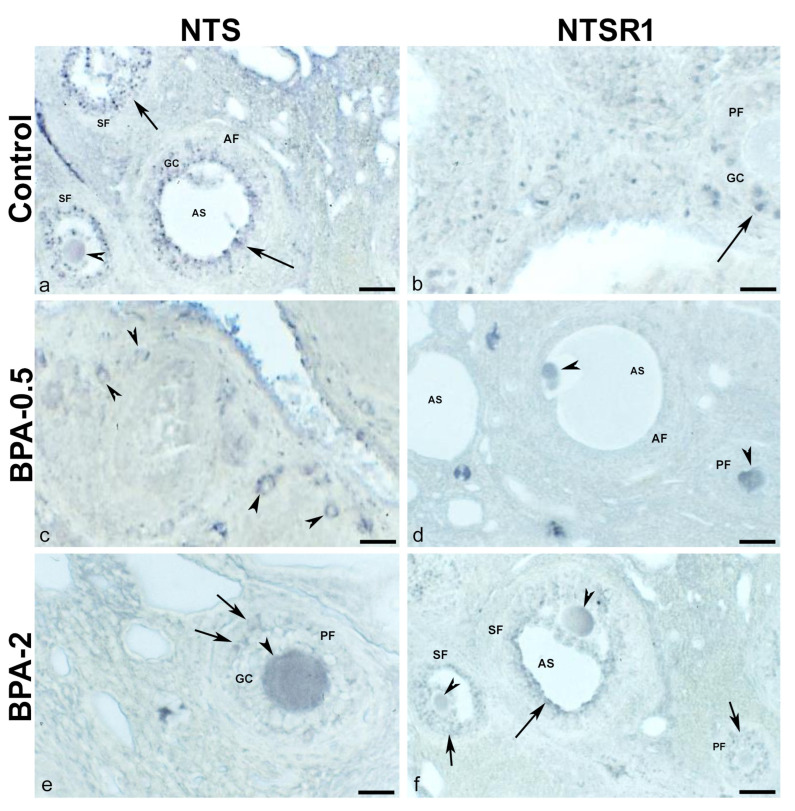
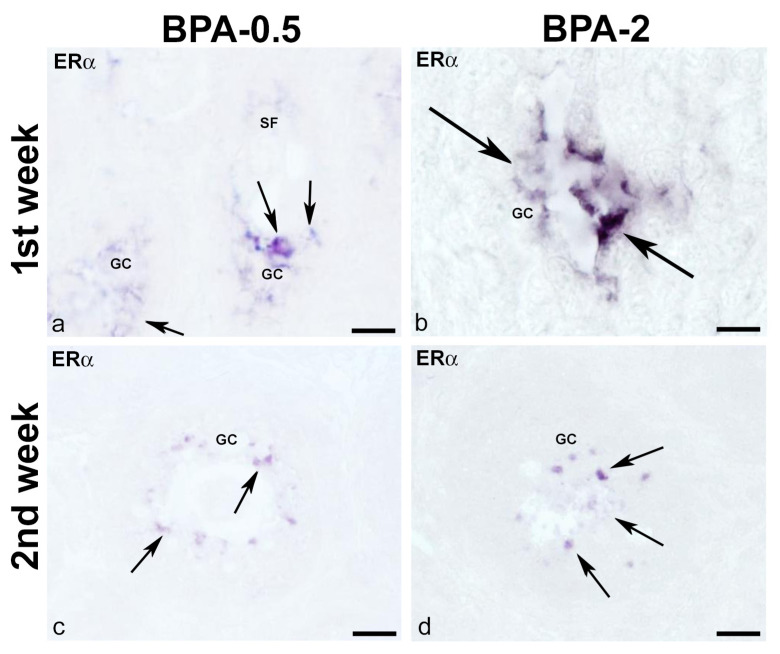
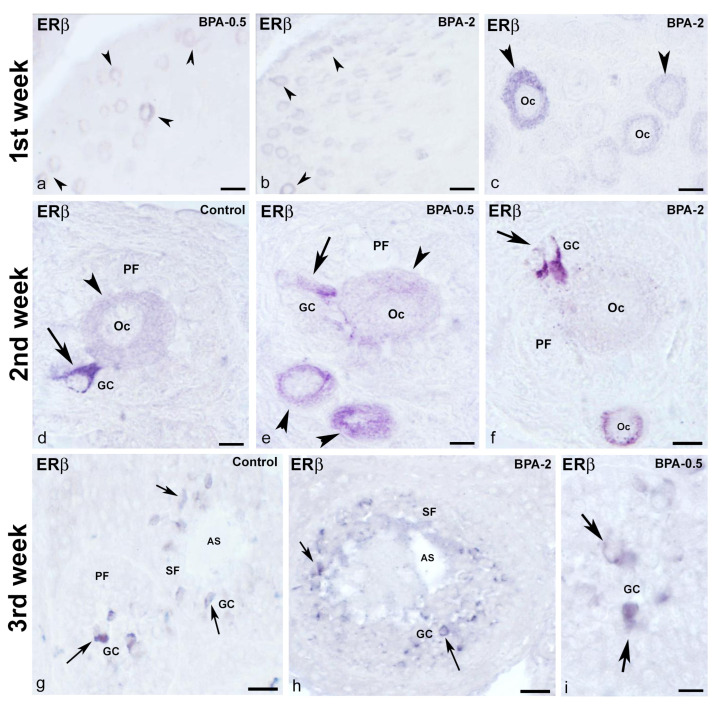
The neuropeptide neurotensin (NTS) is involved in regulating the reproductive axis and is expressed at each level of this axis (hypothalamus-pituitary-gonads). This dependence on estrogen levels has been widely demonstrated in the hypothalamus and pituitary. We focused on confirming the relationship of NTS with estrogens and the gonadal axis, using a particularly important environmental estrogenic molecule, bisphenol-A (BPA). Based on the experimental models or in vitro cell studies, it has been shown that BPA can negatively affect reproductive function. We studied for the first time the action of an exogenous estrogenic substance on the expression of NTS and estrogen receptors in the pituitary-gonadal axis during prolonged in vivo exposure. The exposure to BPA at 0.5 and 2 mg/kg body weight per day during gestation and lactation was monitored through indirect immunohistochemical procedures applied to the pituitary and ovary sections. Our results demonstrate that BPA induces alterations in the reproductive axis of the offspring, mainly after the first postnatal week. The rat pups exposed to BPA exhibited accelerated sexual maturation to puberty. There was no effect on the number of rats born per litter, although the fewer primordial follicles suggest a shorter fertile life.

Keywords: bisphenol-A; estrogen receptors; neurotensin; neurotensin receptor 1; ovaries; pituitary gland.


Conflict of interest statement

The authors declare no conflict of interest.

Figures

Figure 1
Figure 1
NTS, NTSR1, and ERα/β in normal cycling adult females. Representative images of the ovaries of cycling adult females showing NTS-ir in oocytes, granulosa cells from different follicles, the corpus luteum in diestrus phase (a,b), and in the oocyte cytoplasm of a multilayered primary follicle in proestrus phase (c); NTSR1-ir in granulosa cells of an antral follicle and cells of corpus luteum in diestrus phase (d,e), and the cytoplasm of the oocyte of a secondary follicle as well as in theca cells in proestrus phase (f); ERα-ir in the oocytes and granulosa cells of different follicles in the diestrus phase (g,h), and the cytoplasm and nucleus of the oocytes from secondary follicles in the proestrus phase (i); and ERβ-ir in the granulosa cells of an antral follicle and cells of the corpus luteum in the diestrus phase (j,k) and the cytoplasm of oocytes from primary follicles in the proestrus phase (arrows) (l). AF: antral follicle; AS: antral space; CL: corpus luteum; GC: granulosa cells; Oc: oocyte; SF: secondary follicle; TC: theca cells. Scale bars: (a,b): 50 µm; (c,f): 20 µm; (d,g,h,j): 60 µm; (e,i,k): 30 µm; and (l): 35 µm.
Figure 2
Figure 2
Graphs showing the number of rats born per litter (A); the ovarian weight in the offspring in the first four weeks of postnatal life (B); and the moment of the vaginal opening in the three experimental groups (C). Bars represent means ± SD (n = 5). The asterisks show significant differences between groups (p < 0.05).
Figure 3
Figure 3
Follicle quantification. Representative images showing the density of follicles in the three experimental groups in the first week of postnatal life. The zone containing the primordial follicles has been roughly marked with the dashed line (A); graphs showing the number of each of the different types of ovarian follicles in the three experimental groups in the first three weeks of postnatal life (B). Bars represent means ± SD (n = 5). The identical symbol (asterisk) and letter on different bars indicates significant differences between groups. (A) Scale bar: 80 µm.
Figure 4
Figure 4
NTS immunoreactivity in offspring pituitary glands. Representative images of the pituitary gland in the first three weeks of postnatal life in the three experimental groups showing the presence of NTS-ir cells (arrowheads) in the central area of the anterior lobe in the 1st (ae) and 2nd (fj) weeks and in the margins of the anterior lobe in the 3rd week (ko). Images (d,e) and (i,j) show NTS colocalization with TSH (arrows) in the 1st and 2nd weeks in control and BPA-0.5, respectively, and images (n,o) show NTS colocalization with FSH (arrows) in the 3rd week in BPA-2. AL: anterior lobe. Scale bars: (ac), (fh), and (km): 60 µm; (d,e), (i,j), and (n,o): 25 µm. (ad), (fi), and (kn) immunoperoxidase chloronaphthol. (e,j,o) immunoperoxidase ethyl carbazole.
Figure 5
Figure 5
NTSR1 immunoreactivity in the offspring pituitary gland. Representative images of the pituitary gland in the first (a,b) and third (c,d) weeks of postnatal life showing the presence of NTSR1-ir cells (arrows) in the central area of the anterior lobe in the control and BPA-2 groups. AL: anterior lobe. Scale bar: 25 µm.
Figure 6
Figure 6
NTS and NTSR1 immunoreactivity in the mother’s pituitary gland. Representative images of the pituitary gland in mothers after weaning/lactation showing the presence of NTS-ir cells (arrowheads) (a,c,e) and NTSR1-ir cells (arrows) (b,d,f) in the three experimental groups. AL: anterior lobe. Scale bars: (a,c,e): 35 µm and (b,d,f): 25 µm.
Figure 7
Figure 7
ERα immunoreactivity in offspring and the mother’s pituitary gland. Representative images of the pituitary gland in offspring at the first week of postnatal life (a,c,e) and mothers after weaning/lactation (b,d,f) showing the presence of ERα-ir cells in the anterior lobe in the three experimental groups. The nuclear location of ERα immunoreactivity in offspring and control mothers is indicated with arrows, while the cytosolic location in BPA-treated mothers is indicated with arrowheads. AL: anterior lobe. Scale bars: (a,c,e): 25 µm and (b,d,f): 20 µm.
Figure 8
Figure 8
NTS immunoreactivity in offspring ovaries. Representative images of the ovary in the three experimental groups in the first three weeks of postnatal life showing the presence of NTS-ir in oocytes from primordial and primary follicles (arrowheads) (ae,g) as well as in granulosa cells from multilayered primary (f,i) and secondary (h) follicles (black arrows) and in theca cells (red arrows). AS: antral space; GC: granulosa cells; Oc: oocyte; SF: secondary follicle; TC: theca cells. Scale bars: (ae): 40 µm; (f): 12 µm; (g): 30 µm; (h): 15 µm; and (i): 10 µm.
Figure 9
Figure 9
NTSR1 immunoreactivity in offspring ovaries. Representative images of the ovary in the three experimental groups in the first (ac) and third (df) weeks of postnatal life show the presence of NTS-ir in oocytes from primordial follicles (arrowheads) as well as in granulosa cells from different primary follicles (arrows). Oc: oocyte; PF: primary follicle. Scale bars: (ae): 40 µm; (f): 15 µm.
Figure 10
Figure 10
NTS and NTSR1 immunoreactivity in the mother’s ovaries. Representative images of the ovary in mothers after weaning/lactation showing the presence of NTS-ir (a,c,e) and NTSR1-ir (b,d,f) in oocytes (arrowheads) and granulosa cells (arrows) in the different follicles in the three experimental groups. AF: antral follicle; AS: antral space; GC: granulosa cells; PF: primary follicle; SF: secondary follicle. Scale bars: (a,c,d,f): 40 µm; (b,e): 20 µm.
Figure 11
Figure 11
ERα immunoreactivity in offspring ovaries. Representative images of the ovary in the BPA-treated groups in the first (a,b) and second (c,d) weeks of postnatal life showing the presence of ERα-ir in granulosa cells (arrows) of secondary follicles. GC: granulosa cells; SF: secondary follicle. Scale bars: (a,c,d): 30 µm; (b) 15 µm.
Figure 12
Figure 12
ERβ immunoreactivity in offspring ovaries. Representative images of the ovary in the three experimental groups in the three first weeks of postnatal life showing the presence of ERβ-ir in oocytes (arrowheads) from primordial follicles in the first week (ac), in oocytes (arrowheads) from primordial and primary follicles as well as in granulosa cells (arrows) from primary follicles in the second week (df) and granulosa cells (arrows) from primary and secondary follicles in the third week (gi). AS: antral space; GC: granulosa cells; Oc: oocyte; PF: primary follicle; SF: secondary follicle. Scale bars: (a,b): 40 µm; (c,f): 20 µm; (d,e,i): 10 µm; (g): 45 µm; (h): 36 µm.
Figure 13
Figure 13
ERα and ERβ immunoreactivity in the mother’s ovaries. Representative images of the ovary in mothers after weaning/lactation, showing the presence of ERα-ir (a,c) and ERβ-ir (b,d) in oocytes (arrowheads) and granulosa cells (arrows) from multi-layered primary follicle, secondary and antral follicles in the control and BPA-0.5 groups. AF: antral follicle; AS: antral space; GC: granulosa cells; mPF: multilayered primary follicle; SF: secondary follicle. Scale bars: (ad): 60 µm.

Similar articles

Cited by

References

    1. Alexander M.J. Estrogen-regulated synthesis of neurotensin in neurosecretory cells of the hypothalamic arcuate nucleus in the female rat. Endocrinology. 1993;133:1809–1816. doi: 10.1210/endo.133.4.8404623. - DOI - PubMed
    1. Alexander M.J., Dobner P.R., Miller M.A., Bullock B.P., Dorsa D.M., Leeman S.E. Estrogen induces neurotensin/neuromedin N messenger ribonucleic acid in a preoptic nucleus essential for the preovulatory surge of luteinizing hormone in the rat. Endocrinology. 1989;125:2111–2117. doi: 10.1210/endo-125-4-2111. - DOI - PubMed
    1. Alexander M.J., Kiraly Z.J., Leeman S.E. Sexually dimorphic distribution of neurotensin/neuromedin N mRNA in the rat preoptic area. J. Comp. Neurol. 1991;311:84–96. doi: 10.1002/cne.903110107. - DOI - PubMed
    1. Alexander M.J., Mahoney P.D., Ferris C.F., Carraway R.E., Leeman S.E. Evidence that neurotensin participates in the central regulation of the preovulatory surge of luteinizing hormone in the rat. Endocrinology. 1989;124:783–788. doi: 10.1210/endo-124-2-783. - DOI - PubMed
    1. Axelson J.F., Shannon W., Van Leeuwen F.W. Immunocytochemical localization of estrogen receptors within neurotensin cells in the rostral preoptic area of the rat hypothalamus. Neurosci. Lett. 1992;136:5–9. doi: 10.1016/0304-3940(92)90634-J. - DOI - PubMed

LinkOut - more resources