

Genome-Wide Identification, Expression, and Response to Fusarium Infection of the SWEET Gene Family in Garlic (Allium sativum L.)
- PMID: 37108694
- PMCID: PMC10138969
- DOI: 10.3390/ijms24087533
Genome-Wide Identification, Expression, and Response to Fusarium Infection of the SWEET Gene Family in Garlic (Allium sativum L.)
Abstract
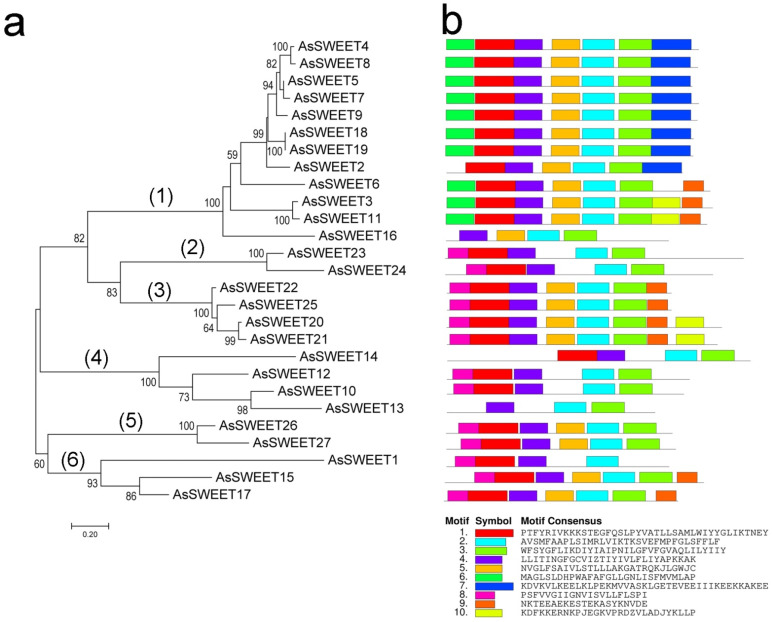
Proteins of the SWEET (Sugar Will Eventually be Exported Transporters) family play an important role in plant development, adaptation, and stress response by functioning as transmembrane uniporters of soluble sugars. However, the information on the SWEET family in the plants of the Allium genus, which includes many crop species, is lacking. In this study, we performed a genome-wide analysis of garlic (Allium sativum L.) and identified 27 genes putatively encoding clade I-IV SWEET proteins. The promoters of the A. sativum (As) SWEET genes contained hormone- and stress-sensitive elements associated with plant response to phytopathogens. AsSWEET genes had distinct expression patterns in garlic organs. The expression levels and dynamics of clade III AsSWEET3, AsSWEET9, and AsSWEET11 genes significantly differed between Fusarium-resistant and -susceptible garlic cultivars subjected to F. proliferatum infection, suggesting the role of these genes in the garlic defense against the pathogen. Our results provide insights into the role of SWEET sugar uniporters in A. sativum and may be useful for breeding Fusarium-resistant Allium cultivars.
Keywords: Allium sativum L.; Fusarium; SWEET uniporters; biotic stress; garlic; gene expression; gene structure.
Conflict of interest statement
The authors declare no conflict of interest. The funders had no role in the design of the study; in the collection, analyses, or interpretation of data; in the writing of the manuscript, or in the decision to publish the results.
Figures


Similar articles
-
Genome-Wide Identification and Expression of Chitinase Class I Genes in Garlic (Allium sativum L.) Cultivars Resistant and Susceptible to Fusarium proliferatum.Plants (Basel). 2021 Apr 7;10(4):720. doi: 10.3390/plants10040720. Plants (Basel). 2021. PMID: 33917252 Free PMC article.
-
Pathogenesis-Related Genes of PR1, PR2, PR4, and PR5 Families Are Involved in the Response to Fusarium Infection in Garlic (Allium sativum L.).Int J Mol Sci. 2021 Jun 22;22(13):6688. doi: 10.3390/ijms22136688. Int J Mol Sci. 2021. PMID: 34206508 Free PMC article.
-
Thaumatin-like Protein (TLP) Genes in Garlic (Allium sativum L.): Genome-Wide Identification, Characterization, and Expression in Response to Fusarium proliferatum Infection.Plants (Basel). 2022 Mar 11;11(6):748. doi: 10.3390/plants11060748. Plants (Basel). 2022. PMID: 35336630 Free PMC article.
-
From Functional Characterization to the Application of SWEET Sugar Transporters in Plant Resistance Breeding.J Agric Food Chem. 2022 May 4;70(17):5273-5283. doi: 10.1021/acs.jafc.2c00582. Epub 2022 Apr 21. J Agric Food Chem. 2022. PMID: 35446562 Review.
-
Plant SWEET Family of Sugar Transporters: Structure, Evolution and Biological Functions.Biomolecules. 2022 Jan 25;12(2):205. doi: 10.3390/biom12020205. Biomolecules. 2022. PMID: 35204707 Free PMC article. Review.
Cited by
-
Genetic Characterization of SWEET Genes in Coconut Palm.Plants (Basel). 2025 Feb 23;14(5):686. doi: 10.3390/plants14050686. Plants (Basel). 2025. PMID: 40094616 Free PMC article.
-
Genome-wide identification of SWEET family genes and functional analysis of NtSWEET12i under drought and saline-alkali stresses in tobacco.BMC Plant Biol. 2025 Feb 14;25(1):195. doi: 10.1186/s12870-025-06190-w. BMC Plant Biol. 2025. PMID: 39953388 Free PMC article.
-
Integrated genome-wide association and transcriptomic studies reveal genetic architecture of bulb storability of plentiful garlic germplasm resources.Hortic Res. 2024 Sep 16;11(12):uhae260. doi: 10.1093/hr/uhae260. eCollection 2024 Dec. Hortic Res. 2024. PMID: 39664692 Free PMC article.
-
Identification and expression analysis of the SWEET genes in radish reveal their potential functions in reproductive organ development.Mol Biol Rep. 2023 Sep;50(9):7535-7546. doi: 10.1007/s11033-023-08701-0. Epub 2023 Jul 27. Mol Biol Rep. 2023. PMID: 37501046
-
DREB1 and DREB2 Genes in Garlic (Allium sativum L.): Genome-Wide Identification, Characterization, and Stress Response.Plants (Basel). 2023 Jul 3;12(13):2538. doi: 10.3390/plants12132538. Plants (Basel). 2023. PMID: 37447098 Free PMC article.
References
-
- Duarte-Delgado D., Ñústez-López C.E., Narváez-Cuenca C.E., Restrepo-Sánchez L.P., Melo S.E., Sarmiento F., Kushalappa A.C., Mosquera-Vásquez T. Natural variation of sucrose, glucose and fructose contents in Colombian genotypes of Solanum tuberosum Group Phureja at harvest. J. Sci. Food Agric. 2016;96:4288–4294. doi: 10.1002/jsfa.7783. - DOI - PMC - PubMed
MeSH terms
Substances
Grants and funding
LinkOut - more resources
Full Text Sources
Research Materials
