A Comparative Analysis to Dissect the Histological and Molecular Differences among Lipedema, Lipohypertrophy and Secondary Lymphedema
- PMID: 37108757
- PMCID: PMC10144050
- DOI: 10.3390/ijms24087591
A Comparative Analysis to Dissect the Histological and Molecular Differences among Lipedema, Lipohypertrophy and Secondary Lymphedema
Abstract
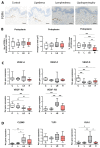
Lipedema, lipohypertrophy and secondary lymphedema are three conditions characterized by disproportionate subcutaneous fat accumulation affecting the extremities. Despite the apparent similarities and differences among their phenotypes, a comprehensive histological and molecular comparison does not yet exist, supporting the idea that there is an insufficient understanding of the conditions and particularly of lipohypertrophy. In our study, we performed histological and molecular analysis in anatomically-, BMI- and gender-matched samples of lipedema, lipohypertrophy and secondary lymphedema versus healthy control patients. Hereby, we found a significantly increased epidermal thickness only in patients with lipedema and secondary lymphedema, while significant adipocyte hypertrophy was identified in both lipedema and lipohypertrophy. Interestingly, the assessment of lymphatic vessel morphology showed significantly decreased total area coverage in lipohypertrophy versus the other conditions, while VEGF-D expression was significantly decreased across all conditions. The analysis of junctional genes often associated with permeability indicated a distinct and higher expression only in secondary lymphedema. Finally, the evaluation of the immune cell infiltrate verified the increased CD4+ cell and macrophage infiltration in lymphedema and lipedema respectively, without depicting a distinct immune cell profile in lipohypertrophy. Our study describes the distinct histological and molecular characteristics of lipohypertrophy, clearly distinguishing it from its two most important differential diagnoses.
Keywords: CD4+ cells; VEGFD; adipose tissue disorders; lipedema; lipohypertrophy; lymphatic vessels; macrophages; secondary lymphedema.
Conflict of interest statement
The authors declare no conflict of interest.
Figures


Similar articles
-
Adipose Tissue Hypertrophy, An Aberrant Biochemical Profile and Distinct Gene Expression in Lipedema.J Surg Res. 2020 Sep;253:294-303. doi: 10.1016/j.jss.2020.03.055. Epub 2020 May 11. J Surg Res. 2020. PMID: 32407981
-
Increased levels of VEGF-C and macrophage infiltration in lipedema patients without changes in lymphatic vascular morphology.Sci Rep. 2020 Jul 2;10(1):10947. doi: 10.1038/s41598-020-67987-3. Sci Rep. 2020. PMID: 32616854 Free PMC article.
-
A distinct M2 macrophage infiltrate and transcriptomic profile decisively influence adipocyte differentiation in lipedema.Front Immunol. 2022 Dec 20;13:1004609. doi: 10.3389/fimmu.2022.1004609. eCollection 2022. Front Immunol. 2022. PMID: 36605202 Free PMC article.
-
Current Mechanistic Understandings of Lymphedema and Lipedema: Tales of Fluid, Fat, and Fibrosis.Int J Mol Sci. 2022 Jun 14;23(12):6621. doi: 10.3390/ijms23126621. Int J Mol Sci. 2022. PMID: 35743063 Free PMC article. Review.
-
[Lipedema, a barely known disease: diagnosis, associated diseases and therapy].Orv Hetil. 2008 Nov 9;149(45):2121-7. doi: 10.1556/OH.2008.28490. Orv Hetil. 2008. PMID: 18977739 Review. Hungarian.
Cited by
-
Characterization of Immune Cell Infiltration and Collagen Type III Disorganization in Human Secondary Lymphedema: A Case-control Study.Plast Reconstr Surg Glob Open. 2024 Jun 17;12(6):e5906. doi: 10.1097/GOX.0000000000005906. eCollection 2024 Jun. Plast Reconstr Surg Glob Open. 2024. PMID: 38911579 Free PMC article.
-
Lipedema: A Disease Triggered by M2 Polarized Macrophages?Biomedicines. 2025 Feb 23;13(3):561. doi: 10.3390/biomedicines13030561. Biomedicines. 2025. PMID: 40149538 Free PMC article. Review.
References
-
- Herpertz U. Lipedema. Z. Lymphol. 1995;19:1–11. - PubMed
-
- Stemmer R. Stemmer’s sign—Possibilities and limits of clinical diagnosis of lymphedema. Wien. Med. Wochenschr. 1999;149:85–86. - PubMed
-
- Felmerer G., Stylianaki A., Hollmén M., Ströbel P., Stepniewski A., Wang A., Frueh F.S., Kim B.-S., Giovanoli P., Lindenblatt N., et al. Increased levels of VEGF-C and macrophage infiltration in lipedema patients without changes in lymphatic vascular morphology. Sci. Rep. 2020;10:10947. doi: 10.1038/s41598-020-67987-3. - DOI - PMC - PubMed
MeSH terms
Grants and funding
LinkOut - more resources
Full Text Sources
Medical
Research Materials

