

Differential Early Mechanistic Frontal Lobe Responses to Choline Chloride and Soy Isoflavones in an Experimental Model of Fetal Alcohol Spectrum Disorder
- PMID: 37108779
- PMCID: PMC10145811
- DOI: 10.3390/ijms24087595
Differential Early Mechanistic Frontal Lobe Responses to Choline Chloride and Soy Isoflavones in an Experimental Model of Fetal Alcohol Spectrum Disorder
Abstract
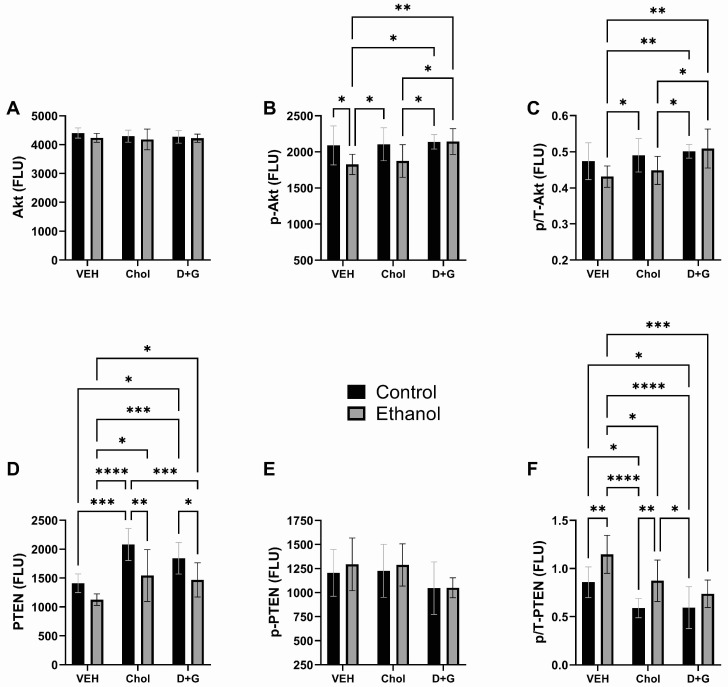
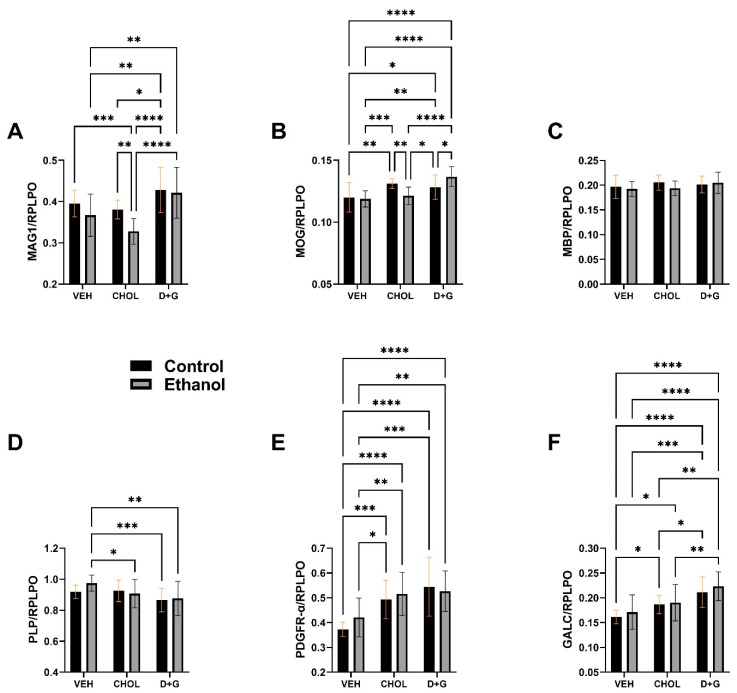
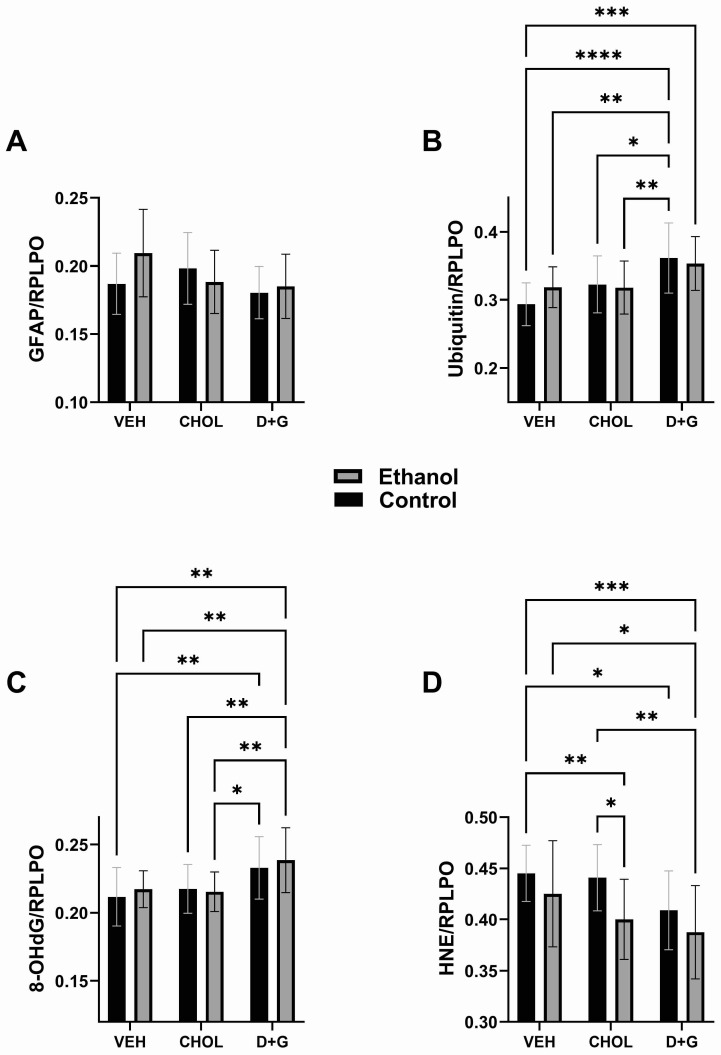
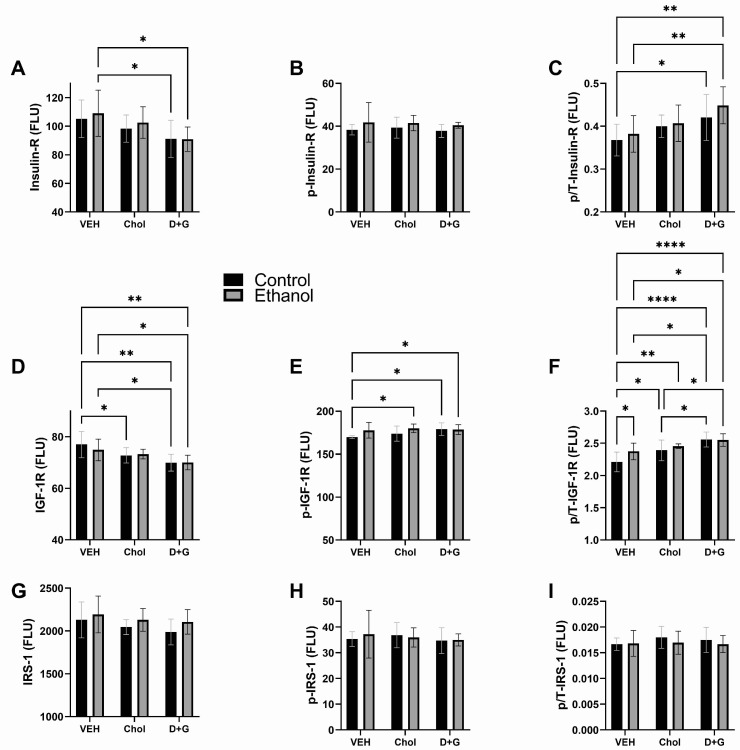
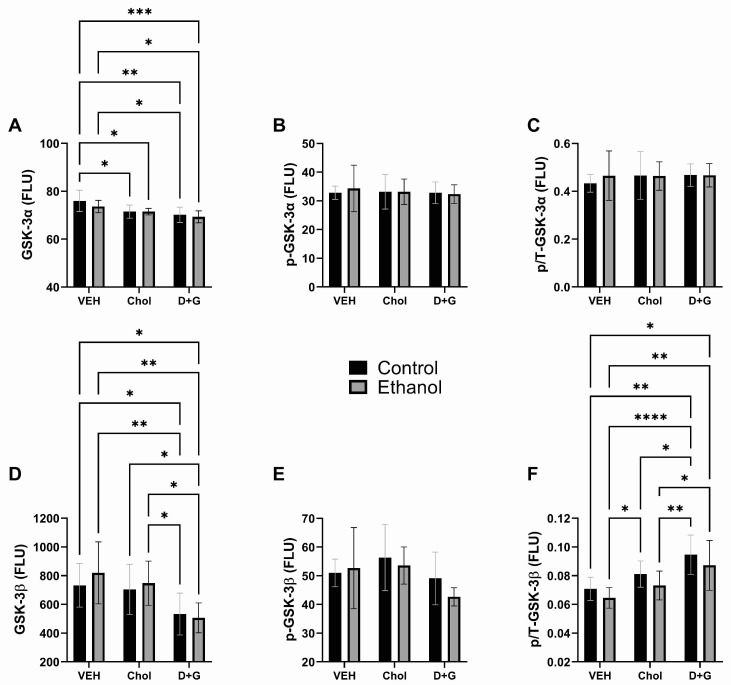
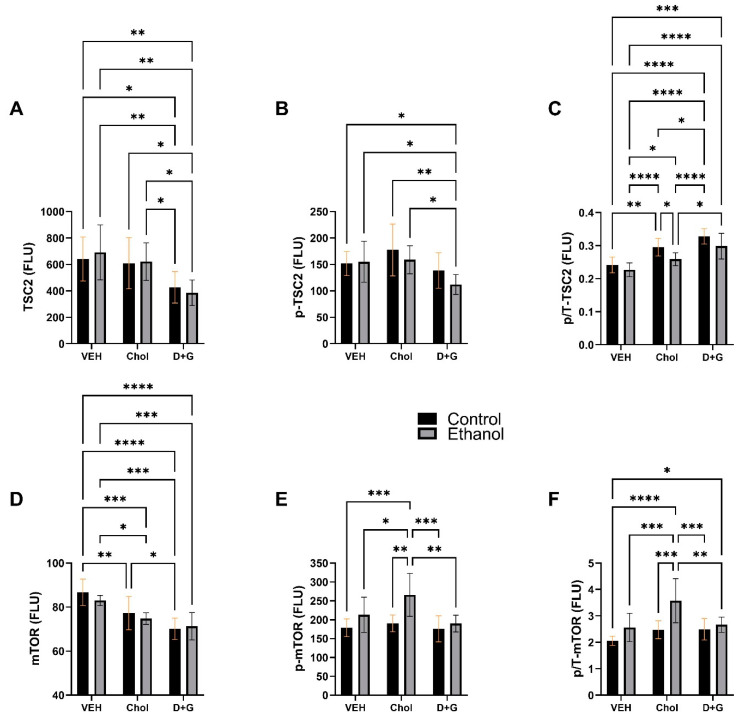
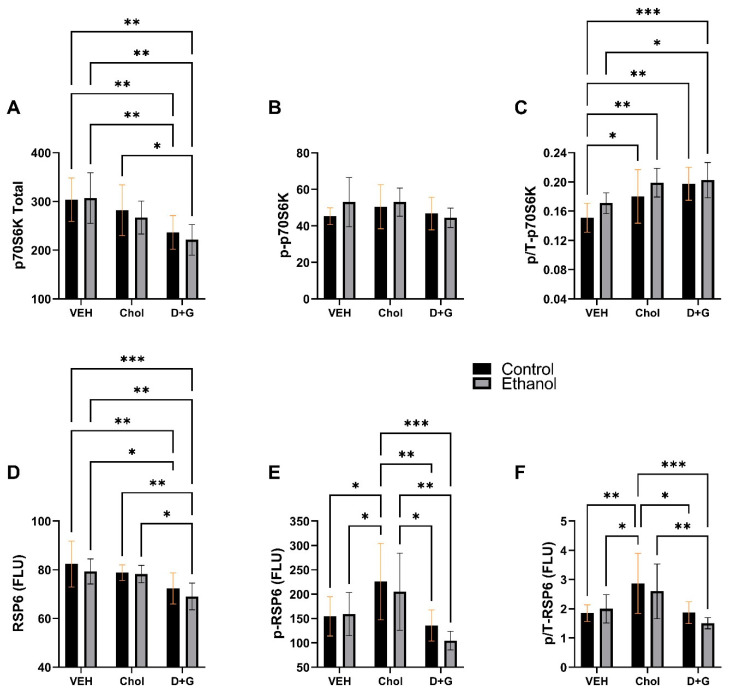
Fetal alcohol spectrum disorder (FASD) is the most common preventable cause of neurodevelopmental defects, and white matter is a major target of ethanol neurotoxicity. Therapeutic interventions with choline or dietary soy could potentially supplement public health preventive measures. However, since soy contains abundant choline, it would be important to know if its benefits are mediated by choline or isoflavones. We compared early mechanistic responses to choline and the Daidzein+Genistein (D+G) soy isoflavones in an FASD model using frontal lobe tissue to assess oligodendrocyte function and Akt-mTOR signaling. Long Evans rat pups were binge administered 2 g/Kg of ethanol or saline (control) on postnatal days P3 and P5. P7 frontal lobe slice cultures were treated with vehicle (Veh), Choline chloride (Chol; 75 µM), or D+G (1 µM each) for 72 h without further ethanol exposures. The expression levels of myelin oligodendrocyte proteins and stress-related molecules were measured by duplex enzyme-linked immunosorbent assays (ELISAs), and mTOR signaling proteins and phosphoproteins were assessed using 11-plex magnetic bead-based ELISAs. Ethanol's main short-term effects in Veh-treated cultures were to increase GFAP and relative PTEN phosphorylation and reduce Akt phosphorylation. Chol and D+G significantly modulated the expression of oligodendrocyte myelin proteins and mediators of insulin/IGF-1-Akt-mTOR signaling in both control and ethanol-exposed cultures. In general, the responses were more robust with D+G; the main exception was that RPS6 phosphorylation was significantly increased by Chol and not D+G. The findings suggest that dietary soy, with the benefits of providing complete nutrition together with Choline, could be used to help optimize neurodevelopment in humans at risk for FASD.
Keywords: FASD; choline; soy.
Conflict of interest statement
The authors declare no conflict of interest.
Figures
Similar articles
-
Dietary soy prevents fetal demise, intrauterine growth restriction, craniofacial dysmorphic features, and impairments in placentation linked to gestational alcohol exposure: Pivotal role of insulin and insulin-like growth factor signaling networks.Alcohol. 2023 Aug;110:65-81. doi: 10.1016/j.alcohol.2023.01.006. Epub 2023 Mar 9. Alcohol. 2023. PMID: 36898643 Free PMC article.
-
Differential rescue effects of choline chloride and soy isolate on metabolic dysfunction in immature central nervous system neurons: Relevance to fetal alcohol spectrum disorder.Diabetes Manag (Lond). 2023;13(Suppl 1):107-118. Epub 2023 Apr 27. Diabetes Manag (Lond). 2023. PMID: 39601020 Free PMC article.
-
Impact of Prenatal Dietary Soy on Cerebellar Neurodevelopment and Function in Experimental Fetal Alcohol Spectrum Disorder.Nutrients. 2025 Feb 26;17(5):812. doi: 10.3390/nu17050812. Nutrients. 2025. PMID: 40077682 Free PMC article.
-
Prenatal and Postnatal Choline Supplementation in Fetal Alcohol Spectrum Disorder.Nutrients. 2022 Feb 6;14(3):688. doi: 10.3390/nu14030688. Nutrients. 2022. PMID: 35277047 Free PMC article. Review.
-
What choline metabolism can tell us about the underlying mechanisms of fetal alcohol spectrum disorders.Mol Neurobiol. 2011 Oct;44(2):185-91. doi: 10.1007/s12035-011-8165-5. Epub 2011 Jan 25. Mol Neurobiol. 2011. PMID: 21259123 Free PMC article. Review.
Cited by
-
Dysregulated mTOR networks in experimental sporadic Alzheimer's disease.Front Cell Neurosci. 2024 Sep 25;18:1432359. doi: 10.3389/fncel.2024.1432359. eCollection 2024. Front Cell Neurosci. 2024. PMID: 39386180 Free PMC article.
-
Differential effects of moderate chronic ethanol consumption on neurobehavior, white matter glial protein expression, and mTOR pathway signaling with adolescent brain maturation.Am J Drug Alcohol Abuse. 2024 Jul 3;50(4):492-516. doi: 10.1080/00952990.2024.2355540. Epub 2024 Jun 7. Am J Drug Alcohol Abuse. 2024. PMID: 38847790 Free PMC article.
-
Progressive Alcohol-Related Brain Atrophy and White Matter Pathology Are Linked to Long-Term Inhibitory Effects on mTOR Signaling.Biomolecules. 2025 Mar 14;15(3):413. doi: 10.3390/biom15030413. Biomolecules. 2025. PMID: 40149949 Free PMC article.
-
Association between dietary soy prevention of fetal alcohol spectrum disorder and normalization of placental insulin and insulin-like growth factor signaling networks and downstream effector molecule expression.Gene Protein Dis. 2024;3(2):3113. doi: 10.36922/gpd.3113. Epub 2024 Jun 13. Gene Protein Dis. 2024. PMID: 39925675 Free PMC article.
References
MeSH terms
Substances
Grants and funding
LinkOut - more resources
Full Text Sources
Medical
Research Materials
Miscellaneous
