

AoMae1 Regulates Hyphal Fusion, Lipid Droplet Accumulation, Conidiation, and Trap Formation in Arthrobotrys oligospora
- PMID: 37108952
- PMCID: PMC10146936
- DOI: 10.3390/jof9040496
AoMae1 Regulates Hyphal Fusion, Lipid Droplet Accumulation, Conidiation, and Trap Formation in Arthrobotrys oligospora
Abstract
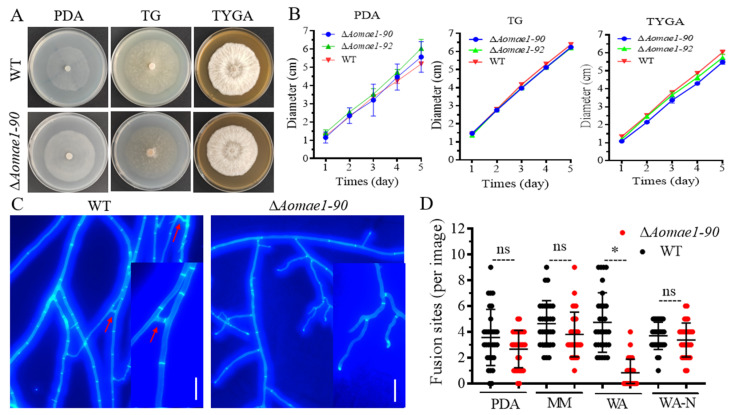
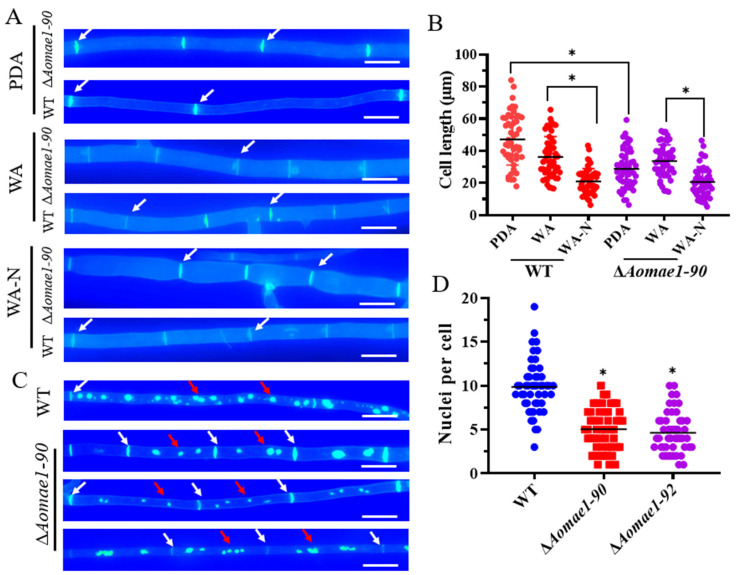
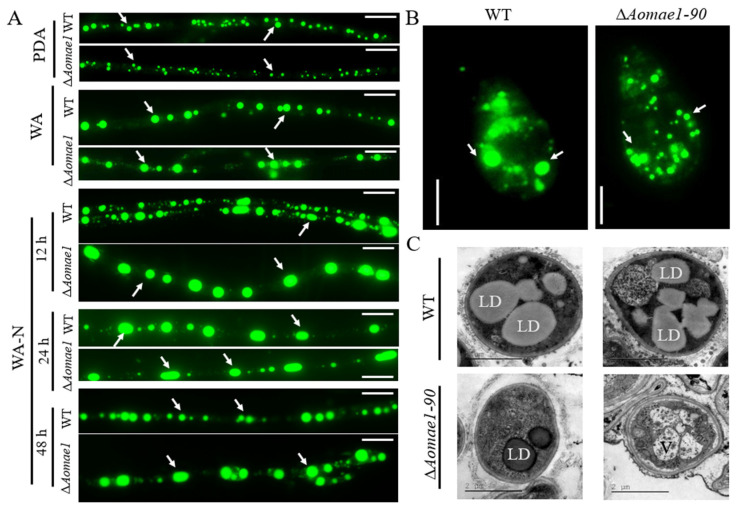
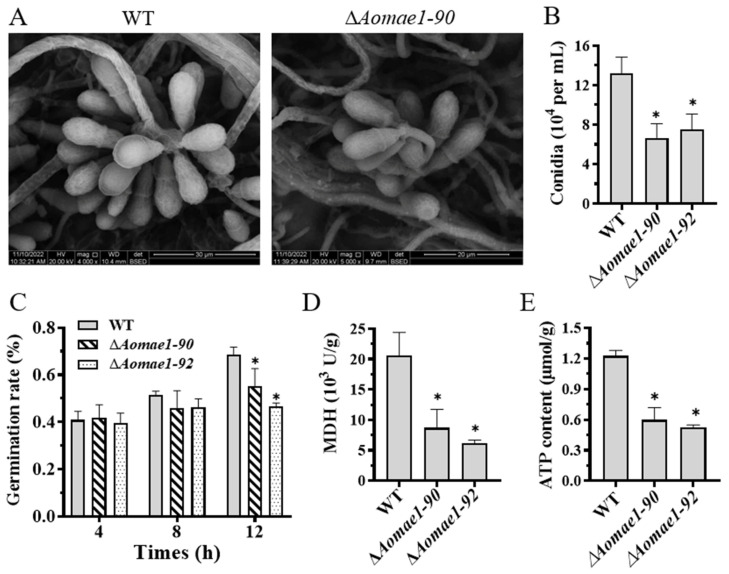
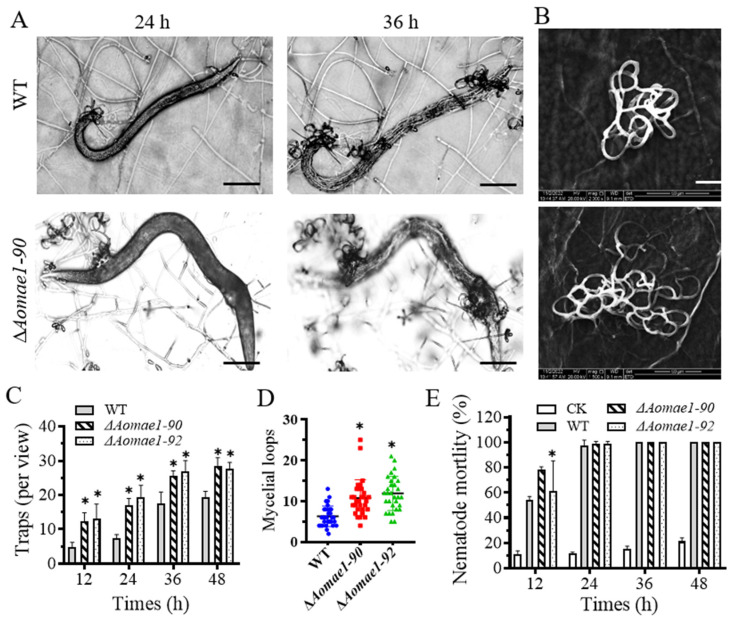
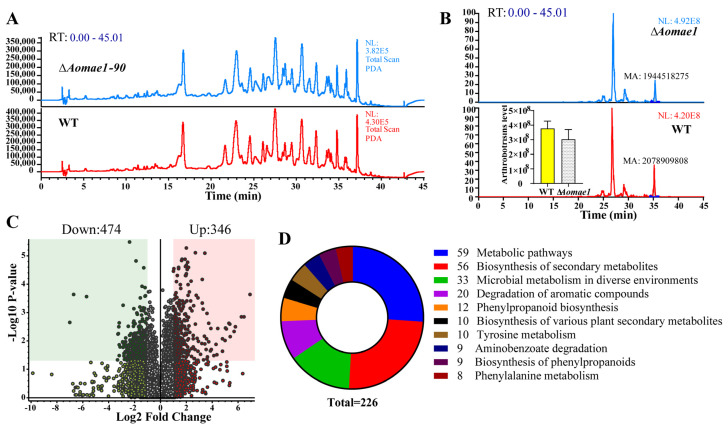
Malate dehydrogenase (MDH) is a key enzyme in the tricarboxylic acid (TCA) cycle and is essential for energy balance, growth, and tolerance to cold and salt stresses in plants. However, the role of MDH in filamentous fungi is still largely unknown. In this study, we characterized an ortholog of MDH (AoMae1) in a representative nematode-trapping (NT) fungus Arthrobotrys oligospora via gene disruption, phenotypic analysis, and nontargeted metabolomics. We found that the loss of Aomae1 led to a weakening of MDH activity and ATP content, a remarkable decrease in conidia yield, and a considerable increase in the number of traps and mycelial loops. In addition, the absence of Aomae1 also caused an obvious reduction in the number of septa and nuclei. In particular, AoMae1 regulates hyphal fusion under low nutrient conditions but not in nutrient-rich conditions, and the volumes and sizes of the lipid droplets dynamically changed during trap formation and nematode predation. AoMae1 is also involved in the regulation of secondary metabolites such as arthrobotrisins. These results suggest that Aomae1 has an important role in hyphal fusion, sporulation, energy production, trap formation, and pathogenicity in A. oligospora. Our results enhance the understanding of the crucial role that enzymes involved in the TCA cycle play in the growth, development, and pathogenicity of NT fungi.
Keywords: hyphal fusion; lipid droplet; malate dehydrogenase; pathogenicity; trap formation.
Conflict of interest statement
We declare that we have no conflicts of interest.
Figures
Similar articles
-
Involvement of AoMdr1 in the Regulation of the Fluconazole Resistance, Mycelial Fusion, Conidiation, and Trap Formation of Arthrobotrys oligospora.Microorganisms. 2023 Jun 19;11(6):1612. doi: 10.3390/microorganisms11061612. Microorganisms. 2023. PMID: 37375114 Free PMC article.
-
AoSte12 Is Required for Mycelial Development, Conidiation, Trap Morphogenesis, and Secondary Metabolism by Regulating Hyphal Fusion in Nematode-Trapping Fungus Arthrobotrys oligospora.Microbiol Spectr. 2023 Feb 14;11(2):e0395722. doi: 10.1128/spectrum.03957-22. Online ahead of print. Microbiol Spectr. 2023. PMID: 36786575 Free PMC article.
-
AoMedA has a complex regulatory relationship with AoBrlA, AoAbaA, and AoWetA in conidiation, trap formation, and secondary metabolism in the nematode-trapping fungus Arthrobotrys oligospora.Appl Environ Microbiol. 2023 Sep 28;89(9):e0098323. doi: 10.1128/aem.00983-23. Epub 2023 Sep 1. Appl Environ Microbiol. 2023. PMID: 37655869 Free PMC article.
-
Predator-prey interactions of nematode-trapping fungi and nematodes: both sides of the coin.Appl Microbiol Biotechnol. 2018 May;102(9):3939-3949. doi: 10.1007/s00253-018-8897-5. Epub 2018 Mar 9. Appl Microbiol Biotechnol. 2018. PMID: 29523933 Review.
-
Recent Advances in Life History Transition with Nematode-Trapping Fungus Arthrobotrys oligospora and Its Application in Sustainable Agriculture.Pathogens. 2023 Feb 22;12(3):367. doi: 10.3390/pathogens12030367. Pathogens. 2023. PMID: 36986289 Free PMC article. Review.
Cited by
-
Identification of a transcription factor AoMsn2 of the Hog1 signaling pathway contributes to fungal growth, development and pathogenicity in Arthrobotrys oligospora.J Adv Res. 2025 Feb;68:1-15. doi: 10.1016/j.jare.2024.02.002. Epub 2024 Feb 7. J Adv Res. 2025. PMID: 38331317 Free PMC article.
-
Involvement of AoMdr1 in the Regulation of the Fluconazole Resistance, Mycelial Fusion, Conidiation, and Trap Formation of Arthrobotrys oligospora.Microorganisms. 2023 Jun 19;11(6):1612. doi: 10.3390/microorganisms11061612. Microorganisms. 2023. PMID: 37375114 Free PMC article.
-
The Cryptochrome CryA Regulates Lipid Droplet Accumulation, Conidiation, and Trap Formation via Responses to Light in Arthrobotrys oligospora.J Fungi (Basel). 2024 Sep 1;10(9):626. doi: 10.3390/jof10090626. J Fungi (Basel). 2024. PMID: 39330386 Free PMC article.
-
Redundant and Distinct Roles of Two 14-3-3 Proteins in Fusarium sacchari, Pathogen of Sugarcane Pokkah Boeng Disease.J Fungi (Basel). 2024 Mar 28;10(4):257. doi: 10.3390/jof10040257. J Fungi (Basel). 2024. PMID: 38667928 Free PMC article.
References
-
- Tao L., Zhang Y.L., Fan S.R., Nobile C.J., Guan G.B., Huang G.H. Integration of the tricarboxylic acid (TCA) cycle with cAMP signaling and Sfl2 pathways in the regulation of CO2 sensing and hyphal development in Candida albicans. PLoS Genet. 2017;13:e1006949. doi: 10.1371/journal.pgen.1006949. - DOI - PMC - PubMed
Grants and funding
LinkOut - more resources
Full Text Sources
Research Materials
