

Primary and Immortalized Cultures of Human Proximal Tubule Cells Possess Both Progenitor and Non-Progenitor Cells That Can Impact Experimental Results
- PMID: 37108999
- PMCID: PMC10146827
- DOI: 10.3390/jpm13040613
Primary and Immortalized Cultures of Human Proximal Tubule Cells Possess Both Progenitor and Non-Progenitor Cells That Can Impact Experimental Results
Abstract
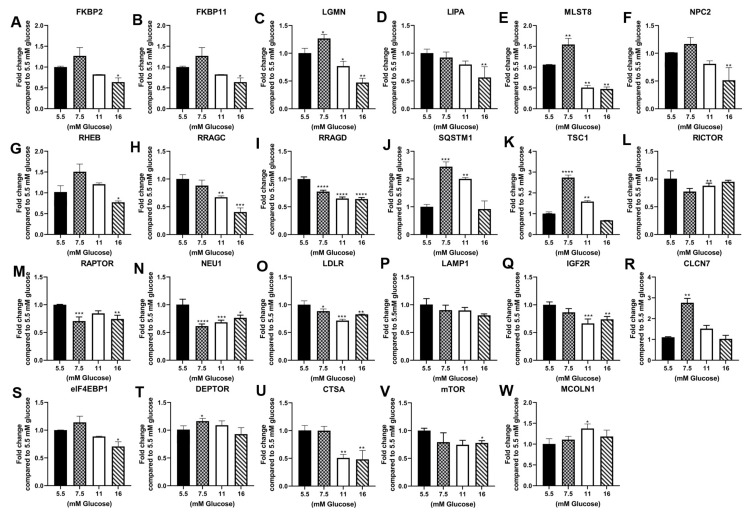
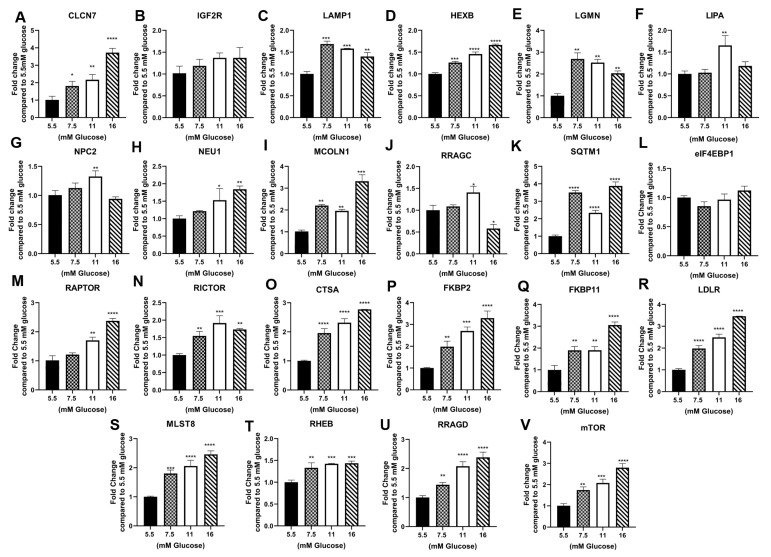
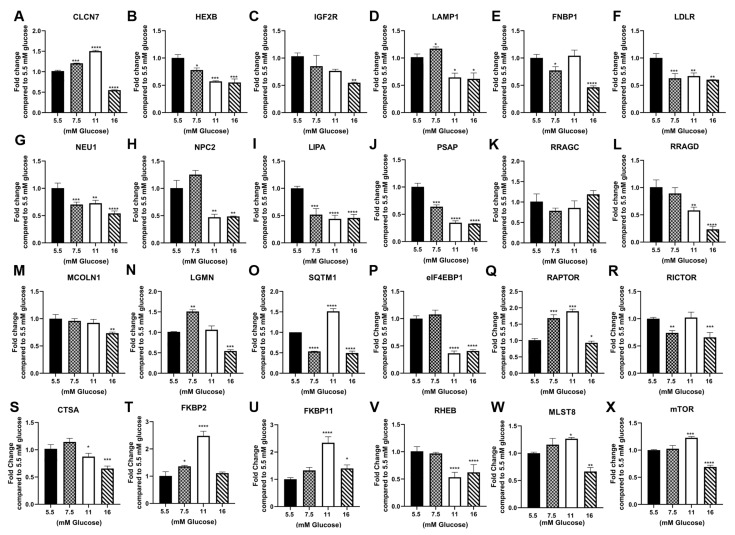
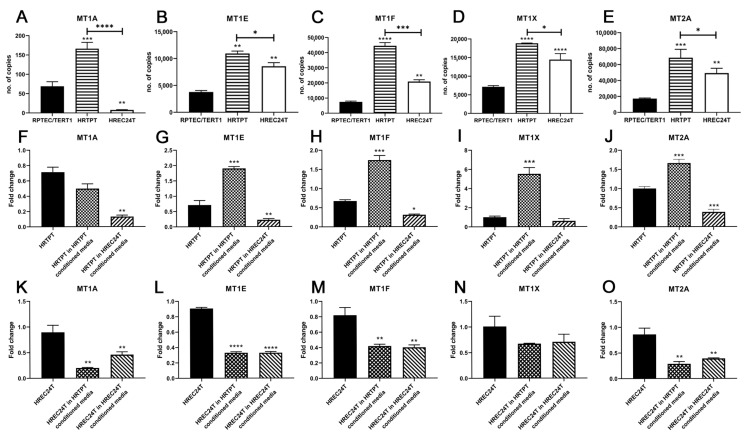
Studies have reported the presence of renal proximal tubule specific progenitor cells which co-express PROM1 and CD24 markers on the cell surface. The RPTEC/TERT cell line is a telomerase-immortalized proximal tubule cell line that expresses two populations of cells, one co-expressing PROM1 and CD24 and another expressing only CD24, identical to primary cultures of human proximal tubule cells (HPT). The RPTEC/TERT cell line was used by the authors to generate two new cell lines, HRTPT co-expressing PROM1 and CD24 and HREC24T expressing only CD24. The HRTPT cell line has been shown to express properties expected of renal progenitor cells while HREC24T expresses none of these properties. The HPT cells were used in a previous study to determine the effects of elevated glucose concentrations on global gene expression. This study showed the alteration of expression of lysosomal and mTOR associated genes. In the present study, this gene set was used to determine if pure populations of cells expressing both PROM1 and CD24 had different patterns of expression than those expressing only CD24 when exposed to elevated glucose concentrations. In addition, experiments were performed to determine whether cross-talk might occur between the two cell lines based on their expression of PROM1 and CD24. It was shown that the expression of the mTOR and lysosomal genes was altered in expression between the HRTPT and HREC24T cell lines based on their PROM1 and CD24 expression. Using metallothionein (MT) expression as a marker demonstrated that both cell lines produced condition media that could alter the expression of the MT genes. It was also determined that PROM1 and CD24 co-expression was limited in renal cell carcinoma (RCC) cell lines.
Keywords: CD24; PROM1; RCC; cancer stem cell; conditioned medium; glucose; kidney progenitor cells.
Conflict of interest statement
The authors declare no conflict of interest.
Figures
Similar articles
-
Role of HRTPT in kidney proximal epithelial cell regeneration: Integrative differential expression and pathway analyses using microarray and scRNA-seq.J Cell Mol Med. 2021 Nov;25(22):10466-10479. doi: 10.1111/jcmm.16976. Epub 2021 Oct 9. J Cell Mol Med. 2021. PMID: 34626063 Free PMC article.
-
Proteasomes Are Critical for Maintenance of CD133+CD24+ Kidney Progenitor Cells.Int J Mol Sci. 2023 Aug 27;24(17):13303. doi: 10.3390/ijms241713303. Int J Mol Sci. 2023. PMID: 37686107 Free PMC article.
-
Characterization and determination of cadmium resistance of CD133+/CD24+ and CD133-/CD24+ cells isolated from the immortalized human proximal tubule cell line, RPTEC/TERT1.Toxicol Appl Pharmacol. 2019 Jul 15;375:5-16. doi: 10.1016/j.taap.2019.05.007. Epub 2019 May 9. Toxicol Appl Pharmacol. 2019. PMID: 31078587 Free PMC article.
-
Human renal tubular cells contain CD24/CD133 progenitor cell populations: Implications for tubular regeneration after toxicant induced damage using cadmium as a model.Toxicol Appl Pharmacol. 2017 Sep 15;331:116-129. doi: 10.1016/j.taap.2017.05.038. Epub 2017 Jun 3. Toxicol Appl Pharmacol. 2017. PMID: 28587817 Free PMC article.
-
Effect of Long-Term Cisplatin Exposure on the Proliferative Potential of Immortalized Renal Progenitor Cells.Int J Mol Sci. 2024 Nov 22;25(23):12553. doi: 10.3390/ijms252312553. Int J Mol Sci. 2024. PMID: 39684265 Free PMC article.
Cited by
-
CD133+CD24+ Renal Tubular Progenitor Cells Drive Hypoxic Injury Recovery via Hypoxia-Inducible Factor-1A and Epidermal Growth Factor Receptor Expression.Int J Mol Sci. 2025 Mar 10;26(6):2472. doi: 10.3390/ijms26062472. Int J Mol Sci. 2025. PMID: 40141116 Free PMC article.
References
-
- Angelotti M.L., Ronconi E., Ballerini L., Peired A., Mazzinghi B., Sagrinati C., Parente E., Gacci M., Carini M., Rotondi M., et al. Characterization of renal progenitors committed toward tubular lineage and their regenerative potential in renal tubular injury. Stem Cells. 2012;30:1714–1725. doi: 10.1002/stem.1130. - DOI - PubMed
-
- Lazzeri E., Crescioli C., Ronconi E., Mazzinghi B., Sagrinati C., Netti G.S., Angelotti M.L., Parente E., Ballerini L., Cosmi L., et al. Regenerative potential of embryonic renal multipotent progenitors in acute renal failure. J. Am. Soc. Nephrol. 2007;18:3128–3138. doi: 10.1681/ASN.2007020210. - DOI - PubMed
-
- Lindgren D., Boström A.K., Nilsson K., Hansson J., Sjölund J., Möller C., Jirström K., Nilsson E., Landberg G., Axelson H., et al. Isolation and characterization of progenitor-like cells from human renal proximal tubules. Am. J. Pathol. 2011;178:828–837. doi: 10.1016/j.ajpath.2010.10.026. - DOI - PMC - PubMed
Grants and funding
LinkOut - more resources
Full Text Sources
Research Materials
Miscellaneous
