

Valgus Arthritic Knee Responds Better to Conservative Treatment than the Varus Arthritic Knee
- PMID: 37109737
- PMCID: PMC10146304
- DOI: 10.3390/medicina59040779
Valgus Arthritic Knee Responds Better to Conservative Treatment than the Varus Arthritic Knee
Abstract
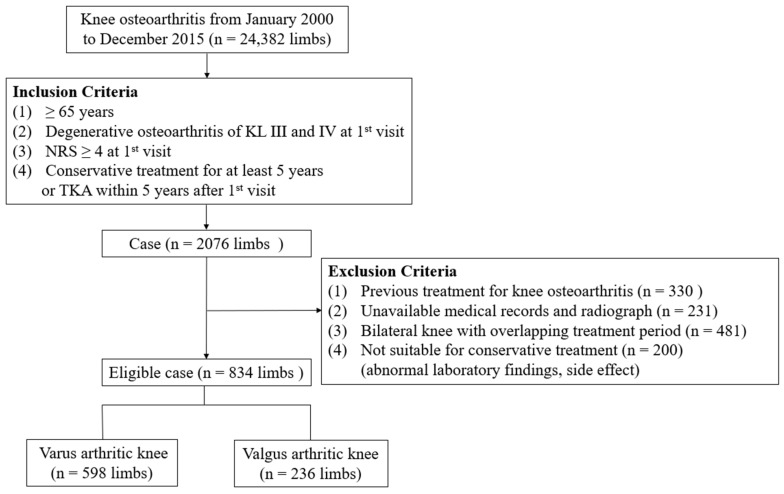
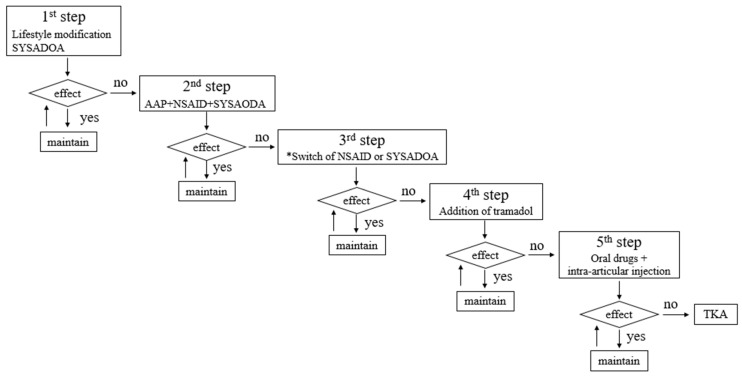
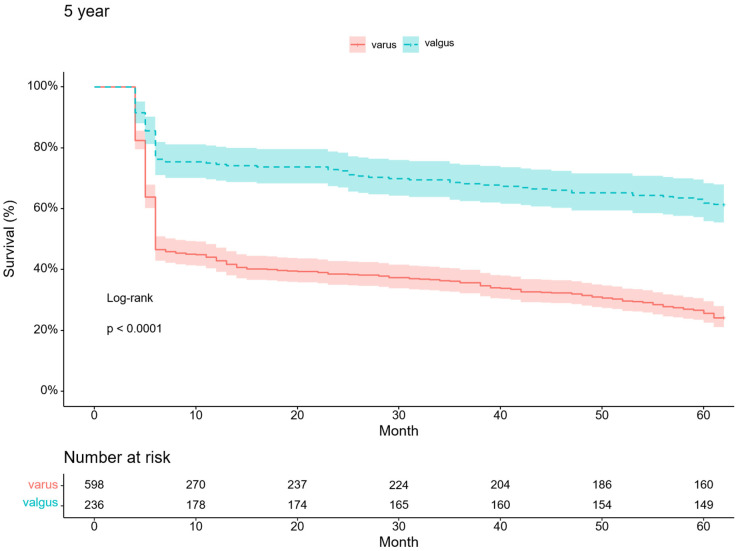
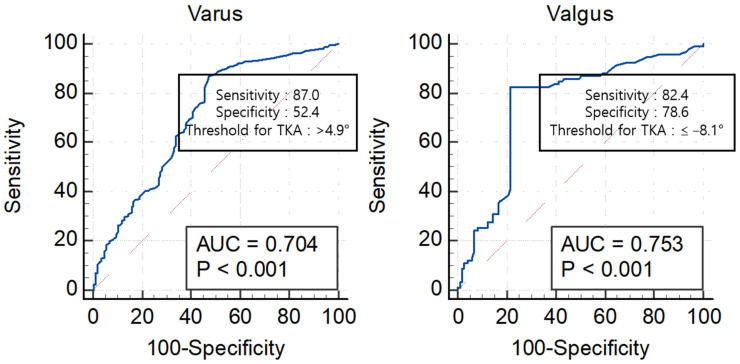
Background and Objectives: Clinically, it is beneficial to determine the knee osteoarthritis (OA) subtype that responds well to conservative treatments. Therefore, this study aimed to determine the differences between varus and valgus arthritic knees in the response to conservative treatment. We hypothesized that valgus arthritic knees would respond better to conservative treatment than varus arthritic knees. Materials and Methods: Medical records of 834 patients who received knee OA treatment were retrospectively reviewed. Patients with Kellgren-Lawrence grades III and IV were divided into two groups according to knee alignment (varus arthritic knee, hip-knee-ankle angle [HKA] > 0° or valgus arthritic knee, HKA < 0°). The Kaplan-Meier curve with total knee arthroplasty (TKA) as an endpoint was used to compare the survival probability between varus and valgus arthritic knees at one, two, three, four, and five years after the first visit. A receiver operating characteristic (ROC) curve was used to compare the HKA thresholds for TKA between varus and valgus arthritic knees. Results: Valgus arthritic knees responded better to conservative treatment than varus arthritic knees. With TKA as an endpoint, the survival probabilities for varus and valgus arthritic knees were 24.2% and 61.4%, respectively, at the 5-year follow-up (p < 0.001). The thresholds of HKA for varus and valgus arthritic knees for TKA were 4.9° and -8.1°, respectively (varus: area under the ROC curve [AUC] = 0.704, 95% confidence interval [CI] 0.666-0.741, p < 0.001, sensitivity = 0.870, specificity = 0.524; valgus: AUC = 0.753, 95% CI 0.693-0.807, p < 0.001, sensitivity = 0.753, specificity = 0.786). Conclusions: Conservative treatment is more effective for valgus than for varus arthritic knees. This should be considered when explaining the prognosis of conservative treatment for knees with varus and valgus arthritis.
Keywords: Kaplan–Meier curve; conservative treatment; hip-knee-ankle angle; osteoarthritis; receiver operating characteristic curve; total knee arthroplasty; valgus alignment; valgus arthritic knee; varus alignment; varus arthritic knee.
Conflict of interest statement
The authors declare no conflict of interest.
Figures

Similar articles
-
Bone morphotypes of the varus and valgus knee.Arch Orthop Trauma Surg. 2017 Mar;137(3):393-400. doi: 10.1007/s00402-017-2626-x. Epub 2017 Jan 21. Arch Orthop Trauma Surg. 2017. PMID: 28110363
-
Residual Mild Varus Alignment and Neutral Mechanical Alignment Have Similar Outcome after Total Knee Arthroplasty for Varus Osteoarthritis in Five-Year Follow-Up.J Knee Surg. 2020 Feb;33(2):200-205. doi: 10.1055/s-0038-1677497. Epub 2019 Jan 16. J Knee Surg. 2020. PMID: 30650442
-
Asymmetric transepicondylar axis between varus and valgus osteoarthritic knees in windswept deformity can be predicted by hip-knee-ankle angle difference.Knee Surg Sports Traumatol Arthrosc. 2022 Sep;30(9):3024-3031. doi: 10.1007/s00167-021-06661-1. Epub 2021 Jul 14. Knee Surg Sports Traumatol Arthrosc. 2022. PMID: 34258661
-
Highly variable coronal tibial and femoral alignment in osteoarthritic knees: a systematic review.Knee Surg Sports Traumatol Arthrosc. 2019 May;27(5):1368-1377. doi: 10.1007/s00167-019-05506-2. Epub 2019 Apr 15. Knee Surg Sports Traumatol Arthrosc. 2019. PMID: 30989273
-
Geographic Variation in Knee Phenotypes Based on the Coronal Plane Alignment of the Knee Classification: A Systematic Review.J Arthroplasty. 2023 Sep;38(9):1892-1899.e1. doi: 10.1016/j.arth.2023.03.047. Epub 2023 Mar 22. J Arthroplasty. 2023. PMID: 36963533
Cited by
-
Long-Term Excellent Clinical Outcomes, High Survivorship, and Low Osteoarthritis Progression in Lateral Unicompartmental Knee Arthroplasty: A 10-Year Minimum Follow-Up.J Clin Med. 2025 Apr 6;14(7):2492. doi: 10.3390/jcm14072492. J Clin Med. 2025. PMID: 40217941 Free PMC article.
-
Study on the Predictive Value of Inflammatory Factors and Biomarkers in Synovial Fluid for Disease Progression in Knee Osteoarthritis Patients.J Musculoskelet Neuronal Interact. 2025 Jun 1;25(2):186-191. doi: 10.22540/JMNI-25-186. J Musculoskelet Neuronal Interact. 2025. PMID: 40452194 Free PMC article.
References
MeSH terms
Grants and funding
LinkOut - more resources
Full Text Sources
