

Five Level Triage vs. Four Level Triage in a Quaternary Emergency Department: National Analysis on Waiting Time, Validity, and Crowding-The CREONTE (Crowding and RE-Organization National TriagE) Study Group
- PMID: 37109739
- PMCID: PMC10143416
- DOI: 10.3390/medicina59040781
Five Level Triage vs. Four Level Triage in a Quaternary Emergency Department: National Analysis on Waiting Time, Validity, and Crowding-The CREONTE (Crowding and RE-Organization National TriagE) Study Group
Abstract
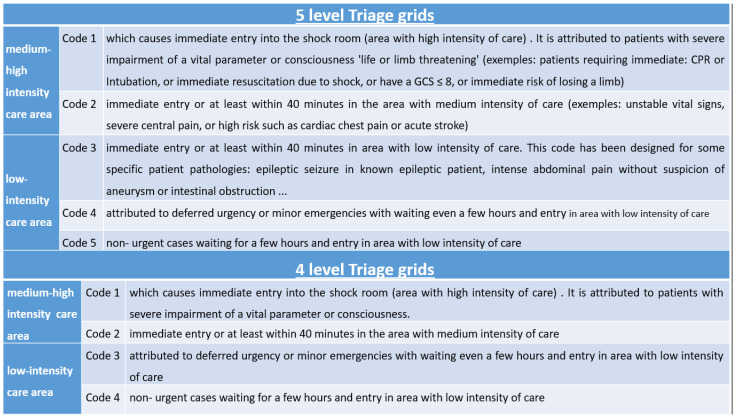
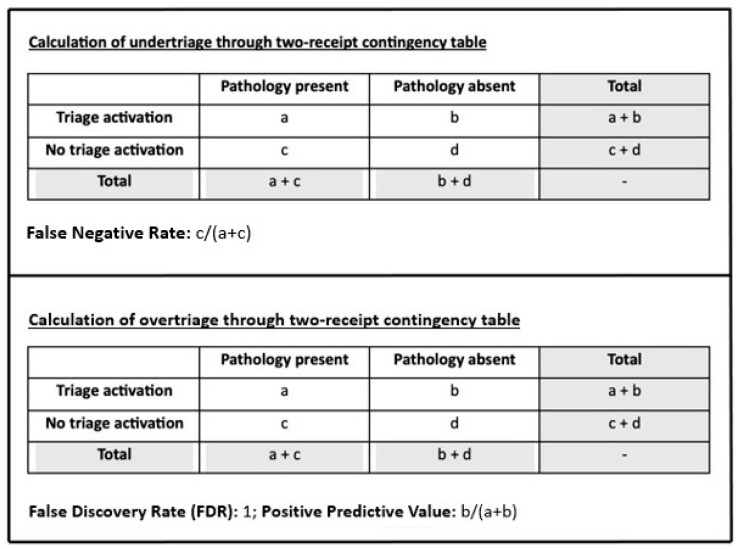
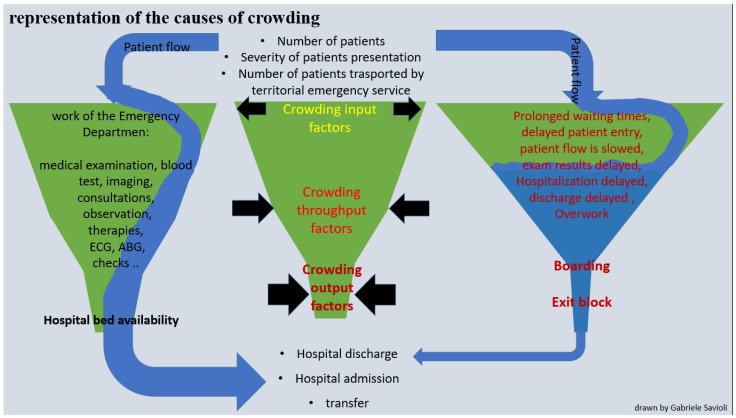
Background and Objectives: Triage systems help provide the right care at the right time for patients presenting to emergency departments (EDs). Triage systems are generally used to subdivide patients into three to five categories according to the system used, and their performance must be carefully monitored to ensure the best care for patients. Materials and Methods: We examined ED accesses in the context of 4-level (4LT) and 5-level triage systems (5LT), implemented from 1 January 2014 to 31 December 2020. This study assessed the effects of a 5LT on wait times and under-triage (UT) and over-triage (OT). We also examined how 5LT and 4LT systems reflected actual patient acuity by correlating triage codes with severity codes at discharge. Other outcomes included the impact of crowding indices and 5LT system function during the COVID-19 pandemic in the study populations. Results: We evaluated 423,257 ED presentations. Visits to the ED by more fragile and seriously ill individuals increased, with a progressive increase in crowding. The length of stay (LOS), exit block, boarding, and processing times increased, reflecting a net raise in throughput and output factors, with a consequent lengthening of wait times. The decreased UT trend was observed after implementing the 5LT system. Conversely, a slight rise in OT was reported, although this did not affect the medium-high-intensity care area. Conclusions: Introducing a 5LT improved ED performance and patient care.
Keywords: crowding; five level triage; four level triage; hospital; overcrowding; overcrowding and access block; overcrowding detection; overcrowding effect; triage (over-triage); triage (under-triage); triage system; triage validity; triage–emergency service; waiting time.
Conflict of interest statement
The authors declare no conflict of interest. The funders had no role in the design of the study, in the collection, analyses, or interpretation of data, in the writing of the manuscript, or in the decision to publish the results.
Figures

Similar articles
-
Geriatric Population Triage: The Risk of Real-Life Over- and Under-Triage in an Overcrowded ED: 4- and 5-Level Triage Systems Compared: The CREONTE (Crowding and R E Organization National TriagE) Study.J Pers Med. 2024 Feb 9;14(2):195. doi: 10.3390/jpm14020195. J Pers Med. 2024. PMID: 38392628 Free PMC article.
-
How the coronavirus disease 2019 pandemic changed the patterns of healthcare utilization by geriatric patients and the crowding: a call to action for effective solutions to the access block.Intern Emerg Med. 2022 Mar;17(2):503-514. doi: 10.1007/s11739-021-02732-w. Epub 2021 Jun 9. Intern Emerg Med. 2022. PMID: 34106397 Free PMC article.
-
The Robustness and Effectiveness of the Triage System at Times of Overcrowding and the Extra Costs due to Inappropriate Use of Emergency Departments.Appl Health Econ Health Policy. 2015 Oct;13(5):507-14. doi: 10.1007/s40258-015-0166-5. Appl Health Econ Health Policy. 2015. PMID: 25854901
-
Improving emergency department flow by introducing four interventions simultaneously. A quality improvement project.Int Emerg Nurs. 2024 Sep;76:101499. doi: 10.1016/j.ienj.2024.101499. Epub 2024 Aug 10. Int Emerg Nurs. 2024. PMID: 39128253 Review.
-
Impact of triage liaison provider on emergency department throughput: A systematic review and meta-analysis.Am J Emerg Med. 2020 Aug;38(8):1662-1670. doi: 10.1016/j.ajem.2020.04.068. Epub 2020 May 3. Am J Emerg Med. 2020. PMID: 32505473
Cited by
-
Geriatric Population Triage: The Risk of Real-Life Over- and Under-Triage in an Overcrowded ED: 4- and 5-Level Triage Systems Compared: The CREONTE (Crowding and R E Organization National TriagE) Study.J Pers Med. 2024 Feb 9;14(2):195. doi: 10.3390/jpm14020195. J Pers Med. 2024. PMID: 38392628 Free PMC article.
-
Carbon Monoxide Poisoning: From Occupational Health to Emergency Medicine.J Clin Med. 2024 Apr 23;13(9):2466. doi: 10.3390/jcm13092466. J Clin Med. 2024. PMID: 38730995 Free PMC article. Review.
-
Blood Transfusion for Major Trauma in Emergency Department.Diagnostics (Basel). 2024 Mar 27;14(7):708. doi: 10.3390/diagnostics14070708. Diagnostics (Basel). 2024. PMID: 38611621 Free PMC article. Review.
-
Current Trends for Delirium Screening within the Emergency Department.Medicina (Kaunas). 2023 Sep 8;59(9):1634. doi: 10.3390/medicina59091634. Medicina (Kaunas). 2023. PMID: 37763753 Free PMC article. Review.
-
A Lethal Combination of Delirium and Overcrowding in the Emergency Department.J Clin Med. 2023 Oct 18;12(20):6587. doi: 10.3390/jcm12206587. J Clin Med. 2023. PMID: 37892725 Free PMC article. Review.
References
-
- Influence of Task Properties and Subjectivity on Consistency of Triage: A Simulation Study-Gerdtz-2007-Journal of Advanced Nursing-Wiley Online Library. [(accessed on 25 January 2023)]. Available online: https://onlinelibrary.wiley.com/doi/abs/10.1111/j.1365-2648.2007.04192.x. - DOI - PubMed
-
- Determinates of Throughput Times in the Emergency Department-La Vonne, A. Downey, Leslie S. Zun. 2007. [(accessed on 25 January 2023)]. Available online: https://journals.sagepub.com/doi/abs/10.1177/097206340700900103. - DOI
MeSH terms
LinkOut - more resources
Full Text Sources
Medical
