

Role of Dynamic Response in Inclined Transverse Crack Inspection for 3D-Printed Polymeric Beam with Metal Stiffener
- PMID: 37109932
- PMCID: PMC10141066
- DOI: 10.3390/ma16083095
Role of Dynamic Response in Inclined Transverse Crack Inspection for 3D-Printed Polymeric Beam with Metal Stiffener
Abstract
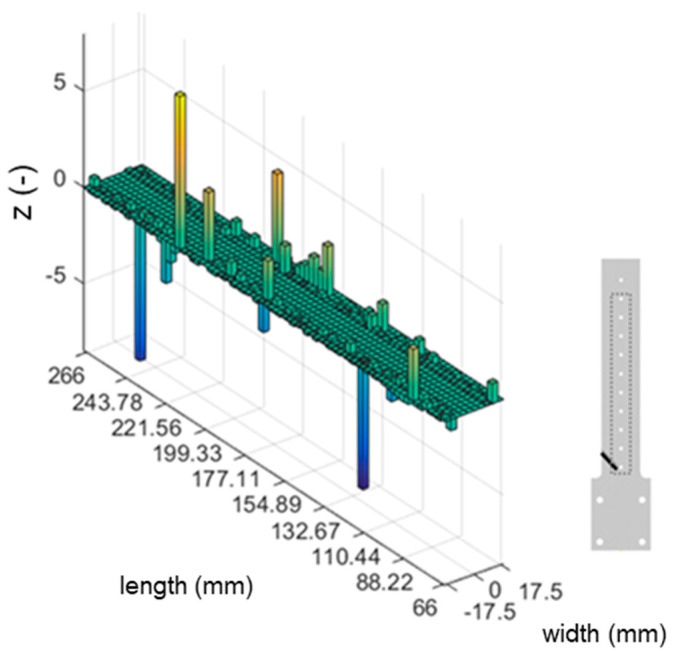
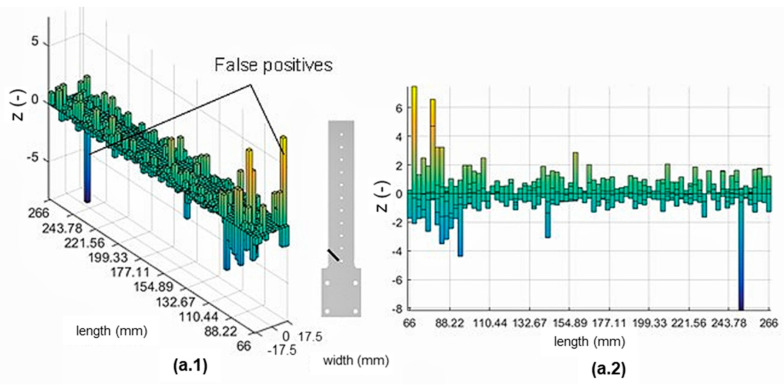
This paper aims to quantify the relationship between the dynamic response of 3D-printed polymeric beams with metal stiffeners and the severity of inclined transverse cracks under mechanical loading. Very few studies in the literature have focused on defects starting from bolt holes in light-weighted panels and considered the defect's orientation in an analysis. The research outcomes can be applied to vibration-based structure health monitoring (SHM). In this study, an acrylonitrile butadiene styrene (ABS) beam was manufactured through material extrusion and bolted to an aluminium 2014-T615 stiffener as the specimen. It simulated a typical aircraft stiffened panel geometry. The specimen had seeded and propagated inclined transverse cracks of different depths (1/1.4 mm) and orientations (0°/30°/45°). Then, their dynamic response was investigated numerically and experimentally. The fundamental frequencies were measured with an experimental modal analysis. The numerical simulation provided the modal strain energy damage index (MSE-DI) to quantify and localise the defects. Experimental results showed that the 45° cracked specimen presented the lowest fundamental frequency with a decreased magnitude drop rate during crack propagation. However, the 0° cracked specimen generated a more significant frequency drop rate with an increased crack depth ratio. On the other hand, several peaks were presented at various locations where no defect was present in the MSE-DI plots. This suggests that the MSE-DI approach for assessing damage is unsuitable for detecting cracks beneath stiffening elements due to the restriction of the unique mode shape at the crack's location.
Keywords: damage identification; dynamic response; material extrusion; modal strain energy damage index; stiffened cantilever beam.
Conflict of interest statement
The authors declare no conflict of interest.
Figures


References
-
- Kianian B. Wohlers Report 2017: 3D Printing and Additive Manufacturing State of the Industry, Annual Worldwide Progress Report: Chapters Titles: The Middle East, and Other Countries. Wohlers Associates; Fort Collins, CO, USA: 2017.
-
- Forcellese A., Marconi M., Simoncini M., Vita A. Environmental and buckling performance analysis of 3D printed composite isogrid structures. Procedia CIRP. 2021;98:458–463. doi: 10.1016/j.procir.2021.01.134. - DOI
-
- Turner A.J., Al Rifaie M., Mian A., Srinivasan R. Low-Velocity Impact Behavior of Sandwich Structures with Additively Manufactured Polymer Lattice Cores. J. Mater. Eng. Perform. 2018;27:2505–2512. doi: 10.1007/s11665-018-3322-x. - DOI
LinkOut - more resources
Full Text Sources
