. 2023 Apr 17;16(8):3158.
doi: 10.3390/ma16083158.

The Optimization of Radiation Synthesis Modes for YAG:Ce Ceramics

Affiliations

The Optimization of Radiation Synthesis Modes for YAG:Ce Ceramics

Victor Lisitsyn et al. Materials (Basel). .

Abstract

Synthesis in the radiation field is a promising direction for the development of materials transformation processes, especially those differing in melting temperature. It has been established that the synthesis of yttrium-aluminum ceramics from yttrium oxides and aluminum metals in the region of a powerful high-energy electron flux is realized in 1 s, without any manifestations that facilitate synthesis, with high productivity. It is assumed that the high rate and efficiency of synthesis are due to processes that are realized with the formation of radicals, short-lived defects formed during the decay of electronic excitations. This article presents descriptions of the energy-transferring processes of an electron stream with energies of 1.4, 2.0, and 2.5 MeV to the initial radiation (mixture) for the production of YAG:Ce ceramics. YAG:Ce (Y3Al5O12:Ce) ceramics samples in the field of electron flux of different energies and power densities were synthesized. The results of a study of the dependence of the morphology, crystal structure, and luminescence properties of the resulting ceramics on the synthesis modes, electron energy, and electron flux power are presented.

Keywords: YAG:Ce ceramics; energy loss; high-power electron flux; luminescence; structure; synthesis.


Conflict of interest statement

The authors declare no conflict of interest.

Figures

Figure 1
Figure 1
Energy loss distribution of electrons with E = 1.4 (a), 2.0 (b), 2.5 (c) MeV in a mixture with a bulk density of 1.2 g/cm3 for the synthesis of Y3Al5O12 ceramics. Colored lines of equal loss are given in units relative to the loss in the center.
Figure 2
Figure 2
Energy loss distribution profiles dE/dx (a) and dE/dy (b) of electrons with energies of 1.4, 2.0, and 2.5 MeV in the mixture and absorbed energy density W (c).
Figure 3
Figure 3
Photographs of ceramic samples synthesized under the exposure to electron fluxes with E = 1.4 MeV (P = 4 and 2.5 kW/cm2), E = 2.0 MeV (P = 6 and 4 kW/cm2), and E = 2.5 MeV (P = 10 and 8 kW/cm2), and traces of the impact of electron flows with E = 1.4 MeV (P = 8, 10, 14 kW/cm2) on the copper plate.
Figure 4
Figure 4
Photographs of YAG:Ce ceramic samples synthesized under the influence of electron fluxes of different E and P: 1—E = 1.4 MeV, P = 2.5 kW/cm2; 2—E = 2.0 MeV, P = 4 kW/cm2; 3—E = 2.5 MeV, P = 8 kW/cm2; 4—E = 2.0 MeV, P = 6 kW/cm2; 5—E = 2.5 MeV, P = 10 kW/cm2.
Figure 5
Figure 5
Photographs of YAG:Ce ceramic sample synthesized at E = 2.5 MeV, P = 37 kW/cm2. On the right is a photograph of the outer surface of the ceramic sample taken by optical microscope.
Figure 6
Figure 6
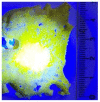
Photo of YAG:Ce ceramic sample synthesized at E = 1.4 MeV, P = 25 kW/cm2, illuminated by chip radiation λ = 450 nm.
Figure 7
Figure 7
X-ray diffraction patterns of Y3Al5O12 ceramic samples. Designations: black rhombus—Y3Al5O12 reflections, blue triangle—YAlO3, red circle—Y2O3, green square—Al2O3, black star—Y4Al2O9. The serial number in the figures is the sample number in the accounting system used by the authors.
Figure 7
Figure 7
X-ray diffraction patterns of Y3Al5O12 ceramic samples. Designations: black rhombus—Y3Al5O12 reflections, blue triangle—YAlO3, red circle—Y2O3, green square—Al2O3, black star—Y4Al2O9. The serial number in the figures is the sample number in the accounting system used by the authors.
Figure 8
Figure 8
Excitation (a) and luminescence spectra (b,c) of ceramic samples synthesized under the exposure to an electron beam with E = 2.5 MeV and P = 8 and 10 kW/cm2 in the “without scanning” mode.
Figure 9
Figure 9
Excitation (a) and luminescence (b,c) spectra of ceramic samples synthesized when exposed to an electron beam with E = 1.4, 2.0, 2.5 MeV and P = 25, 33, 37 kW/cm2 in “with scanning” mode.

References

    1. Xiao Z., Yu S., Li Y., Ruan S., Kong L.B., Huang Q., Huang Z., Zhou K., Su H., Yao Z., et al. Materials Development and Potential Applications of Transparent Ceramics: A Review. Mater. Sci. Eng. R Rep. 2020;139:100518. doi: 10.1016/j.mser.2019.100518. - DOI
    1. Xia Z., Meijerink A. Ce3+-Doped Garnet Phosphors: Composition Modification, Luminescence Properties and Applications. Chem. Soc. Rev. 2017;46:275–299. doi: 10.1039/C6CS00551A. - DOI - PubMed
    1. Smet P., Parmentier A., Poelman D. Selecting Conversion Phosphors for White Light-Emtting Diodes. J. Electrochem. Soc. 2011;158:R37–R54. doi: 10.1149/1.3568524. - DOI
    1. Ye S., Xiao F., Pan Y.X., Ma Y.Y., Zhang Q.Y. Phosphors in Phosphor-Converted White Light-Emitting Diodes: Recent Advances in Materials, Techniques and Properties. Mater. Sci. Eng. R Rep. 2010;71:1–34. doi: 10.1016/j.mser.2010.07.001. - DOI
    1. Pan Y., Wu M., Su Q. Comparative Investigation on Synthesis and Photoluminescence of YAG:Ce Phosphor. Mater. Sci. Eng. B. 2004;106:251. doi: 10.1016/j.mseb.2003.09.031. - DOI

LinkOut - more resources