

Regulation of Staphylococcal Enterotoxin-Induced Inflammation in Spleen Cells from Diabetic Mice by Polyphenols
- PMID: 37110462
- PMCID: PMC10143252
- DOI: 10.3390/microorganisms11041039
Regulation of Staphylococcal Enterotoxin-Induced Inflammation in Spleen Cells from Diabetic Mice by Polyphenols
Abstract
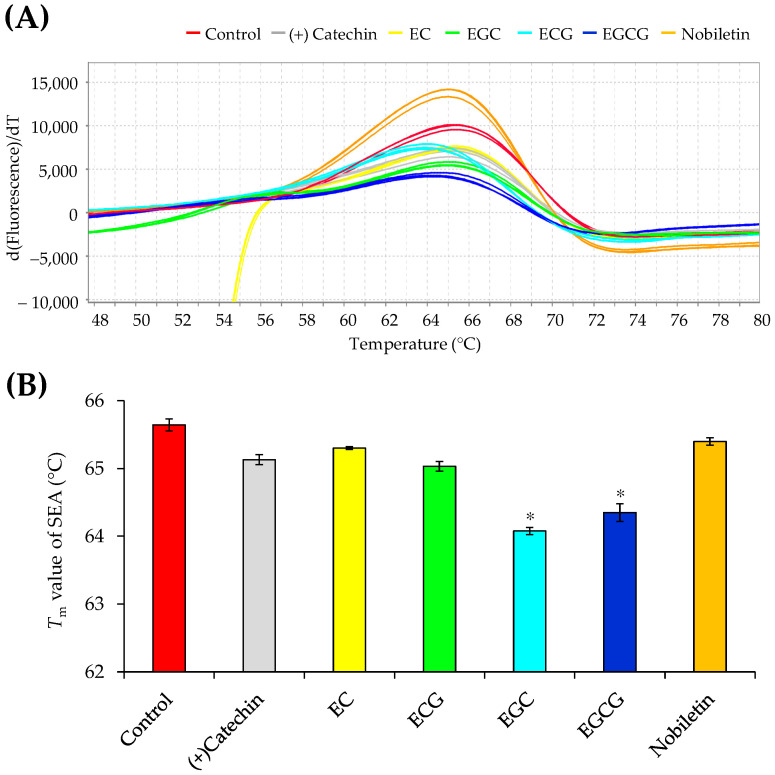
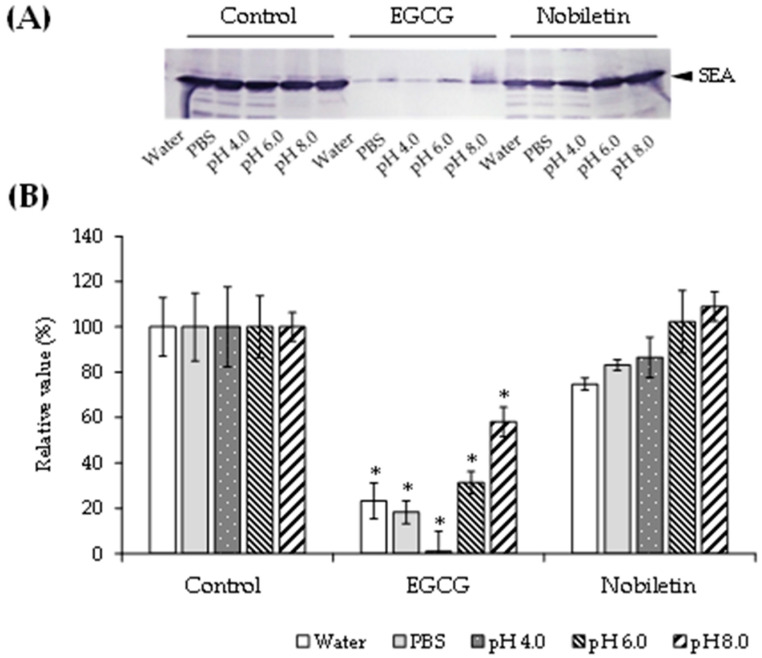
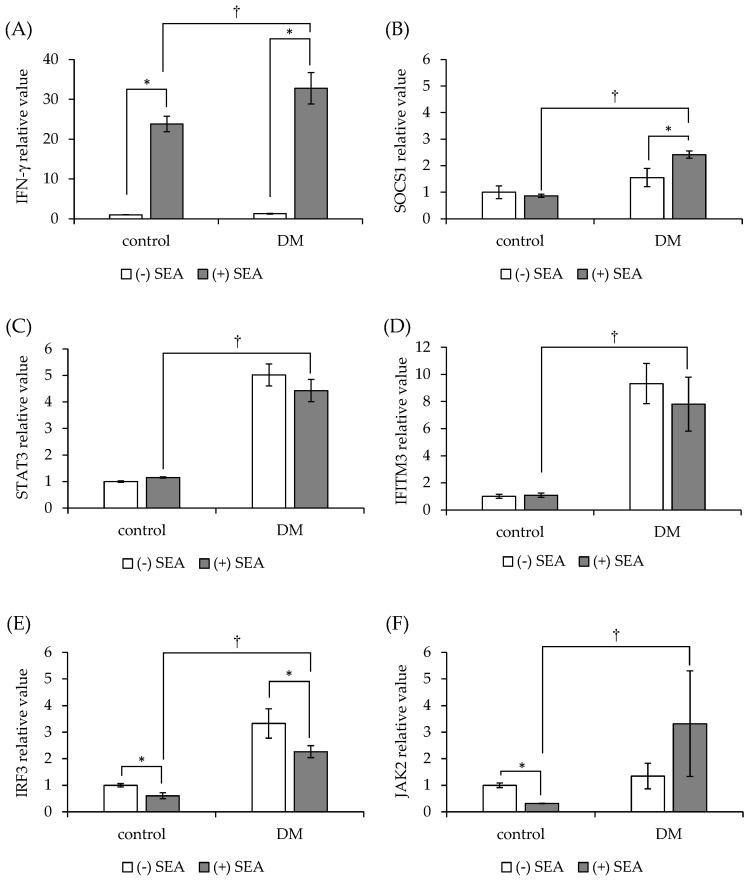
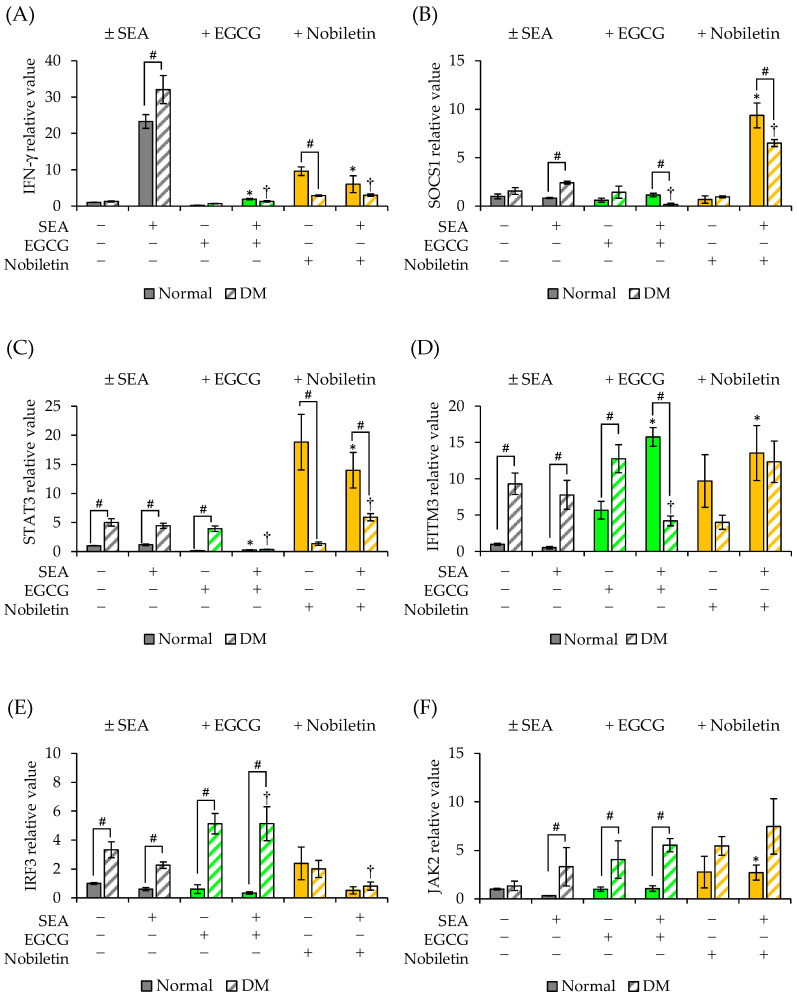
Patients with diabetes are known to be more susceptible to infections following the establishment of Staphylococcus aureus in their nasal passages and on their skin. The present study evaluated the effects of staphylococcal enterotoxin A (SEA) on the immune responses of spleen cells derived from diabetic mice, and examined the effects of polyphenols, catechins, and nobiletin on inflammation-related gene expression associated with the immune response. (-)-Epigallocatechin gallate (EGCG), possessing hydroxyl groups, interacted with SEA, whereas nobiletin, possessing methyl groups, did not interact with SEA. The exposure of spleen cells derived from diabetic mice to SEA enhanced the expression of interferon gamma, suppressor of cytokine signaling 1, signal transducer and activator of transcription 3, interferon-induced transmembrane protein 3, Janus kinase 2, and interferon regulatory factor 3, suggesting that SEA sensitivity is variable in the development of diabetes. Both EGCG and nobiletin changed the expression of genes related to SEA-induced inflammation in spleen cells, suggesting that they inhibit inflammation through different mechanisms. These results may lead to a better understanding of the SEA-induced inflammatory response during diabetogenesis, and the establishment of methods to control these effects with polyphenols.
Keywords: Staphylococcus aureus; diabetes; inflammation; polyphenols; staphylococcal enterotoxin A.
Conflict of interest statement
The authors declare no conflict of interest.
Figures
Similar articles
-
Effect of Polyphenols on Inflammation Induced by Membrane Vesicles from Staphylococcus aureus.Cells. 2024 Feb 23;13(5):387. doi: 10.3390/cells13050387. Cells. 2024. PMID: 38474351 Free PMC article.
-
Effect of (-)-Epigallocatechin Gallate on Activation of JAK/STAT Signaling Pathway by Staphylococcal Enterotoxin A.Toxins (Basel). 2021 Aug 29;13(9):609. doi: 10.3390/toxins13090609. Toxins (Basel). 2021. PMID: 34564613 Free PMC article.
-
Effect of (-)-Epigallocatechin Gallate to Staphylococcal Enterotoxin A on Toxin Activity.Molecules. 2020 Apr 17;25(8):1867. doi: 10.3390/molecules25081867. Molecules. 2020. PMID: 32316678 Free PMC article.
-
Novel insights of dietary polyphenols and obesity.J Nutr Biochem. 2014 Jan;25(1):1-18. doi: 10.1016/j.jnutbio.2013.09.001. J Nutr Biochem. 2014. PMID: 24314860 Free PMC article. Review.
-
New insights into the mechanisms of polyphenols beyond antioxidant properties; lessons from the green tea polyphenol, epigallocatechin 3-gallate.Redox Biol. 2014 Jan 10;2:187-95. doi: 10.1016/j.redox.2013.12.022. eCollection 2014. Redox Biol. 2014. PMID: 24494192 Free PMC article. Review.
Cited by
-
Effect of Polyphenols on Inflammation Induced by Membrane Vesicles from Staphylococcus aureus.Cells. 2024 Feb 23;13(5):387. doi: 10.3390/cells13050387. Cells. 2024. PMID: 38474351 Free PMC article.
References
-
- Liu X., Wen Y., Zhao Z., Jeffry J., Zeng L., Zou Z., Chen H., Tao A. Synergistic activation of Src, ERK and STAT pathways in PBMCs for Staphylococcal enterotoxin A induced production of cytokines and chemokines. Asian Pacific J. Allergy Immunol. 2020;38:52–63. doi: 10.12932/AP-220818-0396. - DOI - PubMed
-
- Lagathu C., Bastard J.P., Auclair M., Maachi M., Capeau J., Caron M. Chronic interleukin-6 (IL-6) treatment increased IL-6 secretion and induced insulin resistance in adipocyte: Prevention by rosiglitazone. Biochem. Biophys. Res. Commun. 2003;311:372–379. doi: 10.1016/j.bbrc.2003.10.013. - DOI - PubMed
LinkOut - more resources
Full Text Sources
