. 2023 Apr 18;15(4):1274.
doi: 10.3390/pharmaceutics15041274.

High-Throughput/High Content Imaging Screen Identifies Novel Small Molecule Inhibitors and Immunoproteasomes as Therapeutic Targets for Chordoma

Affiliations

High-Throughput/High Content Imaging Screen Identifies Novel Small Molecule Inhibitors and Immunoproteasomes as Therapeutic Targets for Chordoma

Amrendra K Ajay et al. Pharmaceutics. .

Abstract

Chordomas account for approximately 1-4% of all malignant bone tumors and 20% of primary tumors of the spinal column. It is a rare disease, with an incidence estimated to be approximately 1 per 1,000,000 people. The underlying causative mechanism of chordoma is unknown, which makes it challenging to treat. Chordomas have been linked to the T-box transcription factor T (TBXT) gene located on chromosome 6. The TBXT gene encodes a protein transcription factor TBXT, or brachyury homolog. Currently, there is no approved targeted therapy for chordoma. Here, we performed a small molecule screening to identify small chemical molecules and therapeutic targets for treating chordoma. We screened 3730 unique compounds and selected 50 potential hits. The top three hits were Ribociclib, Ingenol-3-angelate, and Duvelisib. Among the top 10 hits, we found a novel class of small molecules, including proteasomal inhibitors, as promising molecules that reduce the proliferation of human chordoma cells. Furthermore, we discovered that proteasomal subunits PSMB5 and PSMB8 are increased in human chordoma cell lines U-CH1 and U-CH2, confirming that the proteasome may serve as a molecular target whose specific inhibition may lead to better therapeutic strategies for chordoma.

Keywords: cell proliferation; chordoma; high-throughput screening; proteasome; rare disease.


Conflict of interest statement

The authors declare no conflict of interest.

Figures

Figure 1
Figure 1
Development of a primary assay for screening the compound. (A) Representative images of cells following doxorubicin treatment. Quantitation of cell number shows a significant decrease in proliferation with doxorubicin. *** and **** represent p < 0.001 and 0.0001, respectively. (B) A representative plate showing cell numbers as counted by Hoechst staining for Z-prime calculation. Medium and 0.1% DMSO as negative control, and different concentrations of doxorubicin and 20% DMSO as positive controls. (C) Mean average cell numbers plotted in a plate format. Plate showing positive controls (5 μM doxorubicin, 1st, and 2nd columns, 20% DMSO, 23rd column), negative controls (0.1% DMSO) 24th column, and experimental compounds 3–22 columns. Color range Red 780 and green 320. (D) Mean of average cell counts was plotted to identify edge effects.
Figure 2
Figure 2
Small molecule screening identifies potential hits. (A) Average cell number was plotted for all the plates screened. Red represents positive controls, dark blue represents negative control, light blue represents non-hit compounds, and green represents potential hits. (B) Representative plot for the correlation of replicate plates shows a high correlation between replicates. Red represents positive controls, dark blue represents negative control, light blue represents non-hit compounds, and gray represents potential hits. (C) Average Z-scores for each compound were calculated and plotted. Light blue represents non-hit compounds, and green represents potential hits. (D) Z-scores for various concentrations of selected potential hits were calculated. (E) Summary of primary screening showing a number of compounds for cherry-picking and confirmation of potential hits.
Figure 3
Figure 3
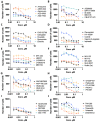
Reconfirmation of potential hits from primary assays and dose dependency studies identifies proteasomal inhibitors. (AJ) Dose-response curves for cherry-picked compounds from primary screening done in duplicate. (F) Dose dependency curves for three proteasomal inhibitors showing reconfirmation of these three inhibitors. (G,H) Dose dependency curves for BNC105 and bortezomib or Palbociclib alone or in combination showing low-dose synergistic cell-killing activity of chordoma cells.
Figure 4
Figure 4
Primary assays identify proteasomal inhibitors as a specific therapeutic agent, alone or in combination with other anti-cancer drugs. (AC) Nuclear count. (A) Dose dependency curves for three proteasomal inhibitors showing reconfirmation of these three inhibitors. (B) High-dose and (C) Low-dose dependency curves for Bortezomib and BNC105 or Palbociclib alone or in combination, showing low-dose synergistic cell-killing activity of chordoma cells. Dose dependency study using proliferation assays (D) HEK-293 cells, (E) U-CH1 and (F) U-CH2 cells alone or (G) in combination. (H) Percentage cell survival evaluated for BTZ, CFZ, and PKS21265 and the IC50 values for β5i- and β5c-selective and co-inhibition in U-CH1 cells.
Figure 5
Figure 5
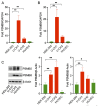
Proteasomal subunits PSMB5 and PSMB8 are increased in chordoma cells U-CH1 and U-CH2. Gene expression analysis by RT PCR represented as a fold change of (A) PSMB5 and (B) PSMB8, showing increased expression of PSMB5 and PSMB8 genes in U-CH1 and UCH1 cells as compared to HEK-293 and HUVEC cells. ** represents p < 0.01. (C) Western blotting for PSMB5 and PSMB8 in HEK-293, U-CH1, U-CH2, and HUVEC cells showed increased protein expression of these two proteins in chordoma cells. β-Actin served as a loading control. Quantitation of PSMB5 and PSMB8 protein expression normalized to β-Actin. * and ** represents p ≤ 0.05 and p ≤ 0.01 respectively.
Figure 6
Figure 6
Schematic diagram showing small molecule inhibitor/proteasomal inhibitors for reducing chordoma cell proliferation.

References

    1. Yu E., Koffer P.P., DiPetrillo T.A., Kinsella T.J. Incidence, treatment, and survival patterns for sacral chordoma in the United States, 1974–2011. Front. Oncol. 2016;6:203. doi: 10.3389/fonc.2016.00203. - DOI - PMC - PubMed
    1. Chambers K.J., Lin D.T., Meier J., Remenschneider A., Herr M., Gray S.T. Incidence and survival patterns of cranial chordoma in the United States. Laryngoscope. 2014;124:1097–1102. doi: 10.1002/lary.24420. - DOI - PubMed
    1. McMaster M.L., Goldstein A.M., Bromley C.M., Ishibe N., Parry D.M. Chordoma: Incidence and survival patterns in the United States, 1973–1995. Cancer Causes Control. 2001;12:1–11. doi: 10.1023/A:1008947301735. - DOI - PubMed
    1. Yang X.R., Ng D., Alcorta D.A., Liebsch N.J., Sheridan E., Li S., Goldstein A.M., Parry D.M., Kelley M.J. T (brachyury) gene duplication confers major susceptibility to familial chordoma. Nat. Genet. 2009;41:1176–1178. doi: 10.1038/ng.454. - DOI - PMC - PubMed
    1. Nishino A., Satou Y., Morisawa M., Satoh N. Brachyury (T) gene expression and notochord development in Oikopleura longicauda (Appendicularia, Urochordata) Dev. Genes Evol. 2001;211:219–231. doi: 10.1007/s004270100141. - DOI - PubMed

LinkOut - more resources