. 2023 Apr 9;15(8):1831.
doi: 10.3390/polym15081831.

Atomistic Simulation of Flow-Induced Microphase Separation and Crystallization of an Entangled Polyethylene Melt Undergoing Uniaxial Elongational Flow and the Role of Kuhn Segment Extension

Affiliations

Atomistic Simulation of Flow-Induced Microphase Separation and Crystallization of an Entangled Polyethylene Melt Undergoing Uniaxial Elongational Flow and the Role of Kuhn Segment Extension

Mohammad Hadi Nafar Sefiddashti et al. Polymers (Basel). .

Abstract

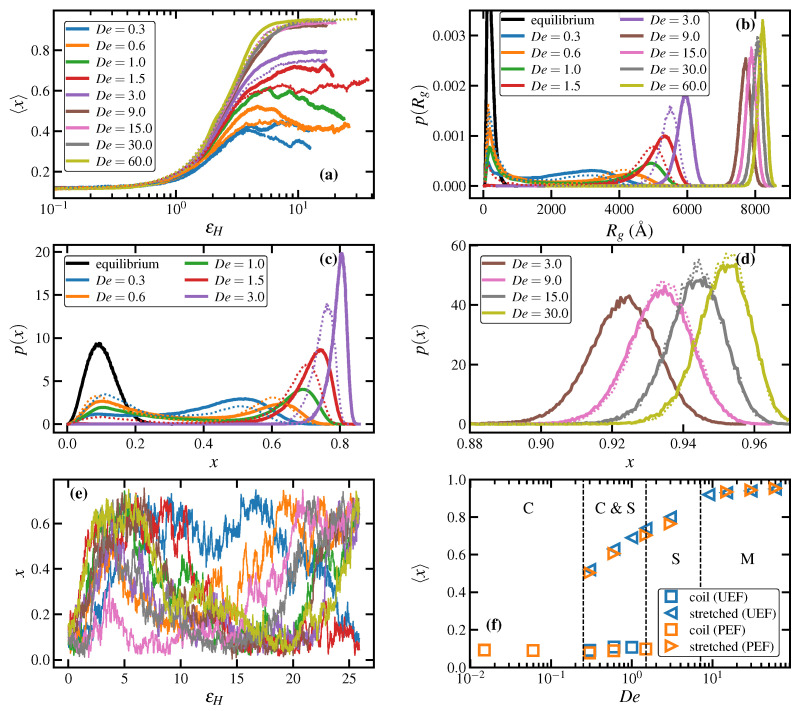
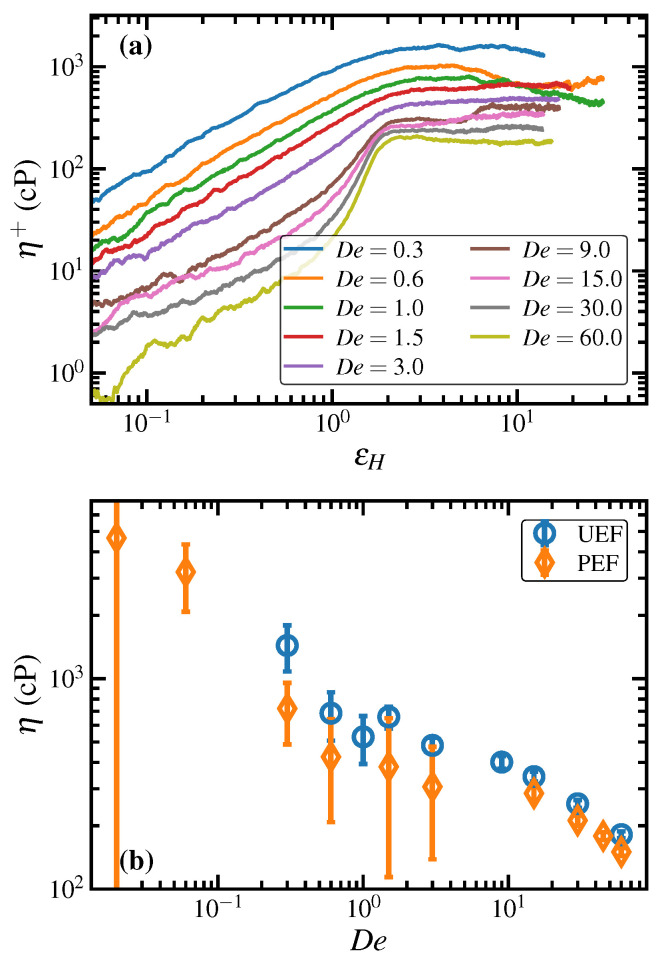
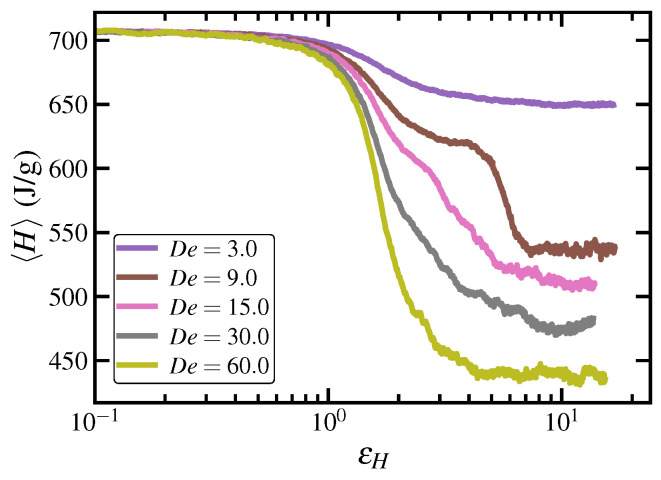
Atomistic simulations of the linear, entangled polyethylene C1000H2002 melt undergoing steady-state and startup conditions of uniaxial elongational flow (UEF) over a wide range of flow strength were performed using a united-atom model for the atomic interactions between the methylene groups constituting the polymer macromolecules. Rheological, topological, and microstructural properties of these nonequilibrium viscoelastic materials were computed as functions of strain rate, focusing on regions of flow strength where flow-induced phase separation and flow-induced crystallization were evident. Results of the UEF simulations were compared with those of prior simulations of planar elongational flow, which revealed that uniaxial and planar flows exhibited essentially a universal behavior, although over strain rate ranges that were not completely equivalent. At intermediate flow strength, a purely configurational microphase separation was evident that manifested as a bicontinuous phase composed of regions of highly stretched molecules that enmeshed spheroidal domains of relatively coiled chains. At high flow strength, a flow-induced crystallization (FIC) occurred, producing a semicrystalline material possessing a high degree of crystallinity and primarily a monoclinic lattice structure. This FIC phase formed at a temperature (450 K) high above the quiescent melting point (≈400 K) and remained stable after cessation of flow for temperature at or below 435 K. Careful examination of the Kuhn segments constituting the polymer chains revealed that the FIC phase only formed once the Kuhn segments had become essentially fully extended under the UEF flow field. Thermodynamic properties such as the heat of fusion and heat capacity were estimated from the simulations and found to compare favorably with experimental values.

Keywords: Kuhn segment extension; flow-enhanced nucleation; flow-induced crystallization; microphase separation; molecular simulation; polyethylene; uniaxial elongational flow.


Conflict of interest statement

The authors declare no conflict of interest.

Figures

Figure 1
Figure 1
(a) Mean fractional extension, x, as a function of Hencky strain, εH, for startup of elongational flow at various values of De: solid lines correspond to UEF and dotted lines to PEF. (b) Steady-state probability distribution functions, p(Rg), of the molecular radius of gyration, Rg, at various values of De in both UEF and PEF. Panels (c,d) display steady-state probability distribution functions, p(x), of the fractional extension at various values of De; (c) displays p(x) at lower De whereas (d) presents p(x) at high De where FIC was observed. (e) Fractional extension vs. εH for several selected individual chains undergoing startup of UEF at De=0.6 depicting the gradual transitioning of molecules between coiled and stretched configurations. (f) Steady-state mean fractional extension versus De for UEF and PEF; blue symbols denote UEF data and orange symbols denote data taken from PEF simulations. Vertical dashed lines delineate approximate boundaries of various configurational states or phases: C, S, and M denote coiled liquid, stretched liquid, and predominantly monoclinic semicrystalline states, respectively.
Figure 2
Figure 2
Time evolution of fractional extension of all molecules after startup of UEF at various De plotted in terms of Hencky strain, εH. Each individual molecular trajectory is plotted using a line of randomly chosen color.
Figure 3
Figure 3
Transient snapshots at various values of Hencky strain of the PE melt undergoing startup of UEF at De = 0.6. Individual macromolecules are assigned a color based on their fractional extension: cooler colors denote relatively coiled chains whereas warmer colors imply stretched chains. The bottom right snapshot is the same as the upper left snapshot corresponding to εH=0, except that the colors of the individual molecules are assigned according to the final steady-state extension, not that which they possessed at t=0. Note that the boxes are displayed at random angles (and sizes) relative to the flow direction because the simulation cell rotates (and elongates/compresses) with time under UEF due to the imposed boundary conditions.
Figure 4
Figure 4
Snapshots of steady-state UEF of the PE melt at various values of De. Cooler colors denote relatively coiled molecules whereas warmer colors signify more highly stretched molecules. The black arrow denotes the direction of flow for all snapshots.
Figure 5
Figure 5
Steady-state topological characteristics of the C1000H2002 melt undergoing UEF and PEF: (a) average number of chain kinks per molecule vs. De; (b) probability distributions of Zk at various De (UEF only); (c) peak positions of the PDFs of panel (b) plotted vs. De, including those of the same melt undergoing PEF (which are not shown in panel (b); and (d) tube stretch vs. De under UEF only. Note that the PDFs of De9.0 in panel (b) all overlap each other.
Figure 6
Figure 6
Startup ((a); UEF only) and steady-state ((b); both UEF and PEF) viscosity for the PE melt undergoing elongational flow at various De. Statistical error bars are indicated for the steady-state data displayed in panel (b).
Figure 7
Figure 7
Nonequilibrium phase diagram of the C1000H2002 melt under both steady-state UEF and PEF based on the extensional stress, σ, plotted vs. De. Upper-case Roman letters within the figure are described in the caption to Figure 1.
Figure 8
Figure 8
(a) Transient order parameter, q, as a function of Hencky strain, εH, at various values of De for startup of UEF and PEF of the PE melt at 450 K. (b) Steady-state probability distribution functions, p(q), of the order parameter at various values of De under UEF and PEF. (c) Steady-state order parameter vs. De for both UEF and PEF simulations. Vertical dashed lines define approximate boundaries of the various states or phases. Symbols C, S, and M denote coiled liquid, stretched liquid, and monoclinic semicrystalline states, respectively. The solid curves in panels (a,b) depict UEF data, whereas the dashed lines represent PEF data. Note that De=1.0 and 9.0 were not simulated under PEF, and De=0.015, 0.06, and 45.0 were not simulated under UEF.
Figure 9
Figure 9
Transient order parameter q vs. time, t, after cessation of steady-state UEF at De=30.0 of the PE melt at 450 K with and without simultaneous quenching to a lower temperature, as labelled in the legend.
Figure 10
Figure 10
Transient ensemble-averaged enthalpy vs. Hencky strain upon startup of UEF of the PE melt at selected values of De. The precipitous drop of enthalpy at εH4 at De=9.0 corresponds to the steep increase of q, as depicted in Figure 8a, which underscores the onset of FIC at this value of Hencky strain.
Figure 11
Figure 11
Specific heat capacity vs. Hencky strain of the PE melt under startup of UEF (a) and PEF (b) at various De. Note that data at De=0.6 in panel (a) were taken under steady-state conditions.
Figure 12
Figure 12
The ensemble-average local atomic entropy, enthalpy (panel (a)), and Gibbs free energy (panel (b)) as functions of De for the UEF and PEF simulations of the C1000H2002 melt in (dimensionless) reduced LJ units. Note the high degree of agreement between UEF and PEF data, in spite of the large error bars on some of the data.
Figure 13
Figure 13
Snapshots of the simulation cell at various Hencky strains after startup of UEF at 450 K of the PE melt at De=9.0. Individual atoms are colored based on their instantaneous values of G¯i, according to the legend color bar. Note that the boxes are displayed at random angles (and sizes) relative to the flow direction because the simulation cell rotates (and elongates/compresses) with time under UEF due to the imposed boundary conditions.
Figure 14
Figure 14
Fraction of liquid-like particles, N˜l, as a function of Hencky strain within the PE material for startup of UEF at various De.
Figure 15
Figure 15
Steady-state radial distribution function, g(r), of the C1000H2002 melt at three values of De=0.0,3.0,15.0 under both UEF (solid lines) and PEF (dotted lines). Note that UEF and PEF data virtually overlap at all De; therefore, the PEF data curves are not labelled in the legend. The inset displays the intermolecular contribution to the overall RDFs displayed in the main graph.
Figure 16
Figure 16
Panel (a): A snapshot of a random slab of thickness 11.8 Å and oriented perpendicular to the direction of flow of the semicrystalline PE taken under steady-state UEF at De=60.0. Individual molecules are assigned random colors, and each atom contained within the slab of a particular molecule is assigned the same color. Most molecules are aligned parallel to the flow direction and hence appear as large dots in the plane of the slab. Panel (b): A graph of g(r) for a random slab of thickness 3 Å oriented perpendicular to the flow direction, similar (but thinner than) the slab of Panel (a). The monoclinic lattice parameters are labelled in the plot.
Figure 17
Figure 17
Steady-state structure factor, S(k), vs. wavenumber, k, of the C1000H2002 melt at De=0 and De=60 as calculated from the UEF simulations. In addition, there are the structure factors for an n-eicosane liquid (labelled as ‘equilibrium XRD’ in the legend) and solid crystal as obtained from X-ray diffraction experiments.
Figure 18
Figure 18
Probability distributions of the magnitude of Kuhn segments, |RK|, comprising the PE melt under steady-state UEF (panel (a)) and PEF (panel (b)) at various De.
Figure 19
Figure 19
Mean value of the Kuhn segment magnitude, |RK|, and average number of chain kinks, Zk, vs. Hencky strain for startup of UEF at De=9.0.

Similar articles

Cited by

References

    1. Laun H., Schuch H. Transient elongational viscosities and drawability of polymer melts. J. Rheol. 1989;33:119–175. doi: 10.1122/1.550058. - DOI
    1. Nielsen J.K., Rasmussen H.K., Hassager O., McKinley G.H. Elongational viscosity of monodisperse and bidisperse polystyrene melts. J. Rheol. 2006;50:453–476. doi: 10.1122/1.2206711. - DOI
    1. Huang Q., Mednova O., Rasmussen H.K., Alvarez N.J., Skov A.L., Almdal K., Hassager O. Concentrated polymer solutions are different from melts: Role of entanglement molecular weight. Macromolecules. 2013;46:5026–5035. doi: 10.1021/ma4008434. - DOI
    1. Wingstrand S.L., Alvarez N.J., Huang Q., Hassager O. Linear and nonlinear universality in the rheology of polymer melts and solutions. Phys. Rev. Lett. 2015;115:078302. doi: 10.1103/PhysRevLett.115.078302. - DOI - PubMed
    1. Costanzo S., Huang Q., Ianniruberto G., Marrucci G., Hassager O., Vlassopoulos D. Shear and extensional rheology of polystyrene melts and solutions with the same number of entanglements. Macromolecules. 2016;49:3925–3935. doi: 10.1021/acs.macromol.6b00409. - DOI

LinkOut - more resources