

A Machine Learning Pipeline for Gait Analysis in a Semi Free-Living Environment
- PMID: 37112339
- PMCID: PMC10145775
- DOI: 10.3390/s23084000
A Machine Learning Pipeline for Gait Analysis in a Semi Free-Living Environment
Abstract
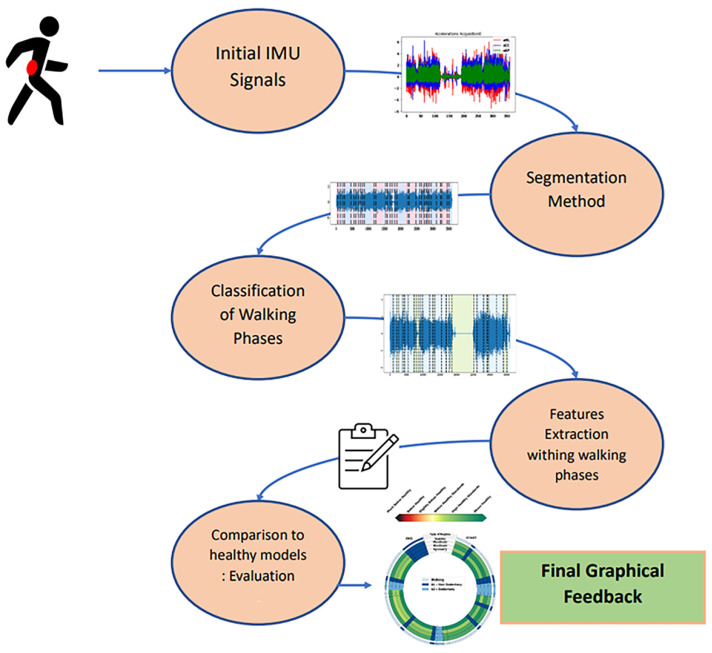
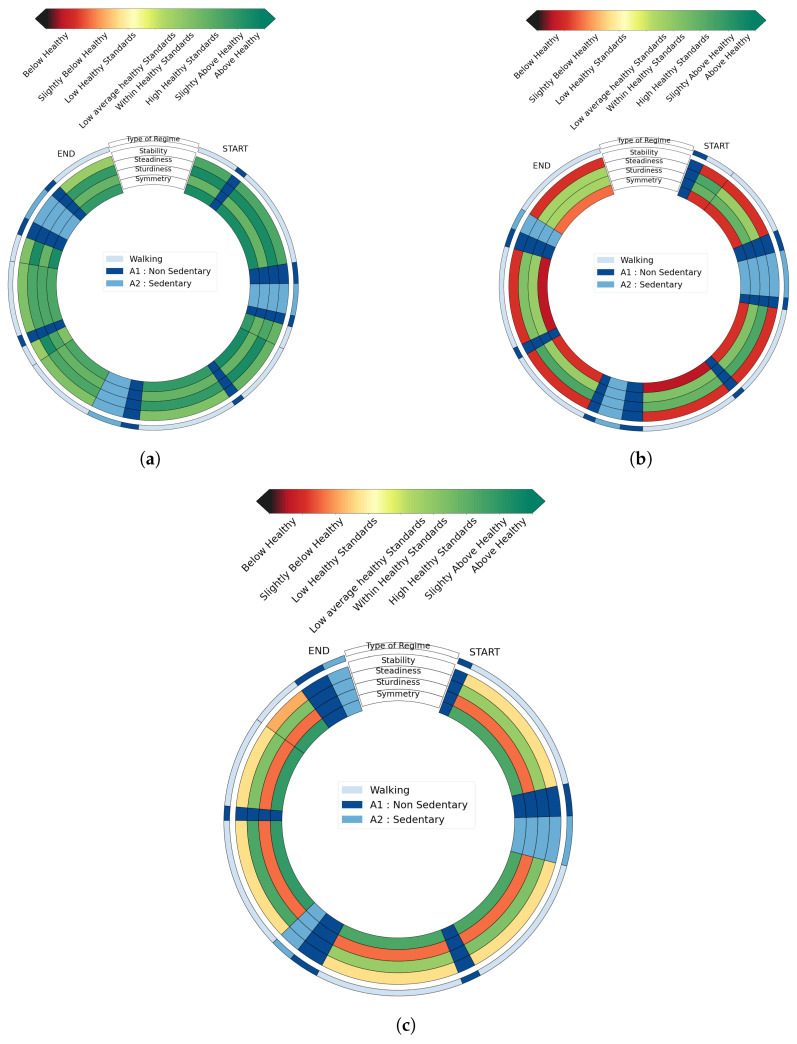
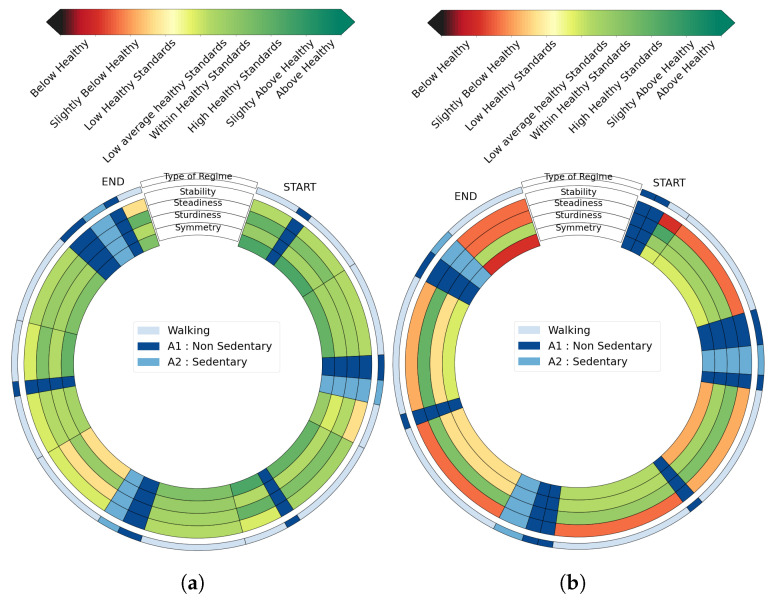
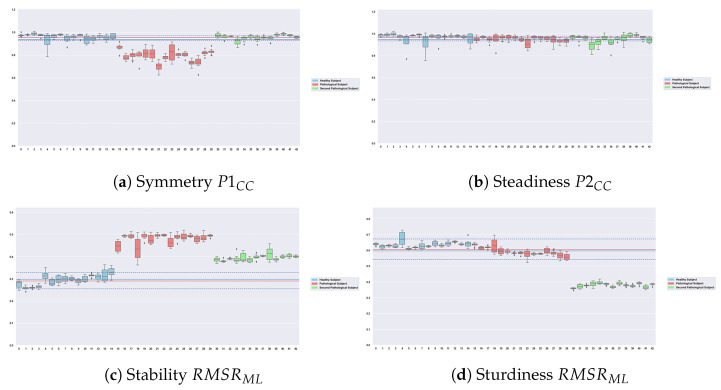
This paper presents a novel approach to creating a graphical summary of a subject's activity during a protocol in a Semi Free-Living Environment. Thanks to this new visualization, human behavior, in particular locomotion, can now be condensed into an easy-to-read and user-friendly output. As time series collected while monitoring patients in Semi Free-Living Environments are often long and complex, our contribution relies on an innovative pipeline of signal processing methods and machine learning algorithms. Once learned, the graphical representation is able to sum up all activities present in the data and can quickly be applied to newly acquired time series. In a nutshell, raw data from inertial measurement units are first segmented into homogeneous regimes with an adaptive change-point detection procedure, then each segment is automatically labeled. Then, features are extracted from each regime, and lastly, a score is computed using these features. The final visual summary is constructed from the scores of the activities and their comparisons to healthy models. This graphical output is a detailed, adaptive, and structured visualization that helps better understand the salient events in a complex gait protocol.
Keywords: Human Activity Recognition; IMU; change point detection; free-living; graphical feedback; wearable sensor.
Conflict of interest statement
The authors declare no conflict of interest.
Figures
Similar articles
-
Adaptive Change-Point Detection for Studying Human Locomotion.Annu Int Conf IEEE Eng Med Biol Soc. 2021 Nov;2021:2020-2024. doi: 10.1109/EMBC46164.2021.9629775. Annu Int Conf IEEE Eng Med Biol Soc. 2021. PMID: 34891684
-
A Systematic Evaluation of Feature Encoding Techniques for Gait Analysis Using Multimodal Sensory Data.Sensors (Basel). 2023 Dec 22;24(1):75. doi: 10.3390/s24010075. Sensors (Basel). 2023. PMID: 38202937 Free PMC article.
-
Lower Limb Locomotion Activity Recognition of Healthy Individuals Using Semi-Markov Model and Single Wearable Inertial Sensor.Sensors (Basel). 2019 Sep 29;19(19):4242. doi: 10.3390/s19194242. Sensors (Basel). 2019. PMID: 31569584 Free PMC article.
-
Gait analysis in neurological populations: Progression in the use of wearables.Med Eng Phys. 2021 Jan;87:9-29. doi: 10.1016/j.medengphy.2020.11.005. Epub 2020 Nov 13. Med Eng Phys. 2021. PMID: 33461679 Review.
-
IoT-Enabled Gait Assessment: The Next Step for Habitual Monitoring.Sensors (Basel). 2023 Apr 19;23(8):4100. doi: 10.3390/s23084100. Sensors (Basel). 2023. PMID: 37112441 Free PMC article. Review.
Cited by
-
Innovative Detection and Segmentation of Mobility Activities in Patients Living with Parkinson's Disease Using a Single Ankle-Positioned Smartwatch.Sensors (Basel). 2024 Aug 24;24(17):5486. doi: 10.3390/s24175486. Sensors (Basel). 2024. PMID: 39275396 Free PMC article.
References
-
- Silva de Lima A.L., Evers L.J., Hahn T., Bataille L., Hamilton J.L., Little M.A., Okuma Y., Bloem B.R., Faber M.J. Freezing of gait and fall detection in Parkinson’s disease using wearable sensors: A systematic review. J. Neurol. 2017;264:1642–1654. doi: 10.1007/s00415-017-8424-0. - DOI - PMC - PubMed
-
- Semwal V.B., Gaud N., Lalwani P., Bijalwan V., Alok A.K. Pattern identification of different human joints for different human walking styles using inertial measurement unit (IMU) sensor. Artif. Intell. Rev. 2022;55:1149–1169. doi: 10.1007/s10462-021-09979-x. - DOI
MeSH terms
LinkOut - more resources
Full Text Sources
Research Materials
