

Study on the Psychological States of Olfactory Stimuli Using Electroencephalography and Heart Rate Variability
- PMID: 37112367
- PMCID: PMC10143627
- DOI: 10.3390/s23084026
Study on the Psychological States of Olfactory Stimuli Using Electroencephalography and Heart Rate Variability
Abstract
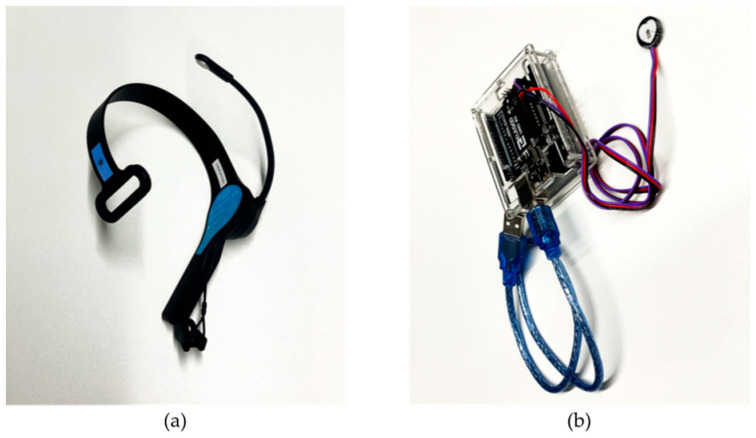
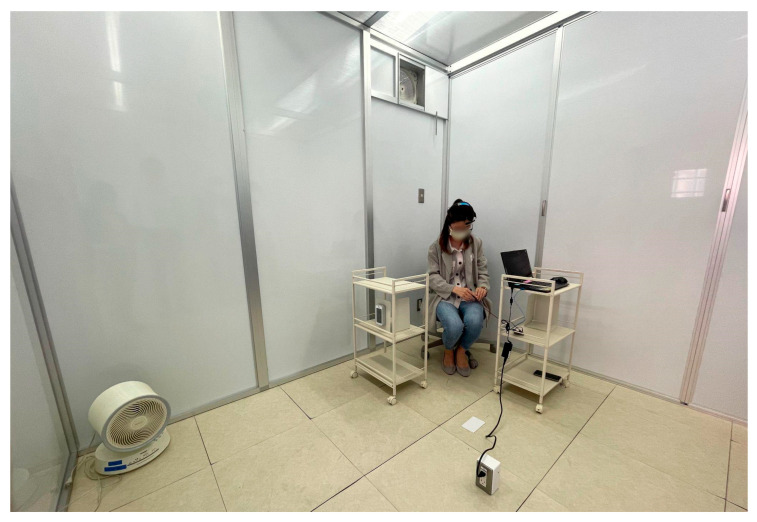
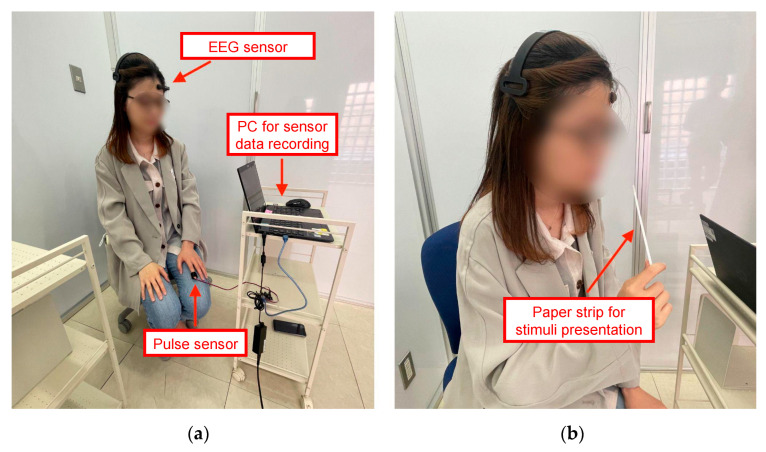
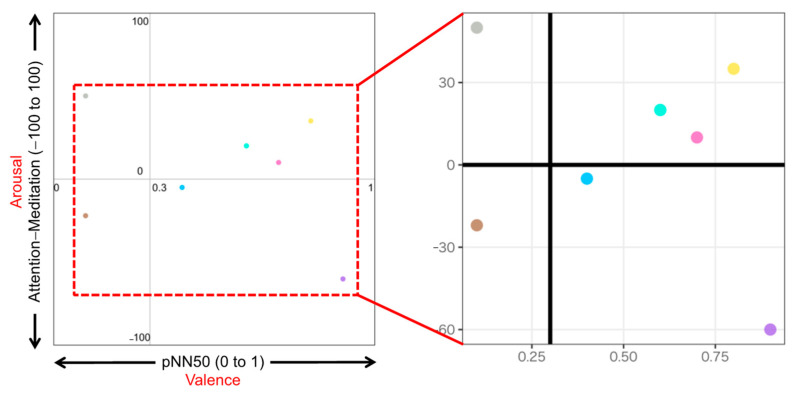
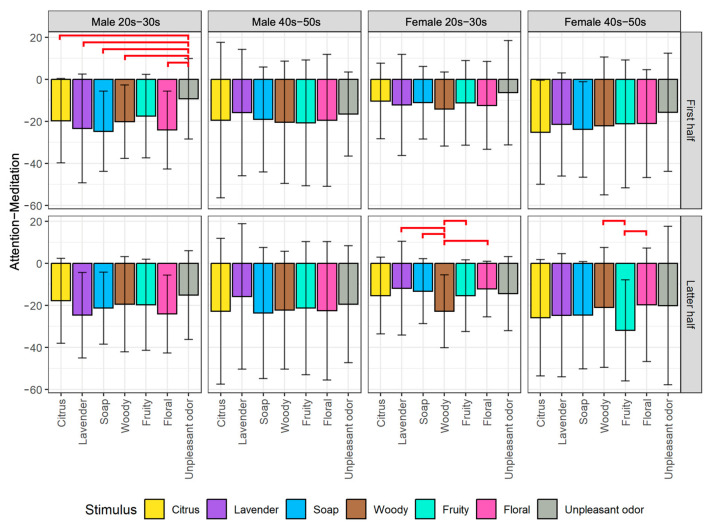
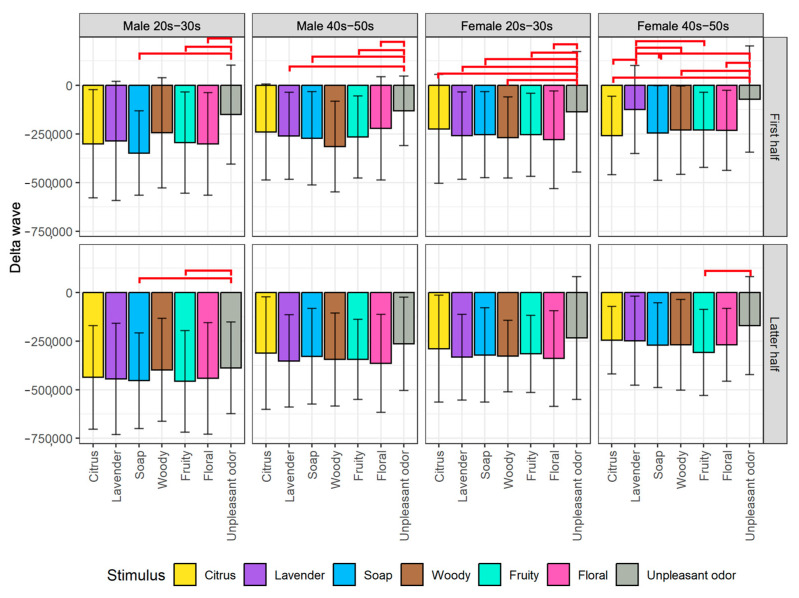
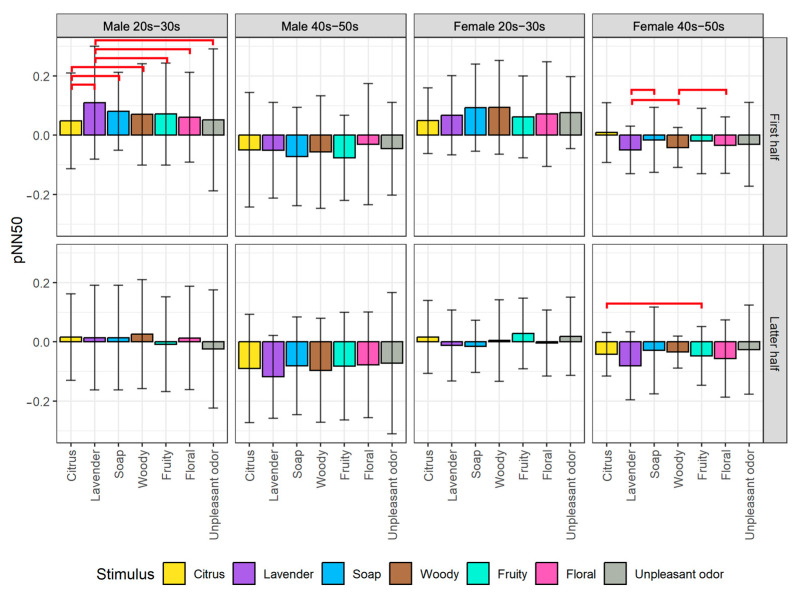
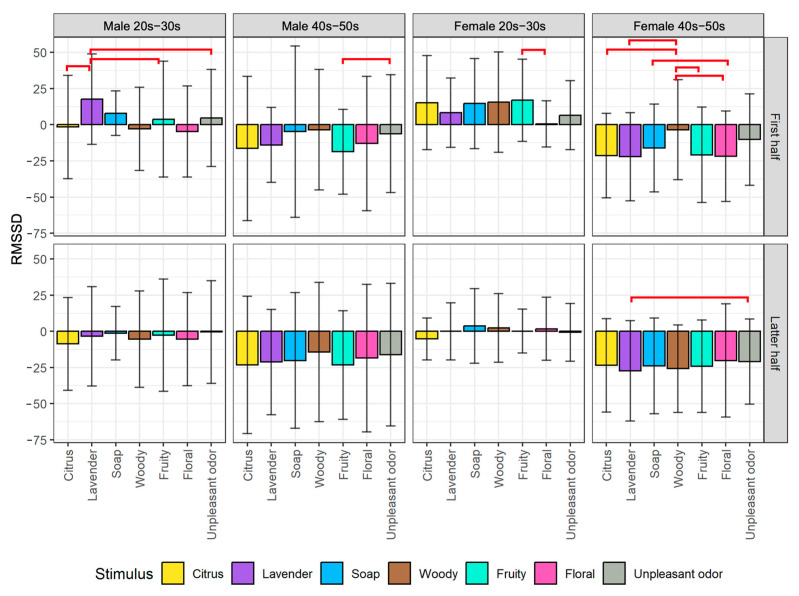
In the modern information society, people are constantly exposed to stress due to complex work environments and various interpersonal relationships. Aromatherapy is attracting attention as one of the methods for relieving stress using aroma. A method to quantitatively evaluate such an effect is necessary to clarify the effect of aroma on the human psychological state. In this study, we propose a method of using two biological indexes, electroencephalogram (EEG) and heart rate variability (HRV), to evaluate human psychological states during the inhalation of aroma. The purpose is to investigate the relationship between biological indexes and the psychological effect of aromas. First, we conducted an aroma presentation experiment using seven different olfactory stimuli while collecting data from EEG and pulse sensors. Next, we extracted the EEG and HRV indexes from the experimental data and analyzed them with respect to the olfactory stimuli. Our study found that olfactory stimuli have a strong effect on psychological states during aroma stimuli and that the human response to olfactory stimuli is immediate but gradually adapts to a more neutral state. The EEG and HRV indexes showed significant differences between aromas and unpleasant odors especially for male participants in their 20-30s, while the delta wave and RMSSD indexes showed potential for generalizing the method to evaluate psychological states influenced by olfactory stimuli across genders and generations. The results suggest the possibility of using EEG and HRV indexes to evaluate psychological states toward olfactory stimuli such as aroma. In addition, we visualized the psychological states affected by the olfactory stimuli on an emotion map, suggesting an appropriate range of EEG frequency bands for evaluating psychological states applied to the olfactory stimuli. The novelty of this research lies in our proposed method to provide a more detailed picture of the psychological responses to olfactory stimuli using the integration of biological indexes and emotion map, which contributes to the areas such as marketing and product design by providing insights into the emotional responses of consumers to different olfactory products.
Keywords: electroencephalography (EEG); heart rate variability (HRV); olfactory stimuli.
Conflict of interest statement
The authors declare no conflict of interest.
Figures


Similar articles
-
Decoding olfactory stimuli in EEG data using nonlinear features: A pilot study.J Neurosci Methods. 2020 Jul 15;341:108780. doi: 10.1016/j.jneumeth.2020.108780. Epub 2020 May 16. J Neurosci Methods. 2020. PMID: 32428624
-
Characteristics of electroencephalographic responses induced by a pleasant and an unpleasant odor.J Physiol Anthropol Appl Human Sci. 2003 Nov;22(6):285-91. doi: 10.2114/jpa.22.285. J Physiol Anthropol Appl Human Sci. 2003. PMID: 14646263
-
Influence of visual elicitation over emotion regulation: An investigation employing the heart rate variability.J Integr Neurosci. 2017;16(2):209-226. doi: 10.3233/JIN-170014. J Integr Neurosci. 2017. PMID: 28891510
-
Beyond Aromas: Exploring the Development and Potential Applications of Electroencephalography in Olfactory Research-From General Scents to Food Flavor Science Frontiers.Annu Rev Food Sci Technol. 2025 Apr;16(1):147-170. doi: 10.1146/annurev-food-110124-035308. Epub 2025 Jan 2. Annu Rev Food Sci Technol. 2025. PMID: 39745932 Review.
-
Psychophysiological effect of odor.Crit Rev Food Sci Nutr. 1993;33(1):57-62. doi: 10.1080/10408399309527612. Crit Rev Food Sci Nutr. 1993. PMID: 8424855 Review.
Cited by
-
Prenatal anxiety recognition model integrating multimodal physiological signal.Sci Rep. 2024 Sep 18;14(1):21767. doi: 10.1038/s41598-024-72507-8. Sci Rep. 2024. PMID: 39294387 Free PMC article.
-
Effects of sensory room intervention on autonomic function in healthy adults: A pilot randomized controlled trial.PLoS One. 2025 Apr 23;20(4):e0319649. doi: 10.1371/journal.pone.0319649. eCollection 2025. PLoS One. 2025. PMID: 40267087 Free PMC article. Clinical Trial.
-
Autonomic Responses Associated with Olfactory Preferences of Fragrance Consumers: Skin Conductance, Respiration, and Heart Rate.Sensors (Basel). 2024 Aug 29;24(17):5604. doi: 10.3390/s24175604. Sensors (Basel). 2024. PMID: 39275516 Free PMC article.
-
Visualizing Relaxation in Wearables: Multi-Domain Feature Fusion of HRV Using Fuzzy Recurrence Plots.Sensors (Basel). 2025 Jul 6;25(13):4210. doi: 10.3390/s25134210. Sensors (Basel). 2025. PMID: 40648465 Free PMC article.
References
-
- Overview of the 2018 Occupational Safety and Health Survey (Fact-Finding Survey) [(accessed on 31 January 2023)]. Available online: www.mhlw.go.jp/toukei/list/dl/h30-46-50_gaikyo.pdf. (In Japanese)
-
- Awareness and Fact-Finding Survey Regarding Aromatherapy. [(accessed on 31 January 2023)]. Available online: www.aromakankyo.or.jp/basics/literature/result/vol3.php.
-
- Suzuki A., Okubo N. Aromatherapy Research in Nursing and Its Present State. St. Luke’s Coll. Nurs. Mag. 2009;24:17–27. (In Japanese)
-
- Duan X., Tashiro M., Wu D., Yambe T. Heart rate variability in autonomic function and localization of cerebral activity during inhalation of perfumed fragrances. J. Int. Soc. Life Inf. Sci. 2006;24:383–395.
MeSH terms
LinkOut - more resources
Full Text Sources
