

A Preliminary Study of Deep Learning Sensor Fusion for Pedestrian Detection
- PMID: 37112506
- PMCID: PMC10144184
- DOI: 10.3390/s23084167
A Preliminary Study of Deep Learning Sensor Fusion for Pedestrian Detection
Abstract
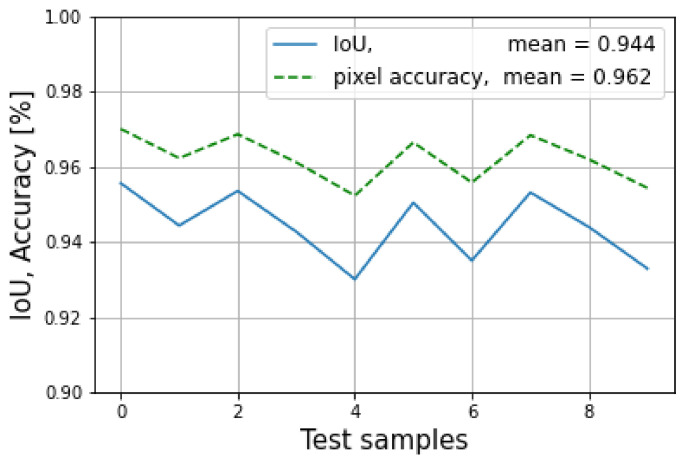
Most pedestrian detection methods focus on bounding boxes based on fusing RGB with lidar. These methods do not relate to how the human eye perceives objects in the real world. Furthermore, lidar and vision can have difficulty detecting pedestrians in scattered environments, and radar can be used to overcome this problem. Therefore, the motivation of this work is to explore, as a preliminary step, the feasibility of fusing lidar, radar, and RGB for pedestrian detection that potentially can be used for autonomous driving that uses a fully connected convolutional neural network architecture for multimodal sensors. The core of the network is based on SegNet, a pixel-wise semantic segmentation network. In this context, lidar and radar were incorporated by transforming them from 3D pointclouds into 2D gray images with 16-bit depths, and RGB images were incorporated with three channels. The proposed architecture uses a single SegNet for each sensor reading, and the outputs are then applied to a fully connected neural network to fuse the three modalities of sensors. Afterwards, an up-sampling network is applied to recover the fused data. Additionally, a custom dataset of 60 images was proposed for training the architecture, with an additional 10 for evaluation and 10 for testing, giving a total of 80 images. The experiment results show a training mean pixel accuracy of 99.7% and a training mean intersection over union of 99.5%. Also, the testing mean of the IoU was 94.4%, and the testing pixel accuracy was 96.2%. These metric results have successfully demonstrated the effectiveness of using semantic segmentation for pedestrian detection under the modalities of three sensors. Despite some overfitting in the model during experimentation, it performed well in detecting people in test mode. Therefore, it is worth emphasizing that the focus of this work is to show that this method is feasible to be used, as it works regardless of the size of the dataset. Also, a bigger dataset would be necessary to achieve a more appropiate training. This method gives the advantage of detecting pedestrians as the human eye does, thereby resulting in less ambiguity. Additionally, this work has also proposed an extrinsic calibration matrix method for sensor alignment between radar and lidar based on singular value decomposition.
Keywords: autonomous driving; convolutional neural networks: sensor calibration; sensor fusion.
Conflict of interest statement
The authors declare no conflict of interest.
Figures


References
-
- Alzubaidi L., Zhang J., Humaidi A.J., Al-dujaili A., Duan Y., Al-Shamma O., Santamaría J., Fadhel M.A., Al-Amidie M., Farhan L. Review of deep learning: Concepts, CNN architectures, challenges, applications, future directions. J. Big Data. 2021;8:53. doi: 10.1186/s40537-021-00444-8. - DOI - PMC - PubMed
-
- Bimbraw K. Autonomous cars: Past, present and future a review of the developments in the last century, the present scenario and the expected future of autonomous vehicle technology; Proceedings of the 2015 12th International Conference on Informatics in Control, Automation and Robotics (ICINCO); Colmar, France. 21–23 July 2015; pp. 191–198.
-
- Yao G., Lei T., Zhong J. A review of Convolutional-Neural-Network-based action recognition. Pattern Recognit. Lett. 2019;118:14–22. doi: 10.1016/j.patrec.2018.05.018. Cooperative and Social Robots: Understanding Human Activities and Intentions. - DOI
-
- Soga M., Kato T., Ohta M., Ninomiya Y. Pedestrian Detection with Stereo Vision; Proceedings of the 21st International Conference on Data Engineering Workshops (ICDEW’05); Tokyo, Japan. 3–4 April 2005; p. 1200. - DOI
-
- Yu X., Marinov M. A Study on Recent Developments and Issues with Obstacle Detection Systems for Automated Vehicles. Sustainability. 2020;12:3281. doi: 10.3390/su12083281. - DOI
MeSH terms
Grants and funding
LinkOut - more resources
Full Text Sources
