

Mathematical Modeling Evaluates How Vaccinations Affected the Course of COVID-19 Disease Progression
- PMID: 37112635
- PMCID: PMC10142609
- DOI: 10.3390/vaccines11040722
Mathematical Modeling Evaluates How Vaccinations Affected the Course of COVID-19 Disease Progression
Abstract
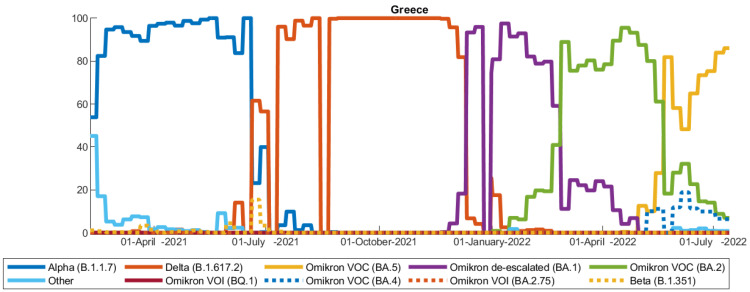
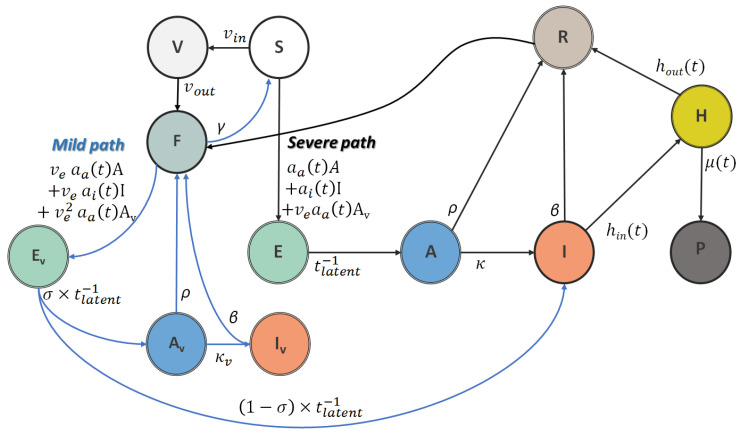
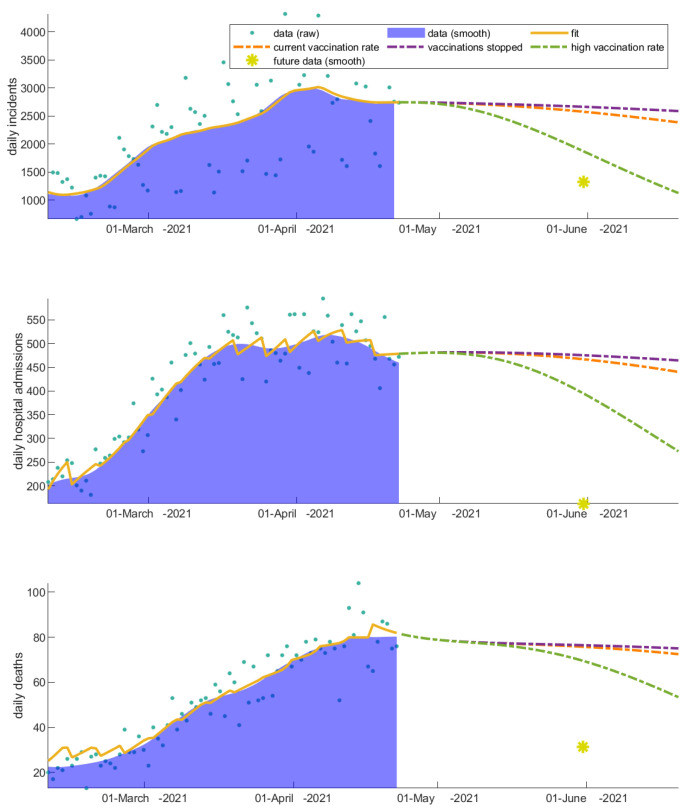
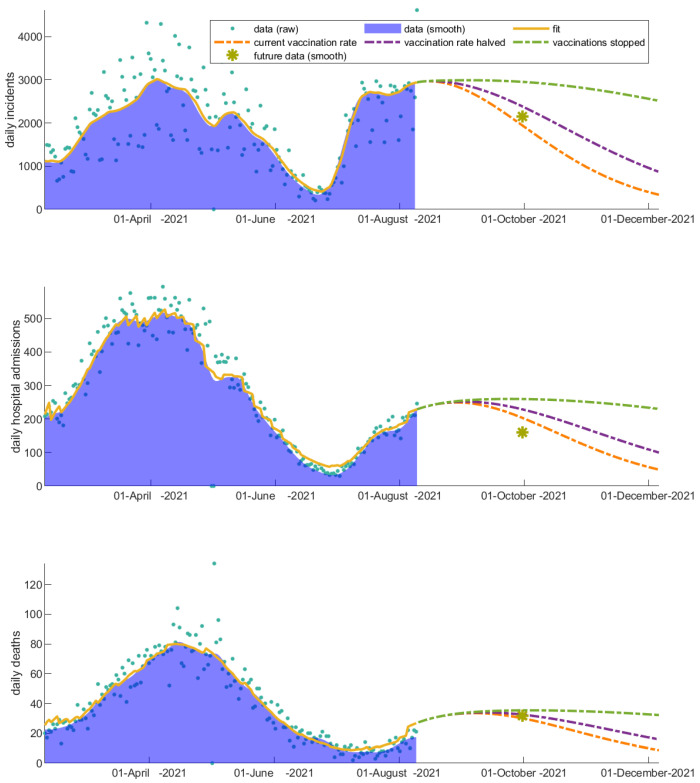
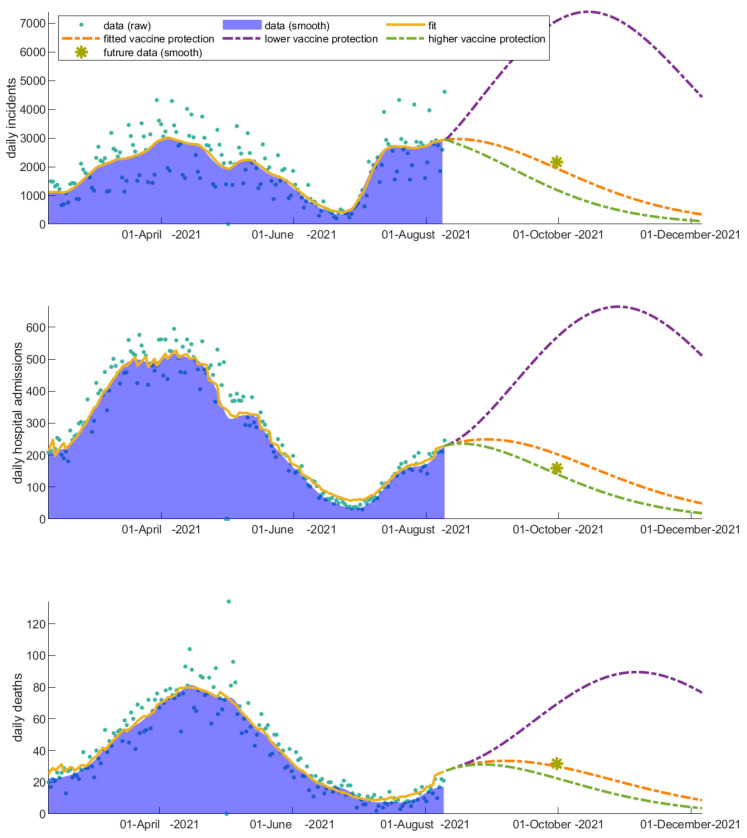
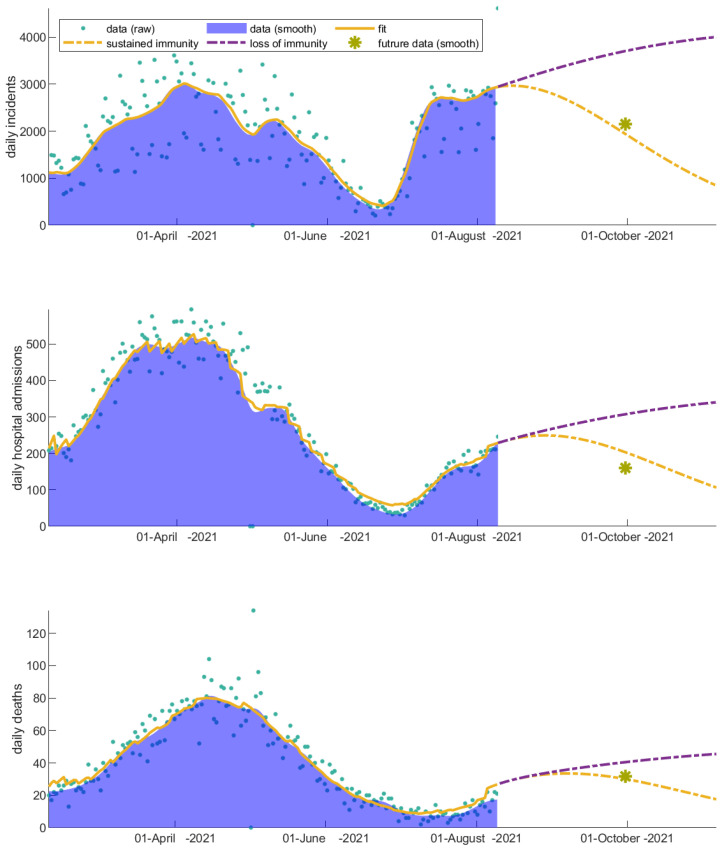
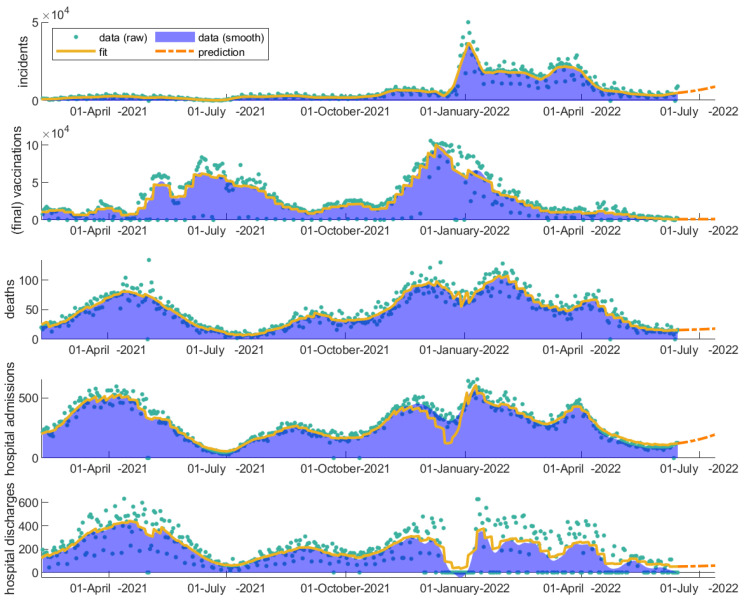
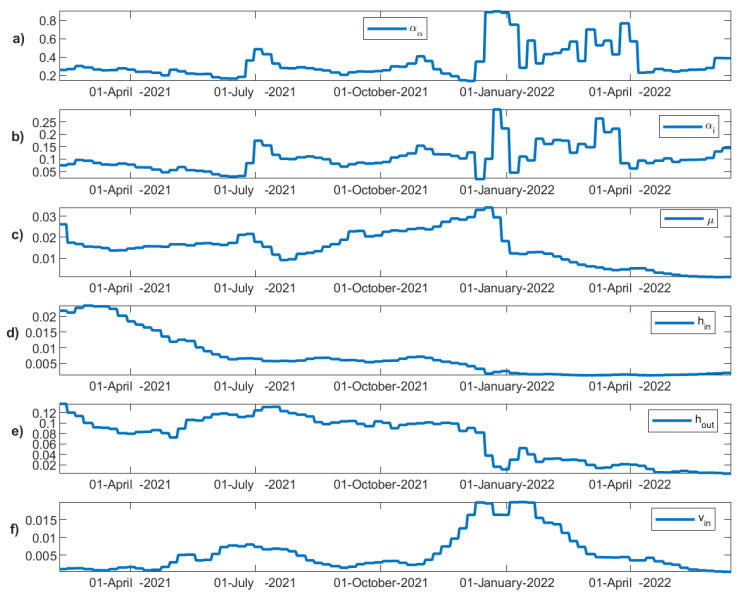
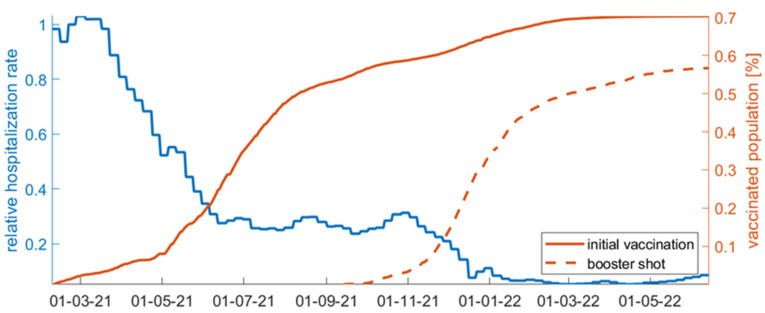
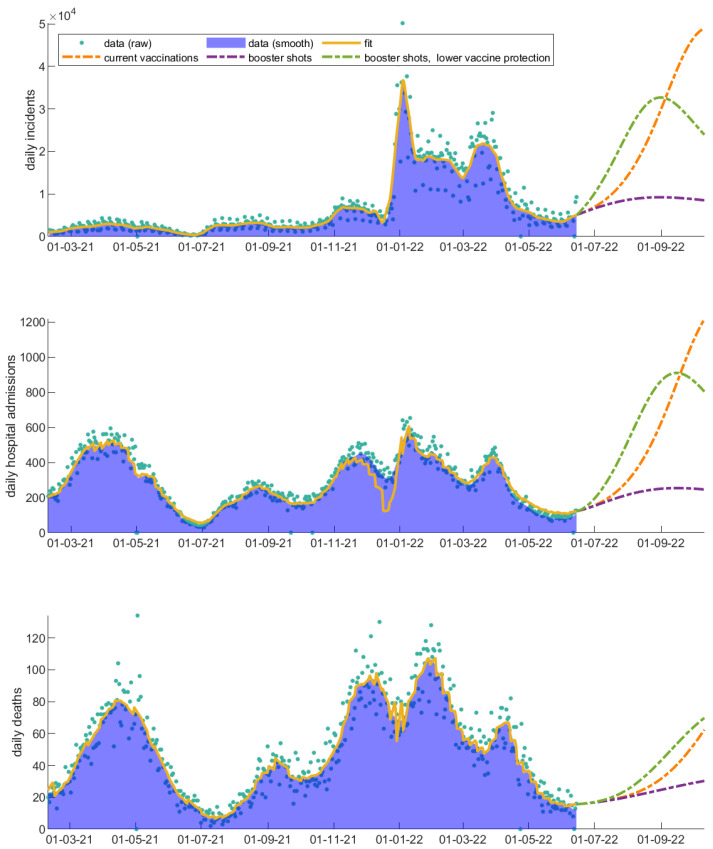
The regulation policies implemented, the characteristics of vaccines, and the evolution of the virus continue to play a significant role in the progression of the SARS-CoV-2 pandemic. Numerous research articles have proposed using mathematical models to predict the outcomes of different scenarios, with the aim of improving awareness and informing policy-making. In this work, we propose an expansion to the classical SEIR epidemiological model that is designed to fit the complex epidemiological data of COVID-19. The model includes compartments for vaccinated, asymptomatic, hospitalized, and deceased individuals, splitting the population into two branches based on the severity of progression. In order to investigate the impact of the vaccination program on the spread of COVID-19 in Greece, this study takes into account the realistic vaccination program implemented in Greece, which includes various vaccination rates, different dosages, and the administration of booster shots. It also examines for the first time policy scenarios at crucial time-intervention points for Greece. In particular, we explore how alterations in the vaccination rate, immunity loss, and relaxation of measures regarding the vaccinated individuals affect the dynamics of COVID-19 spread. The modeling parameters revealed an alarming increase in the death rate during the dominance of the delta variant and before the initiation of the booster shot program in Greece. The existing probability of vaccinated people becoming infected and transmitting the virus sets them as catalytic players in COVID-19 progression. Overall, the modeling observations showcase how the criticism of different intervention measures, the vaccination program, and the virus evolution has been present throughout the various stages of the pandemic. As long as immunity declines, new variants emerge, and vaccine protection in reducing transmission remains incompetent; monitoring the complex vaccine and virus evolution is critical to respond proactively in the future.
Keywords: COVID-19; SARS-CoV-2; SEIR model; epidemics; mathematical modeling; scenario analyses; vaccination.
Conflict of interest statement
The authors declare no conflict of interest.
Figures
Similar articles
-
COVID-19 pandemic dynamics in India, the SARS-CoV-2 Delta variant, and implications for vaccination.medRxiv [Preprint]. 2021 Nov 22:2021.06.21.21259268. doi: 10.1101/2021.06.21.21259268. medRxiv. 2021. Update in: J R Soc Interface. 2022 Jun;19(191):20210900. doi: 10.1098/rsif.2021.0900. PMID: 34845460 Free PMC article. Updated. Preprint.
-
Susceptibility to Resurgent COVID-19 Outbreaks Following Vaccine Rollouts: A Modeling Study.Viruses. 2022 Oct 12;14(10):2237. doi: 10.3390/v14102237. Viruses. 2022. PMID: 36298791 Free PMC article.
-
Robustness analysis for quantitative assessment of vaccination effects and SARS-CoV-2 lineages in Italy.BMC Infect Dis. 2022 Apr 29;22(1):415. doi: 10.1186/s12879-022-07395-2. BMC Infect Dis. 2022. PMID: 35488251 Free PMC article.
-
Estimating the Number of COVID-19 Cases and Impact of New COVID-19 Variants and Vaccination on the Population in Kerman, Iran: A Mathematical Modeling Study.Comput Math Methods Med. 2022 Apr 26;2022:6624471. doi: 10.1155/2022/6624471. eCollection 2022. Comput Math Methods Med. 2022. PMID: 35495892 Free PMC article.
-
Current scenario of COVID-19 vaccinations and immune response along with antibody titer in vaccinated inhabitants of different countries.Int Immunopharmacol. 2021 Oct;99:108050. doi: 10.1016/j.intimp.2021.108050. Epub 2021 Aug 6. Int Immunopharmacol. 2021. PMID: 34426120 Free PMC article. Review.
Cited by
-
Multiscale Geographically Weighted Regression in the Investigation of Local COVID-19 Anomalies Based on Population Age Structure in Poland.Int J Environ Res Public Health. 2023 May 19;20(10):5875. doi: 10.3390/ijerph20105875. Int J Environ Res Public Health. 2023. PMID: 37239602 Free PMC article.
-
Planning and adjusting the COVID-19 booster vaccination campaign to reduce disease burden.Infect Dis Model. 2024 Sep 12;10(1):150-162. doi: 10.1016/j.idm.2024.09.002. eCollection 2025 Mar. Infect Dis Model. 2024. PMID: 39380724 Free PMC article.
References
Grants and funding
LinkOut - more resources
Full Text Sources
Research Materials
Miscellaneous
