. 2023 Mar 26;11(4):735.
doi: 10.3390/vaccines11040735.

Tracking B Cell Memory to SARS-CoV-2 Using Rare Cell Analysis System

Affiliations

Tracking B Cell Memory to SARS-CoV-2 Using Rare Cell Analysis System

Dong-Yan Tsai et al. Vaccines (Basel). .

Abstract

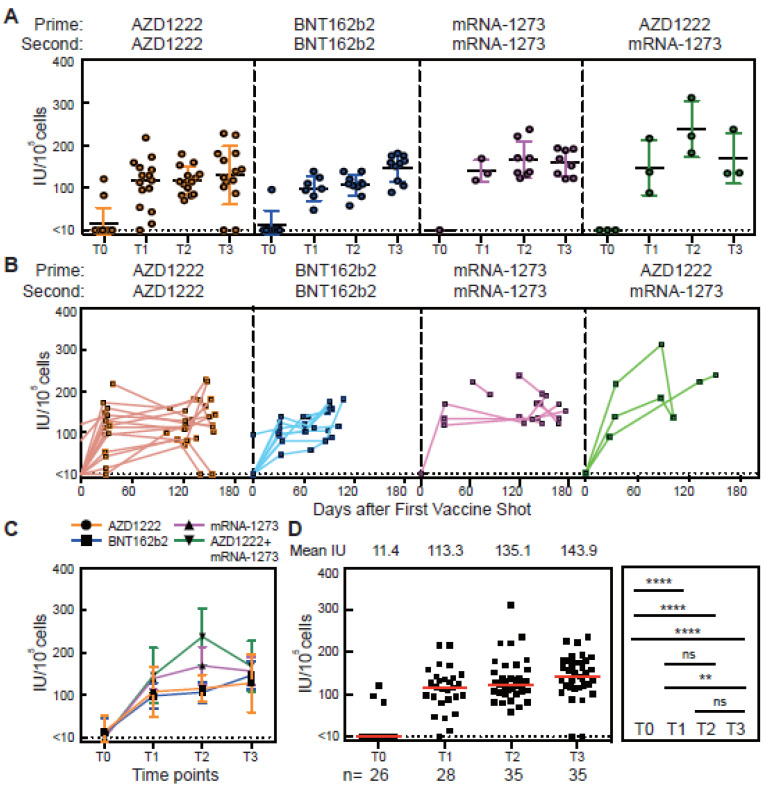
Rapid mutations within SARS-CoV-2 are driving immune escape, highlighting the need for in-depth and routine analysis of memory B cells (MBCs) to complement the important but limited information from neutralizing antibody (nAb) studies. In this study, we collected plasma samples and peripheral blood mononuclear cells (PBMCs) from 35 subjects and studied the nAb titers and the number of antigen-specific memory B cells at designated time points before and after vaccination. We developed an assay to use the MiSelect R II System with a single-use microfluidic chip to directly detect the number of spike-receptor-binding domain (RBD)-specific MBCs in PBMCs. Our results show that the number of spike-RBD-specific MBCs detected by the MiSelect R II System is highly correlated with the level of nAbs secreted by stimulated PBMCs, even 6 months after vaccination when nAbs were generally not present in plasma. We also found antigen-specific cells recognizing Omicron spike-RBD were present in PBMCs from booster vaccination of subjects, but with a high variability in the number of B cells. The MiSelect R II System provided a direct, automated, and quantitative method to isolate and analyze subsets of rare cells for tracking cellular immunity in the context of a rapidly mutating virus.

Keywords: SARS-CoV-2; memory B cells; rare cells; vaccines.


Conflict of interest statement

The authors receive financial benefit from MiCareo via employment, ownership, or intellectual property. Nathan Chen may additionally receive financial benefit from Adimmune Corporation via employment, ownership, or intellectual property.

Figures

Figure 1
Figure 1
Neutralizing antibody responses before and after vaccination in SARS-CoV-2 naïve subjects. (A) Timeline for blood draws for analysis of nAbs in plasma, the secretion from stimulated PBMCs, or cellular identification with the MiSelect R II. T0 is defined as being shortly before vaccination, T1 is 4 weeks after the first vaccine dose, T2 is 4 weeks after the second dose, and T3 is 8 weeks after the second dose. The time interval between the first dose and the second dose varied from approximately three months to just one month. (BD) Concentration of neutralizing anti-spike-RBD IgG antibodies in plasma samples from vaccinated subjects over time. (E) Total neutralizing anti-spike-RBD IgG concentrations and mean number in plasma sample from all vaccinated subjects (n) for each time point. IU is international units. The error bar indicates the median and interquartile range. Statistics were calculated using the non-parametric Mann–Whitney test. The dotted line indicated the limit of detection (LOD) for the assay.; *** p < 0.001; **** p < 0.0001; ns, no significant difference.
Figure 2
Figure 2
Spike-RBD-specific memory B cells induced by SARS-CoV-2 vaccination over time. (A) The MiSelect R II System for spike-RBD cell isolation and analysis. (B) Example images of the automated reagent labeling and fluorescence imaging performed by the MiSelect R II. (CE) CD19+, CD27+, IgG+, spike-RBD+, CD3- specific MBCs in PBMC samples from vaccinated subjects over time. (F) Total number of spike-RBD-specific MBCs in PBMC samples from all vaccinated subjects for each time point. The number of subjects (n) was shown below the graph. The error bar indicates the median and interquartile range. Statistics were calculated using the non-parametric Mann–Whitney test. The dotted line indicated the limit of detection (LOD) for the assay. * p < 0.05; ** p < 0.01; **** p < 0.0001; ns, no significant difference.
Figure 3
Figure 3
In vitro culture system to differentiate spike-RBD-specific cells into antibody secreting cells. (AC) Concentration of neutralizing anti-spike-RBD IgG antibodies in culture supernatant over time from PBMC stimulated with R848, IL-2, IL-21, sCD40, and WT-RBD. (D) Total neutralizing anti-spike-RBD IgG concentrations in culture supernatant after 3 days of stimulation for each time point. The number of subjects (n) is shown below the graph. IU indicates the international units. The error bar indicates that the median and interquartile range. Statistics were calculated using the non-parametric Mann–Whitney test. The dotted line indicated the limit of detection (LOD) for the assay. ** p < 0.01; **** p < 0.0001; ns, no significant difference.
Figure 4
Figure 4
Correlation between neutralizing antibody titers in plasma or secreting by PBMC stimulation and spike-RBD-specific memory B cells. (A) Correlation of neutralizing IgG in plasma with neutralizing IgG levels from in vitro stimulation. (B) Correlation of neutralizing IgG in plasma with spike-RBD-specific MBCs in PBMC samples. (C) Correlation of neutralizing IgG levels from in vitro stimulation with spike-RBD-specific MBCs in PBMC samples. Correlations were calculated using non-parametric Spearman’s rank correlation and are shown with linear trend lines.
Figure 5
Figure 5
Spike-RBD-specific cells induced by SARS-CoV-2 vaccination over time. (A) Timeline for blood draws for analysis of nAbs in plasma, the secretion from stimulated PBMCs, or cellular identification with the MiSelect R II. T4 was 4 weeks after a 3rd vaccination, while T5 was a blood draw 6 months later. (B) Concentration of neutralizing anti-spike-RBD IgG antibodies in plasma samples from vaccinated subjects over time. (C) Total number of spike-RBD-specific MBCs in PBMC samples from all vaccinated subjects for each time point. (D) Concentration of neutralizing anti-spike-RBD IgG antibodies in culture supernatant over time from PBMC stimulated with R848, IL-2, IL-21, sCD40, and WT-RBD. The error bar indicates the median. Statistics were calculated using the non-parametric Mann–Whitney test. The dotted line indicated the limit of detection (LOD) for the assay. * p < 0.05; ** p < 0.01; *** p < 0.001; ns, no significant difference.
Figure 6
Figure 6
Omicron spike-RBD-specific memory B cells detected by the MiSelect R II system after boost vaccination. (A) Blood was collected 4 weeks after a 3rd vaccine shot (T4). (B) CD19+, CD27+, IgG+, wildtype or Omicron spike-RBD+, CD3- specific MBCs in PBMC samples from mRNA boost vaccination (n = 6). (C) Concentration of neutralizing anti-wildtype-RBD or anti-Omicron-RBD IgG antibodies in plasma sample from mRNA boost vaccination (n = 6).

Similar articles

References

    1. Callaway E. The next generation of coronavirus vaccines: A graphical guide. Nature. 2023;614:22–25. doi: 10.1038/d41586-023-00220-z. - DOI - PubMed
    1. Joseph M., Wu Y., Dannebaum R., Rubelt F., Zlatareva I., Lorenc A., Du Z.G., Davies D., Kyle-Cezar F., Das A., et al. Global patterns of antigen receptor repertoire disruption across adaptive immune compartments in COVID-19. Proc. Natl. Acad. Sci. USA. 2022;119:e2201541119. doi: 10.1073/pnas.2201541119. - DOI - PMC - PubMed
    1. Sette A., Crotty S. Immunological memory to SARS-CoV-2 infection and COVID-19 vaccines. Immunol. Rev. 2022;310:27–46. doi: 10.1111/imr.13089. - DOI - PMC - PubMed
    1. Vardhana S., Baldo L., Morice W.G., 2nd, Wherry E.J. Understanding T cell responses to COVID-19 is essential for informing public health strategies. Sci. Immunol. 2022;7:eabo1303. doi: 10.1126/sciimmunol.abo1303. - DOI - PMC - PubMed
    1. Saggau C., Martini G.R., Rosati E., Meise S., Messner B., Kamps A.-K., Bekel N., Gigla J., Rose R., Voß M., et al. The pre-exposure SARS-CoV-2-specific T cell repertoire determines the quality of the immune response to vaccination. Immunity. 2022;55:1924–1939.e5. doi: 10.1016/j.immuni.2022.08.003. - DOI - PMC - PubMed

LinkOut - more resources