. 2023 Mar 29;15(4):877.
doi: 10.3390/v15040877.

In-Depth Analysis of the Re-Emergence of Respiratory Syncytial Virus at a Tertiary Care Hospital in Germany in the Summer of 2021 after the Alleviation of Non-Pharmaceutical Interventions Due to the SARS-CoV-2 Pandemic

Affiliations

In-Depth Analysis of the Re-Emergence of Respiratory Syncytial Virus at a Tertiary Care Hospital in Germany in the Summer of 2021 after the Alleviation of Non-Pharmaceutical Interventions Due to the SARS-CoV-2 Pandemic

Mario Hönemann et al. Viruses. .

Abstract

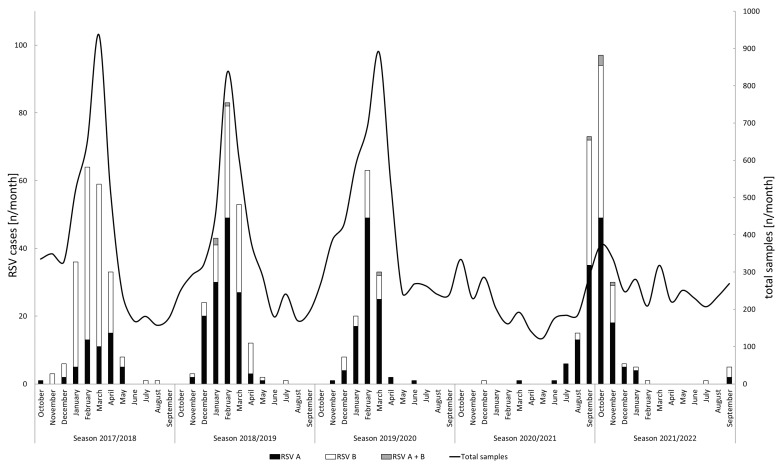
Following the extensive non-pharmaceutical interventions (NPIs) and behavioral changes in the wake of the SARS-CoV-2 pandemic, an interseasonal rise in respiratory syncytial virus (RSV) cases was observed in Germany in 2021. The aim of this study was to characterize the local molecular epidemiology of RSV infections in comparison to the three pre-pandemic seasons. Additionally, clinical data were retrieved from patient charts to determine the clinical significance of RSV infections. RSV detections peaked in calendar week 40 of 2021, 18 weeks earlier than the usual peak observed in the three pre-pandemic seasons. Sequence analysis revealed a close phylogenetic relatedness regardless of the season of origin. A significantly higher amount of pediatric cases (88.9% of all cases, p < 0.001) was observed for season 2021/2022. For the pediatric cases, significant differences were observed for an increased number of siblings in the household (p = 0.004), a lower rate of fever (p = 0.007), and a reduced amount of co-infections (p = 0.001). Although the mean age of the adult patients was significantly younger (47.1 vs. 64.7, p < 0.001), high rates of comorbidities, lower respiratory tract infections and intensive care unit admissions prevailed. The NPIs in the wake of the SARS-CoV-2 pandemic had a tremendous impact on the epidemiologic characteristics and seasonality of RSV and warrant further epidemiologic studies of this important pathogen.

Keywords: RSV; molecular epidemiology; non-pharmaceutical interventions; respiratory infections; respiratory viruses.


Conflict of interest statement

The authors declare no conflict of interest.

Figures

Figure 1
Figure 1
Monthly total numbers of tested samples and RSV cases (n = 803) stratified by subtype. Note the two different y-axes: the left axis refers to the bar charts and shows the absolute number of detected RSV cases while the right axis refers to the absolute number of tested samples, as represented by the line graph. The x-axis is labeled according to the pre-pandemic definition that was used to define the start and end of a respiratory season.
Figure 2
Figure 2
Monthly RSV cases (n = 803), positivity rates of the RSV assay and mean temperature during the study period. Note the two different y-axes: the left axis refers to the absolute numbers of detected RSV cases (light grey bars) while the right axis refers to the mean temperature of the respective month [°C] (dark grey line), the positivity rate for the pediatric patients under the age of 18 years [%] (black dotted line), and the positivity rates for adult patients [%] (black dashed line). The x-axis is labeled according to the pre-pandemic definition that was used to define the start and end of a respiratory season.
Figure 3
Figure 3
Relative distribution of RSV cases (n = 796) by age. The bars represent the relative amount of cases detected in the indicated age group for each of the analyzed seasons.
Figure 4
Figure 4
Molecular phylogenetic analysis of the RSV-A G gene by maximum likelihood method. The evolutionary history was inferred by using the maximum likelihood method based on the Tamura–Nei model [24]. The tree with the highest log likelihood (−6313.50) is shown. Initial tree(s) for the heuristic search were obtained automatically by applying neighbor-joining and BioNJ algorithms to a matrix of pairwise distances estimated using the maximum composite likelihood (MCL) approach, and then selecting the topology with superior log likelihood value. The tree is drawn to scale, with branch lengths measured in the number of substitutions per site. The analysis involved 214 nucleotide sequences. There were a total of 966 positions in the final dataset. Evolutionary analyses were conducted in MEGA7 [23]. Only nodes with a statistical support >80% are shown. The symbols indicate the sequence origin or the season of the indicated strain (dots: red, RSV-A reference strain; green: season 2017/2018 isolates; orange, season 2018/2019 isolates; purple, season 2019/2020 isolates; blue, season 2021/2022 isolates; black triangle: consensus reference sequences according to Goya et al. [14]; white triangle, consensus reference sequences according to Muñoz-Escalante et al. [16]).
Figure 5
Figure 5
Molecular phylogenetic analysis of the RSV-B G gene by maximum likelihood method. The evolutionary history was inferred by using the maximum likelihood method based on the Tamura–Nei model [24]. The tree with the highest log likelihood (−4492.48) is shown. Initial tree(s) for the heuristic search were obtained automatically by applying neighbor-joining and BioNJ algorithms to a matrix of pairwise distances estimated using the maximum composite likelihood (MCL) approach, and then selecting the topology with superior log likelihood value. The tree is drawn to scale, with branch lengths measured in the number of substitutions per site. The analysis involved 173 nucleotide sequences. There were a total of 939 positions in the final dataset. Evolutionary analyses were conducted in MEGA7 [23]. Only nodes with a statistical support >80% are shown. The symbols indicate the sequence origin or the season of the indicated strain (dots: red, RSV-B reference strain; green: season 2017/2018 isolates; orange, season 2018/2019 isolates; purple, season 2019/2020 isolates; blue, season 2021/2022 isolates; black triangle: consensus reference sequences according to Goya et al. [14]; white triangle, consensus reference sequences according to Muñoz-Escalante et al. [15]).

References

    1. Borchers A.T., Chang C., Gershwin M.E., Gershwin L.J. Respiratory syncytial virus—A comprehensive review. Clin. Rev. Allergy Immunol. 2013;45:331–379. doi: 10.1007/s12016-013-8368-9. - DOI - PMC - PubMed
    1. Krause C.I. The ABCs of RSV. Nurse Pract. 2018;43:20–26. doi: 10.1097/01.NPR.0000544277.74514.55. - DOI - PubMed
    1. El Kholy A.A., Mostafa N.A., El-Sherbini S.A., Ali A.A., Ismail R.I., Magdy R.I., Hamdy M.S., Soliman M.S. Morbidity and outcome of severe respiratory syncytial virus infection. Pediatr. Int. 2013;55:283–288. doi: 10.1111/ped.12051. - DOI - PubMed
    1. Jartti T., Smits H.H., Bønnelykke K., Bircan O., Elenius V., Konradsen J.R., Maggina P., Makrinioti H., Stokholm J., Hedlin G., et al. Bronchiolitis needs a revisit: Distinguishing between virus entities and their treatments. Allergy. 2019;74:40–52. doi: 10.1111/all.13624. - DOI - PMC - PubMed
    1. Hall C.B., Long C.E., Schnabel K.C. Respiratory syncytial virus infections in previously healthy working adults. Clin. Infect. Dis. 2001;33:792–796. doi: 10.1086/322657. - DOI - PubMed

Publication types