. 2023 Mar 31;15(4):910.
doi: 10.3390/v15040910.

Virus-Host Dynamics in Archaeal Groundwater Biofilms and the Associated Bacterial Community Composition

Affiliations

Virus-Host Dynamics in Archaeal Groundwater Biofilms and the Associated Bacterial Community Composition

Victoria Turzynski et al. Viruses. .

Abstract

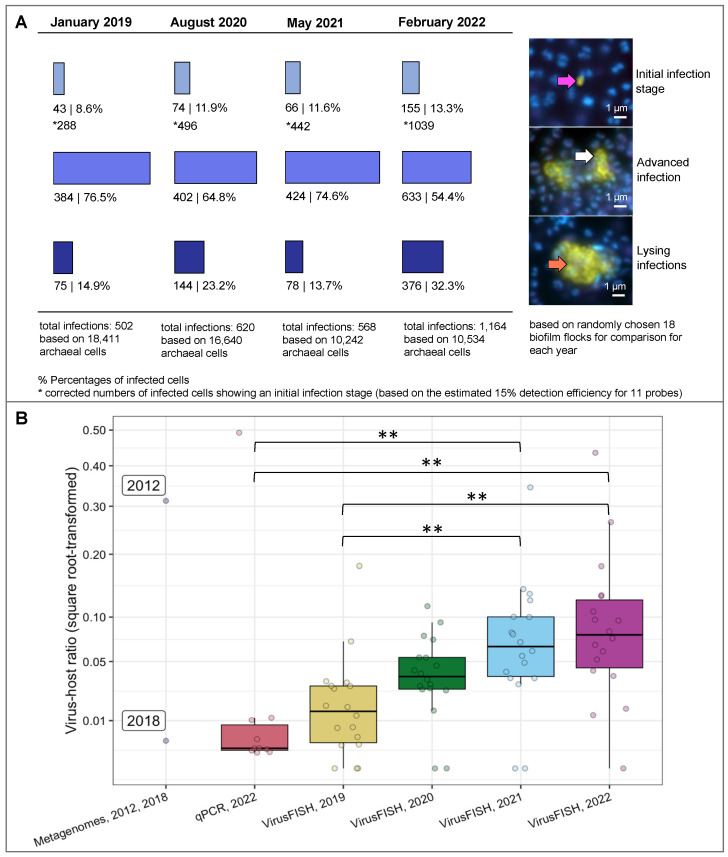
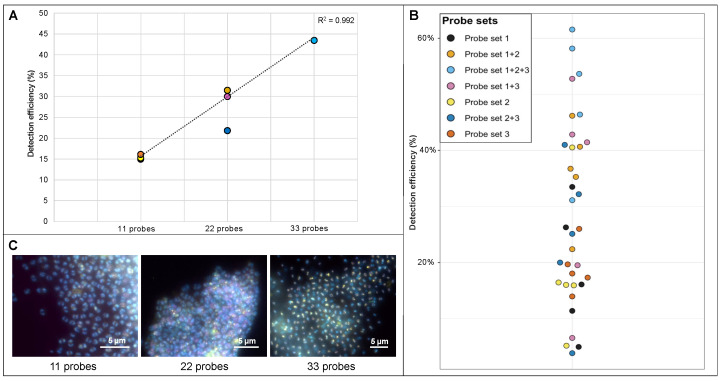
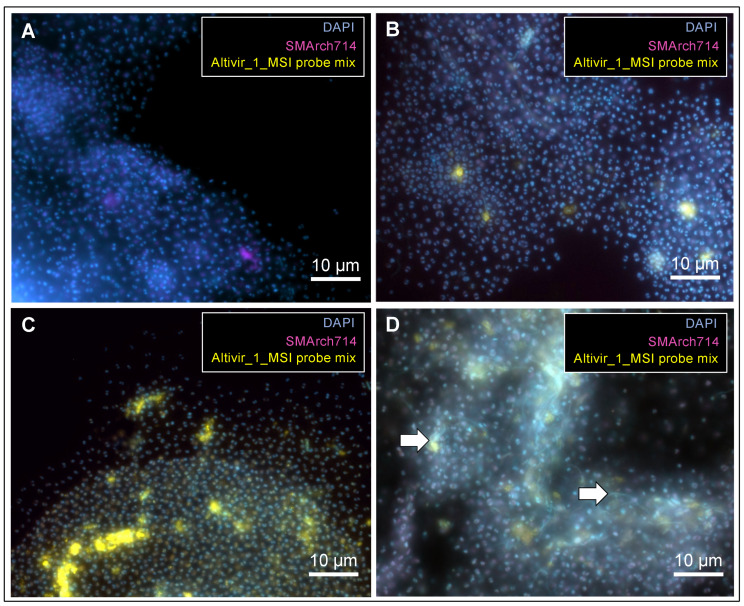
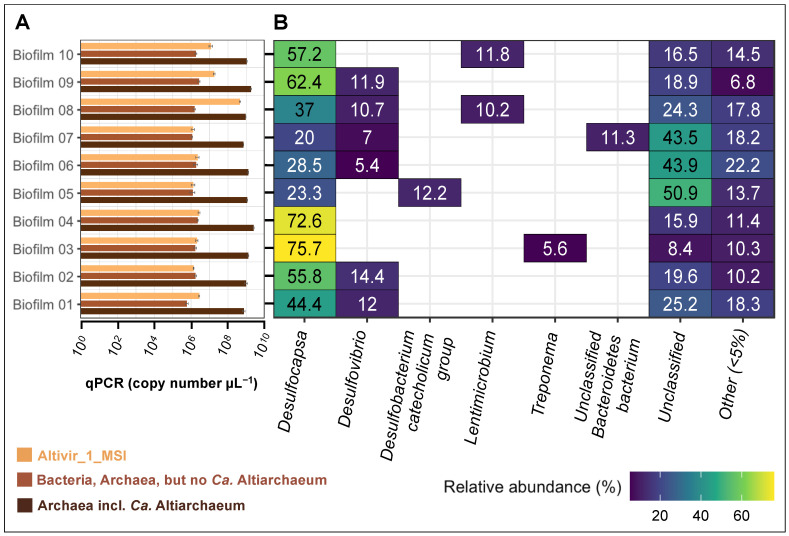
Spatial and temporal distribution of lytic viruses in deep groundwater remains unexplored so far. Here, we tackle this gap of knowledge by studying viral infections of Altivir_1_MSI in biofilms dominated by the uncultivated host Candidatus Altiarchaeum hamiconexum sampled from deep anoxic groundwater over a period of four years. Using virus-targeted direct-geneFISH (virusFISH) whose detection efficiency for individual viral particles was 15%, we show a significant and steady increase of virus infections from 2019 to 2022. Based on fluorescence micrographs of individual biofilm flocks, we determined different stages of viral infections in biofilms for single sampling events, demonstrating the progression of infection of biofilms in deep groundwater. Biofilms associated with many host cells undergoing lysis showed a substantial accumulation of filamentous microbes around infected cells probably feeding off host cell debris. Using 16S rRNA gene sequencing across ten individual biofilm flocks from one sampling event, we determined that the associated bacterial community remains relatively constant and was dominated by sulfate-reducing members affiliated with Desulfobacterota. Given the stability of the virus-host interaction in these deep groundwater samples, we postulate that the uncultivated virus-host system described herein represents a suitable model system for studying deep biosphere virus-host interactions in future research endeavors.

Keywords: Altiarchaeota; deep biosphere; direct-geneFISH; fluorescence in situ hybridization; microbial heterogeneity; subsurface viruses; virusFISH.


Conflict of interest statement

The authors declare no conflict of interest.

Figures

Figure 1
Figure 1
VirusFISH-based enumeration of infections of Ca. A. hamiconexum with Altivir_1_MSI across multiple years (A) and differences in virus-host ratios across techniques and years (B). (A) VirusFISH was performed by using a specific probe targeting Altivir_1_MSI within 18 altiarchaeal biofilms from each year sampled from the MSI [8]. The enumeration was conducted manually (data are listed in Table S2). The biofilms were visualized by using three different fluorescent channels: DAPI (blue, archaeal cells), ATTO 488 (purple, SMArch714, 16S rRNA signal), and Alexa 594 (yellow, the probe mix specific for the Altivir_1_MSI genome). The three fluorescent channels were merged for visualization (individual images available on FigShare). Each of the merged micrographs shown here represent a different stage of viral infection. Purple arrow—virus attachment to the host’s cell surface. White arrows—advanced infections with “halo” signals. Orange arrows—cell burst, and release of free virions, according to Rahlff et al. 2021 [8]). Scale bars: 1 µm. The number of initial infections were corrected (indicated by an asterisk) by a factor of ~6.7 (100% detection efficiency/15% calculated detection efficiency of direct-geneFISH), but not the number of advanced and lysing infections, which are expected to have more than ten viral genome copies per cell. For details on infection frequency please see next paragraph in the main text. (B) The distribution of virus-host ratios across biofilm samples was determined using: (i) metagenomic read-mapping (data from Probst et al. 2013 [16] and Rahlff et al. 2021 [8]) on samples from 2012 and 2018; (ii) qPCR on ten individual biofilm flocks from 2022; and, (iii) the results obtained by virusFISH from 2019, 2020, 2021, and 2022 (data corresponds to panel (A)). The Kruskal-Wallis and post-hoc Dunn’s test were used to compare the virus-host ratios across qPCR and virusFISH datasets. Highly significant differences between populations are indicated with asterisks (p ≤ 0.01). For details, please see Table S9. Different colors indicate different years or methods.
Figure 2
Figure 2
Determination of the detection efficiency of direct-geneFISH by using different probe sets targeting the genome of Ca. A. hamiconexum. (A) Three probe sets (probe set 1, 2 and 3 consisting of eleven probes each, Table S3) were designed based on the Ca. A. hamiconexum genome (see methods for details). The sets were combined to create probe mixtures with 22 polynucleotides (probe set 1 + 2, 2 + 3 and 3 + 1) and a probe set with 33 polynucleotides in total (1 + 2 + 3). For each probe set (1, 2, and 3) and probe set combination (1 + 2, 2 + 3, 3 + 1, 1 + 2 + 3), five biofilm flocks were used (n = 35). The different amounts of polynucleotides in a mixture were positively correlated with the detection efficiency (R2 = 0.992, linear regression analysis). (B) Illustration of the detection efficiency in a bee swarm plot. The detection efficiency increases with increasing number of polynucleotides in a probe mixture (raw data can be found in Tables S5 and S6). (C) Visualization of the different detection efficiencies using fluorescence micrographs according to Figure 1. Biofilms were visualized by using three different fluorescent channels that were merged together: DAPI (blue, archaeal cells), ATTO 488 (purple, SMArch714, 16S rRNA signal), and Alexa 594 (yellow, probes targeting the Ca. A. hamiconexum genome). Scale bars: 5 µm. For unmerged imaging data see Supplementary Material (Figures S3–S5). Raw image data available through FigShare. Scale bar 5 µm.
Figure 3
Figure 3
VirusFISH shows how infections of Altiarchaeota with Altivir_1_MSI in biofilms could progress over time. Here independent biofilm flocks with different infections frequencies are depicted. Infection frequencies are based on viral abundances derived from all infection categories (1–3). (A) Biofilms show no to very few viral infections (low infection frequency). (B) The infection frequency increases. (C) The vast majority of host cells are infected. (D) Lysis of Ca. A hamiconexum cells appears to promote the enrichment of filamentous microbes along with cell debris. White arrows indicate filamentous microbes. Micrographs were taken according to Figure 1 and raw data is available under FigShare. For unmerged imaging data see Supplementary Material (Figures S6–SS9). Scale bar: 10 µm.
Figure 4
Figure 4
Quantification of microbes and bacterial community composition of ten individual biofilm flocks from MSI sampled in 2022. (A) qPCR data targeting archaea, bacteria, and Altivir_1_MSI of ten individual MSI biofilm flocks. For raw data please see Table S12. (B) Community heatmap depicting the relative abundance (%) of the bacterial taxa at the genus level based on 16S rRNA gene information derived from individual MSI biofilm flocks.

References

    1. Suttle C.A. Marine Viruses—Major Players in the Global Ecosystem. Nat. Rev. Microbiol. 2007;5:801–812. doi: 10.1038/nrmicro1750. - DOI - PubMed
    1. Proctor L., Fuhrman J. Mortality of Marine Bacteria in Response to Enrichments of the Virus Size Fraction from Seawater. Mar. Ecol. Prog. Ser. 1992;87:283–293. doi: 10.3354/meps087283. - DOI
    1. Fuhrman J.A. Marine Viruses and Their Biogeochemical and Ecological Effects. Nature. 1999;399:541–548. doi: 10.1038/21119. - DOI - PubMed
    1. Howard-Varona C., Hargreaves K.R., Abedon S.T., Sullivan M.B. Lysogeny in Nature: Mechanisms, Impact and Ecology of Temperate Phages. ISME J. 2017;11:1511–1520. doi: 10.1038/ismej.2017.16. - DOI - PMC - PubMed
    1. Anderson R.E., Brazelton W.J., Baross J.A. Is the Genetic Landscape of the Deep Subsurface Biosphere Affected by Viruses? Front. Microbiol. 2011;2:219. doi: 10.3389/fmicb.2011.00219. - DOI - PMC - PubMed

Publication types

Substances

LinkOut - more resources