

Dynamics of SARS-CoV-2 Antibody Responses up to 9 Months Post-Vaccination in Individuals with Previous SARS-CoV-2 Infection Receiving Inactivated Vaccines
- PMID: 37112897
- PMCID: PMC10145073
- DOI: 10.3390/v15040917
Dynamics of SARS-CoV-2 Antibody Responses up to 9 Months Post-Vaccination in Individuals with Previous SARS-CoV-2 Infection Receiving Inactivated Vaccines
Abstract
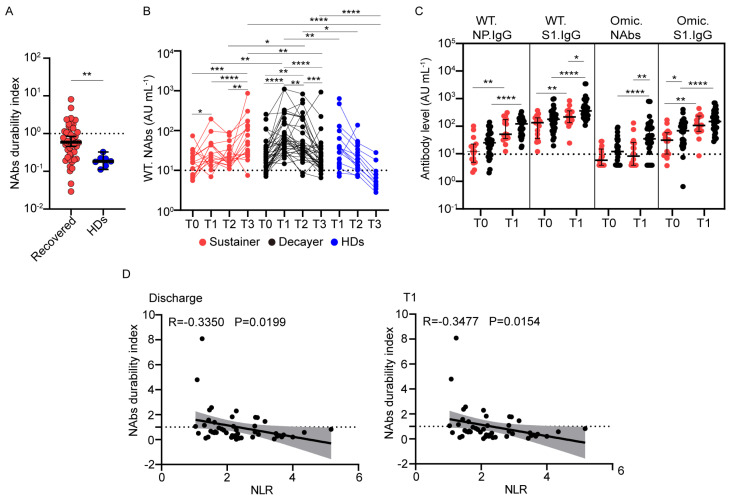
Humoral immunity confers protection against COVID-19. The longevity of antibody responses after receiving an inactivated vaccine in individuals with previous SARS-CoV-2 infection is unclear. Plasma samples were collected from 58 individuals with previous SARS-CoV-2 infection and 25 healthy donors (HDs) who had been vaccinated with an inactivated vaccine. The neutralizing antibodies (NAbs) and S1 domain-specific antibodies against the SARS-CoV-2 wild-type and Omicron strains and nucleoside protein (NP)-specific antibodies were measured using a chemiluminescent immunoassay. Statistical analysis was performed using clinical variables and antibodies at different timepoints after SARS-CoV-2 vaccination. NAbs targeting the wild-type or Omicron strain were detected in individuals with previous SARS-CoV-2 infection at 12 months after infection (wild-type: 81%, geometric mean (GM): 20.3 AU/mL; Omicron: 44%, GM: 9.4 AU/mL), and vaccination provided further enhancement of these antibody levels (wild-type: 98%, GM: 53.3 AU/mL; Omicron: 75%, GM: 27.8 AU/mL, at 3 months after vaccination), which were significantly higher than those in HDs receiving a third dose of inactivated vaccine (wild-type: 85%, GM: 33.6 AU/mL; Omicron: 45%, GM: 11.5 AU/mL). The level of NAbs in individuals with previous infection plateaued 6 months after vaccination, but the NAb levels in HDs declined continuously. NAb levels in individuals with previous infection at 3 months post-vaccination were strongly correlated with those at 6 months post-vaccination, and weakly correlated with those before vaccination. NAb levels declined substantially in most individuals, and the rate of antibody decay was negatively correlated with the neutrophil-to-lymphocyte ratio in the blood at discharge. These results suggest that the inactivated vaccine induced robust and durable NAb responses in individuals with previous infection up to 9 months after vaccination.
Keywords: COVID-19 convalescent; Omicron variant; SARS-CoV-2; inactivated vaccine; longitudinal study; neutralizing antibodies.
Conflict of interest statement
The authors declare no conflict of interest.
Figures


Similar articles
-
Pediatric population (aged 3-11 years) received primary inactivated SARS-CoV-2 vaccination prior to infection exhibiting robust humoral immune response following infected with Omicron variant: a study conducted in Beijing.Front Immunol. 2023 Sep 27;14:1269665. doi: 10.3389/fimmu.2023.1269665. eCollection 2023. Front Immunol. 2023. PMID: 37828994 Free PMC article.
-
Efficacy of the neutralizing antibodies after the booster dose on SARS-CoV-2 Omicron variant and a two-year longitudinal antibody study on Wild Type convalescents.Int Immunopharmacol. 2023 Jun;119:110151. doi: 10.1016/j.intimp.2023.110151. Epub 2023 Apr 5. Int Immunopharmacol. 2023. PMID: 37044040 Free PMC article.
-
Kinetics of SARS-CoV-2 neutralizing antibodies in Omicron breakthrough cases with inactivated vaccination: Role in inferring the history and duration of infection.Front Immunol. 2023 Jan 24;14:1083523. doi: 10.3389/fimmu.2023.1083523. eCollection 2023. Front Immunol. 2023. PMID: 36761738 Free PMC article.
-
B-cell and antibody responses to SARS-CoV-2: infection, vaccination, and hybrid immunity.Cell Mol Immunol. 2024 Feb;21(2):144-158. doi: 10.1038/s41423-023-01095-w. Epub 2023 Nov 10. Cell Mol Immunol. 2024. PMID: 37945737 Free PMC article. Review.
-
Protective roles and protective mechanisms of neutralizing antibodies against SARS-CoV-2 infection and their potential clinical implications.Front Immunol. 2023 Jan 19;14:1055457. doi: 10.3389/fimmu.2023.1055457. eCollection 2023. Front Immunol. 2023. PMID: 36742320 Free PMC article. Review.
Cited by
-
Sustained spike-specific IgG antibodies following CoronaVac (Sinovac) vaccination in sub-Saharan Africa, but increased breakthrough infections in baseline spike-naive individuals.Front Immunol. 2023 Nov 30;14:1255676. doi: 10.3389/fimmu.2023.1255676. eCollection 2023. Front Immunol. 2023. PMID: 38098482 Free PMC article.
-
Evaluation of COVID-19 Booster Vaccine Effectiveness.Viruses. 2025 Jan 26;17(2):179. doi: 10.3390/v17020179. Viruses. 2025. PMID: 40006934 Free PMC article.
-
Differential immunogenicity in people living with HIV with varying CD4 levels after bivalent mRNA COVID-19 booster vaccination.PLoS One. 2025 Apr 29;20(4):e0317940. doi: 10.1371/journal.pone.0317940. eCollection 2025. PLoS One. 2025. PMID: 40299994 Free PMC article.
-
T-Cell Epitope Mapping of SARS-CoV-2 Reveals Coordinated IFN-γ Production and Clonal Expansion of T Cells Facilitates Recovery from COVID-19.Viruses. 2024 Jun 22;16(7):1006. doi: 10.3390/v16071006. Viruses. 2024. PMID: 39066169 Free PMC article.
-
Anti-SARS-CoV-2 antibody dynamics after primary vaccination with two-dose inactivated whole-virus vaccine, heterologous mRNA-1273 vaccine booster, and Omicron breakthrough infection in Indonesian health care workers.BMC Infect Dis. 2024 Aug 1;24(1):768. doi: 10.1186/s12879-024-09644-y. BMC Infect Dis. 2024. PMID: 39090537 Free PMC article.
References
-
- World Health Organization WHO Coronavirus Disease (COVID-19) Dashboard. 2023. [(accessed on 10 February 2023)]. Available online: https://covid19.who.int/
-
- Lai A., Bergna A., Della Ventura C., Menzo S., Bruzzone B., Sagradi F., Ceccherini-Silberstein F., Weisz A., Clementi N., Brindicci G., et al. Epidemiological and Clinical Features of SARS-CoV-2 Variants Circulating between April–December 2021 in Italy. Viruses. 2022;14:2508. doi: 10.3390/v14112508. - DOI - PMC - PubMed
Publication types
MeSH terms
Substances
LinkOut - more resources
Full Text Sources
Medical
Miscellaneous
