. 2023 Apr 18;15(4):996.
doi: 10.3390/v15040996.

Cellular Immune Responses to SARS-CoV-2 in Exposed Seronegative Individuals

Affiliations

Cellular Immune Responses to SARS-CoV-2 in Exposed Seronegative Individuals

Natasha J Norton et al. Viruses. .

Abstract

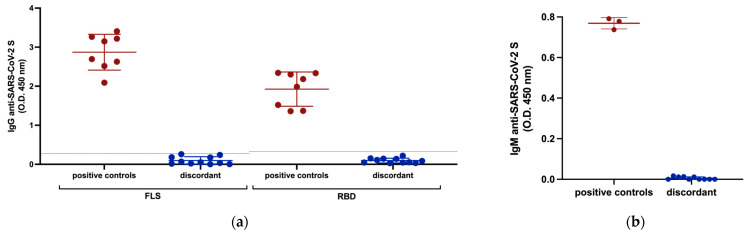
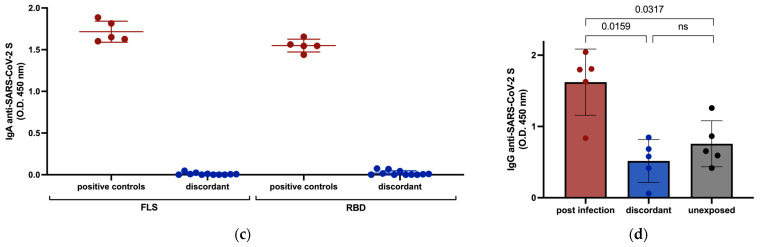
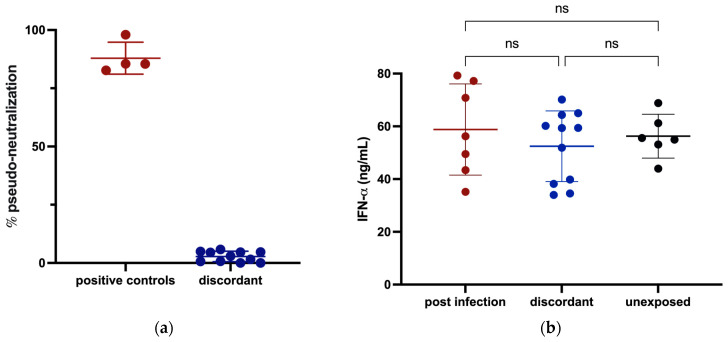
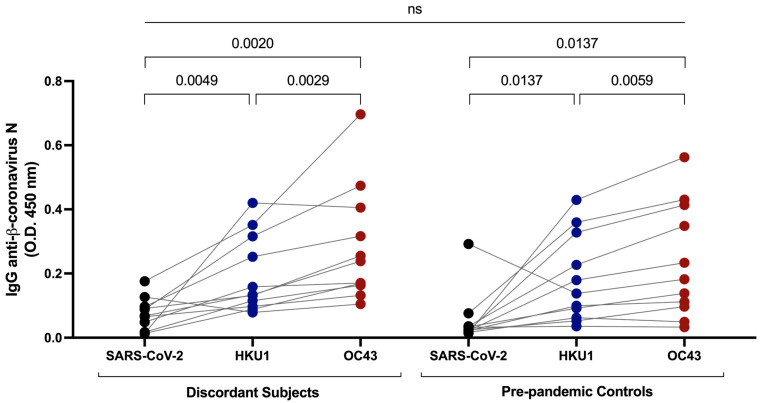
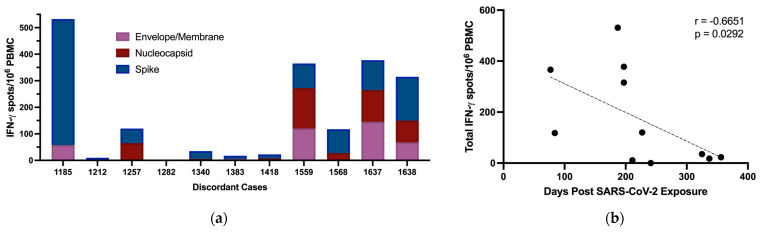
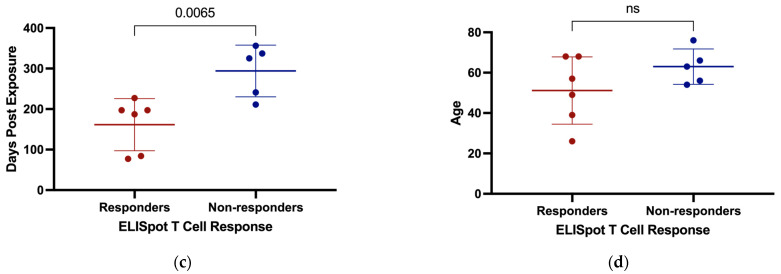
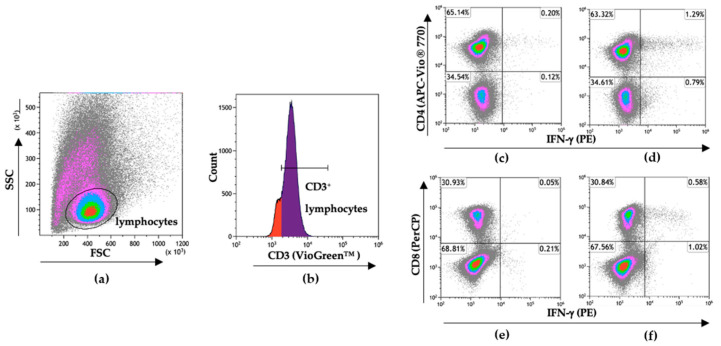
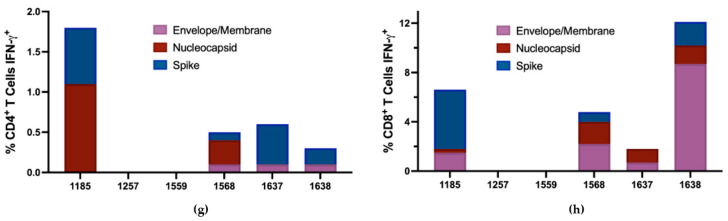
Some SARS-CoV-2-exposed individuals develop immunity without overt infection. We identified 11 individuals who were negative by nucleic acid testing during prolonged close contact and with no serological diagnosis of infection. As this could reflect natural immunity, cross-reactive immunity from previous coronavirus exposure, abortive infection due to de novo immune responses, or other factors, our objective was to characterize immunity against SARS-CoV-2 in these individuals. Blood was processed into plasma and peripheral blood mononuclear cells (PBMC) and screened for IgG, IgA, and IgM antibodies (Ab) against SARS-CoV-2 and common β-coronaviruses OC43 and HKU1. Receptor blocking activity and interferon-alpha (IFN-α) in plasma were also measured. Circulating T cells against SARS-CoV-2 were enumerated and CD4+ and CD8+ T cell responses discriminated after in vitro stimulation. Exposed uninfected individuals were seronegative against SARS-CoV-2 spike (S) and selectively reactive against OC43 nucleocapsid protein (N), suggesting common β-coronavirus exposure induced Ab cross-reactive against SARS-CoV-2 N. There was no evidence of protection from circulating angiotensin-converting enzyme (ACE2) or IFN-α. Six individuals had T cell responses against SARS-CoV-2, with four involving CD4+ and CD8+ T cells. We found no evidence of protection from SARS-CoV-2 through innate immunity or immunity induced by common β-coronaviruses. Cellular immune responses against SARS-CoV-2 were associated with time since exposure, suggesting that rapid cellular responses may contain SARS-CoV-2 infection below the thresholds required for a humoral response.

Keywords: HKU1; OC43; SARS-CoV-2; cellular immunity; cross-reactivity; exposed uninfected.


Conflict of interest statement

The authors declare that no conflict of interest exists in relation to this study. The funders had no role in the design of this study; in the collection, analyses, or interpretation of data; in the writing of the manuscript; or in the decision to publish the results.

Figures

Figure 1
Figure 1
Serological responses of discordant case subjects against SARS-CoV-2 S measured by ELISA. (a) IgG antibody responses to SARS-CoV-2 FLS and RBD with plasma samples from previously infected subjects included as positive controls. The horizontal lines represent cut-off values for seropositivity established as 2 SD above the mean OD of control samples collected before October 2019. (b) IgM antibody response of discordant subjects with plasma samples from previously infected subjects included as positive controls against SARS-CoV-2 FLS. (c) IgA antibody response of discordant subjects with plasma samples from previously infected subjects included as positive controls against SARS-CoV-2 FLS and RBD. (d) Comparison of IgG antibody responses against SARS-CoV-2 FLS protein following one dose of BNT162b2 mRNA vaccination between previously infected, non-exposed, and 5 discordant individuals (1185, 1340, 1383, 1418, 1637) for whom post-vaccine 1 samples were available. Red and blue shading of dots and bars represents positive controls and discordant case subjects respectively. Black dots and the gray shaded bar represent previously unexposed subjects. The probability of a significant difference between groups was calculated using the Mann–Whitney test, with p values or ns (not significant) shown above lines spanning the groups compared.
Figure 1
Figure 1
Serological responses of discordant case subjects against SARS-CoV-2 S measured by ELISA. (a) IgG antibody responses to SARS-CoV-2 FLS and RBD with plasma samples from previously infected subjects included as positive controls. The horizontal lines represent cut-off values for seropositivity established as 2 SD above the mean OD of control samples collected before October 2019. (b) IgM antibody response of discordant subjects with plasma samples from previously infected subjects included as positive controls against SARS-CoV-2 FLS. (c) IgA antibody response of discordant subjects with plasma samples from previously infected subjects included as positive controls against SARS-CoV-2 FLS and RBD. (d) Comparison of IgG antibody responses against SARS-CoV-2 FLS protein following one dose of BNT162b2 mRNA vaccination between previously infected, non-exposed, and 5 discordant individuals (1185, 1340, 1383, 1418, 1637) for whom post-vaccine 1 samples were available. Red and blue shading of dots and bars represents positive controls and discordant case subjects respectively. Black dots and the gray shaded bar represent previously unexposed subjects. The probability of a significant difference between groups was calculated using the Mann–Whitney test, with p values or ns (not significant) shown above lines spanning the groups compared.
Figure 2
Figure 2
Assessment of potential for innate protection against SARS-CoV-2 infection measured by ELISA. (a) The ability of plasma from discordant subjects to inhibit the SARS-CoV-2 S interaction with ACE2 was tested with plasma from previously infected subjects included as positive controls. (b) Circulating IFN-α levels in plasma from discordant subjects and age- and sex-matched previously infected and unexposed individuals were measured and compared. Red, blue and black shading of dots represents positive controls, discordant case subjects and unexposed subjects respectively. The probability of a significant difference between groups was calculated using the Mann–Whitney test, with ns (not significant) shown above lines spanning the groups compared.
Figure 3
Figure 3
Measurement of cross-reactive antibodies against SARS-CoV-2 and common β-coronavirus N proteins by ELISA. IgG anti-β-coronavirus N antibodies against SARS-CoV-2, HKU1, and OC43 in plasma samples from the discordant cases were measured and compared to pre-pandemic plasma samples from age- and sex-matched controls. Black, blue and red shaded dots represent the IgG response against SARS-CoV-2, HKU1 and OC43 N proteins respectively. The probability of a significant difference between groups was calculated by Mann–Whitney test and responses to different N proteins compared by Wilcoxon signed rank test, with p values above lines spanning the groups compared. There was no significant difference between the discordant and pre-pandemic samples.
Figure 4
Figure 4
Production of IFN-γ by PBMC from discordant case subjects following stimulation with SARS-CoV-2 protein overlapping peptide pools. (a) IFN-γ producing T cells/106 PBMC of discordant case subjects following 24 h stimulation with SARS-CoV-2 E/M, N, and S protein peptide pools. (b) Scatterplot with line of best fit showing the relationship between total IFN-γ producing T cells detected by ELISpot following stimulation and the number of days post exposure. Spearman correlations were computed to assess the significance of correlations, with the correlation coefficient (r) and p value shown within the graph plot. (c) Days post exposure and (d) age were compared between responders and non-responders on ELISpot. Red and blue shading of dots represents SARS-CoV-2 responders and non-responders respectively as defined by ELISPOT testing. The probability of a significant difference between groups was calculated using the Mann–Whitney test, with p values and ns (not significant) shown above lines spanning the groups compared.
Figure 4
Figure 4
Production of IFN-γ by PBMC from discordant case subjects following stimulation with SARS-CoV-2 protein overlapping peptide pools. (a) IFN-γ producing T cells/106 PBMC of discordant case subjects following 24 h stimulation with SARS-CoV-2 E/M, N, and S protein peptide pools. (b) Scatterplot with line of best fit showing the relationship between total IFN-γ producing T cells detected by ELISpot following stimulation and the number of days post exposure. Spearman correlations were computed to assess the significance of correlations, with the correlation coefficient (r) and p value shown within the graph plot. (c) Days post exposure and (d) age were compared between responders and non-responders on ELISpot. Red and blue shading of dots represents SARS-CoV-2 responders and non-responders respectively as defined by ELISPOT testing. The probability of a significant difference between groups was calculated using the Mann–Whitney test, with p values and ns (not significant) shown above lines spanning the groups compared.
Figure 5
Figure 5
Flow cytometry gating strategy to discriminate SARS-CoV-2-specific CD4+ and CD8+ T cell responses. Following 7-day stimulation, cells were stained for extracellular CD3, CD4, and CD8 to discriminate T cell populations and for intracellular IFN-γ to identify SARS-CoV-2-specific T cells. (a) Gating on lymphocytes following 7-day in vitro stimulation. (b) Gating on CD3+ lymphocytes. (c) Non-restimulated CD4+IFN-γ+ cells and (d) CD4+ IFN-γ+ cells after 5 h stimulation with SARS-CoV-2 N protein peptide pool. (e) Non-restimulated CD8+IFN-γ+ cells and (f) CD8+IFN-γ+ cells after 5 h stimulation with SARS-CoV-2 S protein peptide pool. Data were analyzed and visualized using Kaluza Version 2.1 (Beckman Coulter). Total percentages of the (g) CD4+ and (h) CD8+ T cell populations responding to SARS-CoV-2 protein peptide pools with IFN-γ production after 7-day in vitro stimulation.
Figure 5
Figure 5
Flow cytometry gating strategy to discriminate SARS-CoV-2-specific CD4+ and CD8+ T cell responses. Following 7-day stimulation, cells were stained for extracellular CD3, CD4, and CD8 to discriminate T cell populations and for intracellular IFN-γ to identify SARS-CoV-2-specific T cells. (a) Gating on lymphocytes following 7-day in vitro stimulation. (b) Gating on CD3+ lymphocytes. (c) Non-restimulated CD4+IFN-γ+ cells and (d) CD4+ IFN-γ+ cells after 5 h stimulation with SARS-CoV-2 N protein peptide pool. (e) Non-restimulated CD8+IFN-γ+ cells and (f) CD8+IFN-γ+ cells after 5 h stimulation with SARS-CoV-2 S protein peptide pool. Data were analyzed and visualized using Kaluza Version 2.1 (Beckman Coulter). Total percentages of the (g) CD4+ and (h) CD8+ T cell populations responding to SARS-CoV-2 protein peptide pools with IFN-γ production after 7-day in vitro stimulation.

Similar articles

Cited by

References

    1. Swadling L., Diniz M.O., Schmidt N.M., Amin O.E., Chandran A., Shaw E., Pade C., Gibbons J.M., le Bert N., Tan A.T., et al. Pre-existing polymerase-specific T cells expand in abortive seronegative SARS-CoV-2. Nature. 2021;601:110–117. doi: 10.1038/s41586-021-04186-8. - DOI - PMC - PubMed
    1. Thurairajah P.H., Hegazy D., Chokshi S., Shaw S., Demaine A., Kaminski E.R., Naoumov N.V., Cramp M.E. Hepatitis C virus (HCV)-Specific T cell responses in injection drug users with apparent resistance to HCV infection. J. Infect. Dis. 2008;198:1749–1755. doi: 10.1086/593337. - DOI - PubMed
    1. Heller T., Werner J.M., Rahman F., Mizukoshi E., Sobao Y., Gordon A.M., Sheets A., Sherker A.H., Kessler E., Bean K.S., et al. Occupational exposure to hepatitis C virus: Early T-cell responses in the absence of seroconversion in a longitudinal cohort study. J. Infect. Dis. 2013;208:1020–1025. doi: 10.1093/infdis/jit270. - DOI - PMC - PubMed
    1. Mateus J., Grifoni A., Tarke A., Sidney J., Ramirez S.I., Dan J.M., Burger Z.C., Rawlings S.A., Smith D.M., Phillips E., et al. Selective and cross-reactive SARS-CoV-2 T cell epitopes in unexposed humans. Science. 2020;370:89–94. doi: 10.1126/science.abd3871. - DOI - PMC - PubMed
    1. Lee C.H., Pinho M.P., Buckley P.R., Woodhouse I.B., Ogg G., Simmons A., Napolitani G., Koohy H. Potential CD8+ T Cell Cross-Reactivity against SARS-CoV-2 Conferred by Other Coronavirus Strains. Front. Immunol. 2020;11:579480. doi: 10.3389/fimmu.2020.579480. - DOI - PMC - PubMed

Publication types

Grants and funding