. 2023 Apr 19;15(4):1003.
doi: 10.3390/v15041003.

Stabilization of the Quadruplex-Forming G-Rich Sequences in the Rhinovirus Genome Inhibits Uncoating-Role of Na+ and K

Affiliations

Stabilization of the Quadruplex-Forming G-Rich Sequences in the Rhinovirus Genome Inhibits Uncoating-Role of Na+ and K

Antonio Real-Hohn et al. Viruses. .

Abstract

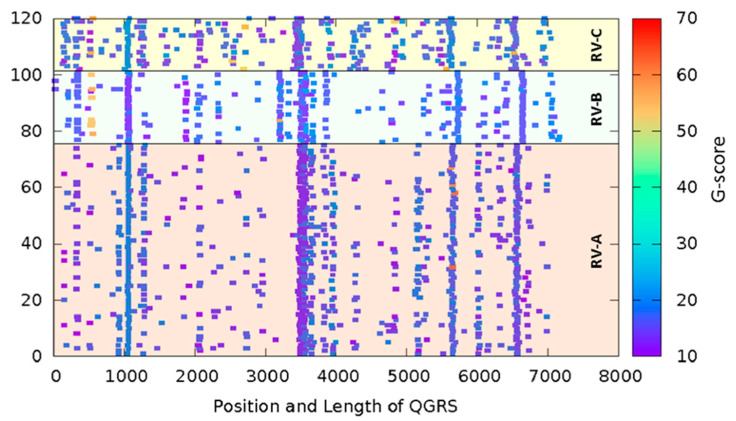
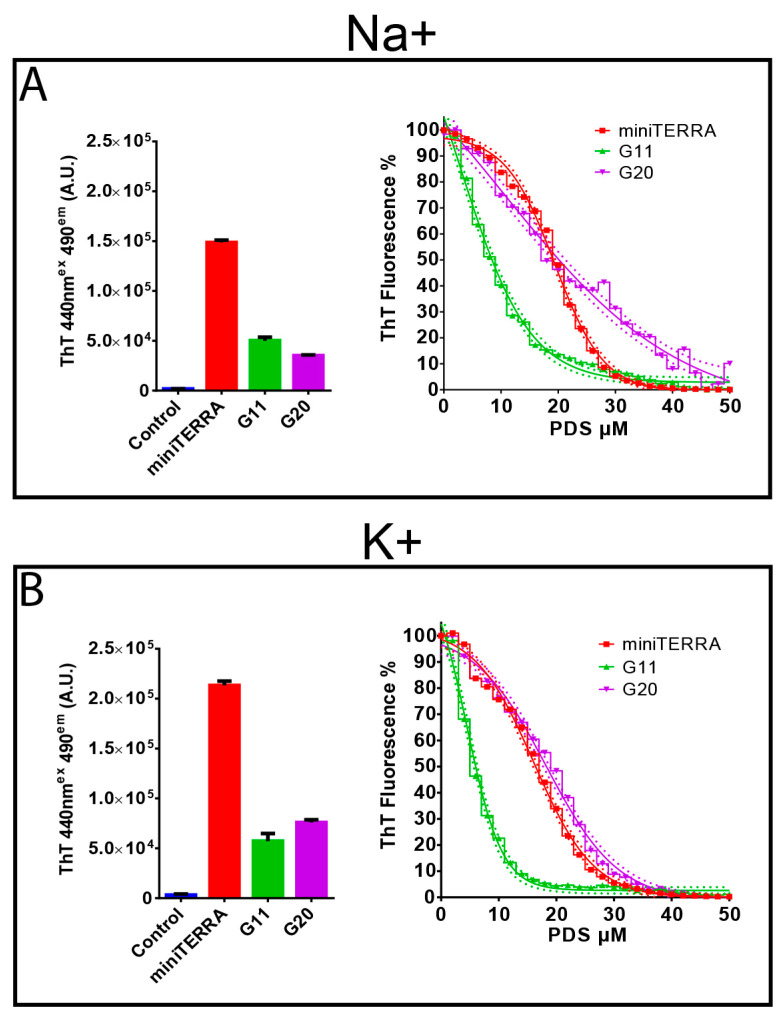
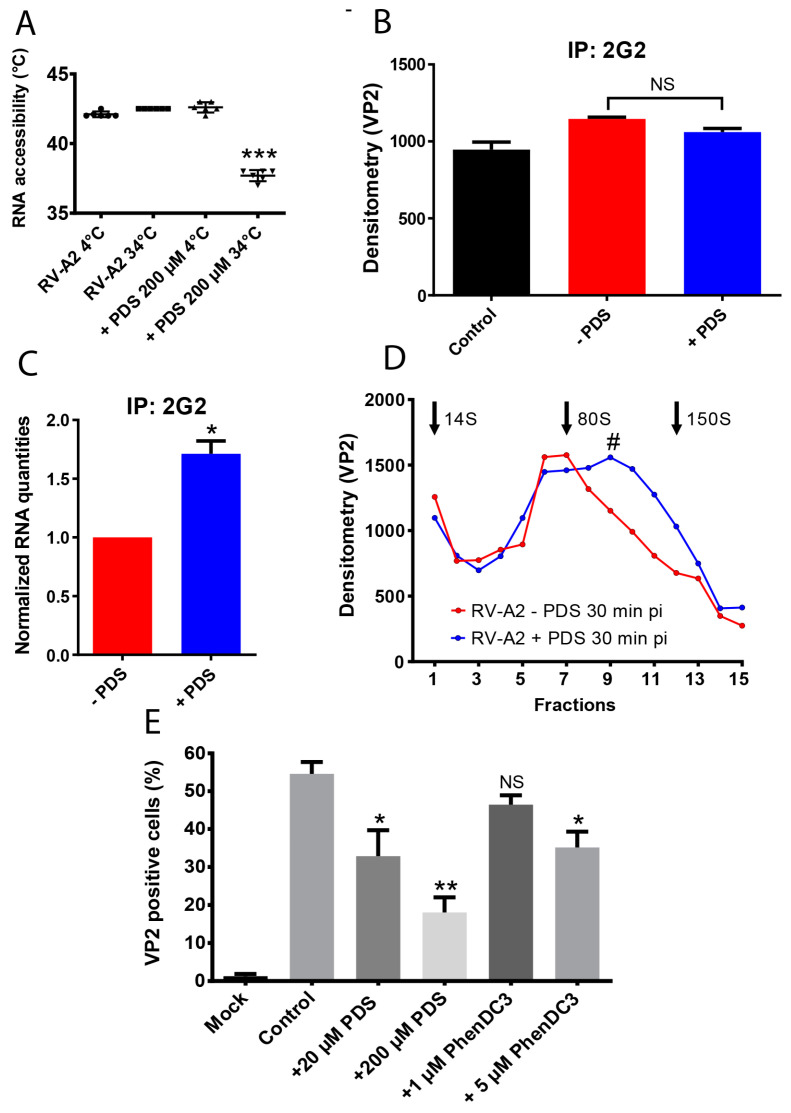
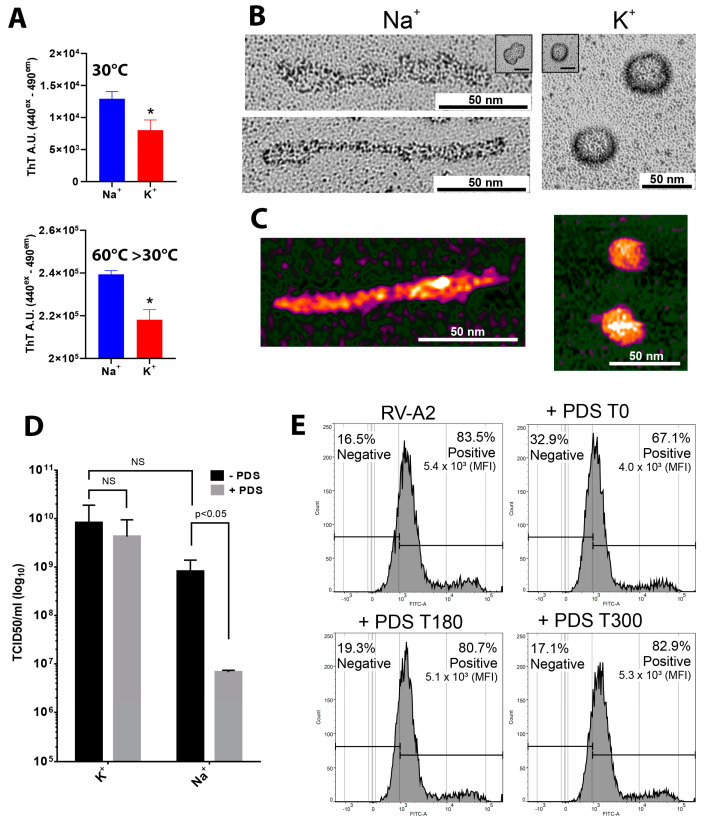
Rhinoviruses (RVs) are the major cause of common cold, a respiratory disease that generally takes a mild course. However, occasionally, RV infection can lead to serious complications in patients debilitated by other ailments, e.g., asthma. Colds are a huge socioeconomic burden as neither vaccines nor other treatments are available. The many existing drug candidates either stabilize the capsid or inhibit the viral RNA polymerase, the viral proteinases, or the functions of other non-structural viral proteins; however, none has been approved by the FDA. Focusing on the genomic RNA as a possible target for antivirals, we asked whether stabilizing RNA secondary structures might inhibit the viral replication cycle. These secondary structures include G-quadruplexes (GQs), which are guanine-rich sequence stretches forming planar guanine tetrads via Hoogsteen base pairing with two or more of them stacking on top of each other; a number of small molecular drug candidates increase the energy required for their unfolding. The propensity of G-quadruplex formation can be predicted with bioinformatics tools and is expressed as a GQ score. Synthetic RNA oligonucleotides derived from the RV-A2 genome with sequences corresponding to the highest and lowest GQ scores indeed exhibited characteristics of GQs. In vivo, the GQ-stabilizing compounds, pyridostatin and PhenDC3, interfered with viral uncoating in Na+ but not in K+-containing phosphate buffers. The thermostability studies and ultrastructural imaging of protein-free viral RNA cores suggest that Na+ keeps the encapsulated genome more open, allowing PDS and PhenDC3 to diffuse into the quasi-crystalline RNA and promote the formation and/or stabilization of GQs; the resulting conformational changes impair RNA unraveling and release from the virion. Preliminary reports have been published.

Keywords: G-quadruplex; K+; Na+; PhenDC3; RNA; folding; inhibition; picornavirus; pyridostatin; rhinovirus.


Conflict of interest statement

The authors declare no conflict of interest.

Figures

Figure 1
Figure 1
All RV genomes harbor conserved sequences with propensity to form GQs. Complete RNA sequences of 120 RVs available in the NCBI database were analyzed for putative GQ-forming sequences using the QGRS mapper software. G-scores ≥ 10 are shown as rectangles with their lengths corresponding to the number of bases making up the putative GQ. The color bar indicates the respective G-scores. Note that the sequences were used without alignment optimization, i.e., neither deletions nor insertions were taken into account. Also, note the four vertical lines indicating strong conservation. Species RV-A, RV-B, and RV-C are indicated.
Figure 2
Figure 2
Impact of Na+ and K+ on ThT binding and ThT displacement by PDS. Ribooligonucleotides dissolved at 5 µM in 100 mM Na+ (A) or K+ (B) phosphate buffer (both at pH 7.4) as indicated, were incubated with ThT, and the fluorescence was measured at 490 nm (n = 3; left panel). Right panels; as above, but fluorescence was measured in the presence of increasing concentrations of PDS added in steps. Values are normalized to the initial fluorescence signal (i.e., without PDS = 100%; n = 3).
Figure 3
Figure 3
GQ-binding compounds decrease the temperature of RV-A2 capsid permeability onset, impair uncoating, and decrease infectivity. (A) Scatter plot of the temperature of onset (Ton) of capsid permeability (i.e., RNA accessibility for SYTO 82) determined by PaSTRy with purified RV-A2 that had been pre-incubated +/−200 µM PDS at 34 °C for 4 h. ‘***’, note the strong reduction in the temperature of RNA accessibility-onset upon pretreatment with 200 µM PDS at 34 °C. (B,C) HeLa cells were infected with purified RV-A2 pre-incubated +/−PDS as in (A). Subviral A- and B-particles were immunoprecipitated with mAb-2G2. (B) Viral protein was quantified by using mAb 8F5 and a goat anti-mouse IgG HRP-conjugated secondary antibody, followed by measuring VP2 by densitometry. (C) RV-A2 RNA levels were quantified by qPCR and normalized relative to a known amount of AiV seed virus spiked into samples prior to RNA isolation. (D) Cleared supernatants prepared as above were separated by 10–40% (w/v) sucrose density gradient ultra-centrifugation. Dot blots were prepared from each fraction, and VP2-containing viral material was quantified with mAb 8F5 and IRDye 680RD goat anti-mouse IgG secondary antibodies (n = 3). The obtained signal intensity was plotted against fractions from top to bottom. Note that VP2 is present in all viral and subviral particles. Native virus (150S) and subviral B-particles (80S) were used as sedimentation controls and run on separate gradients. Their positions are indicated in the plot; the position of 14S pentamers was inferred from the literature. ‘#’ indicates the approximate position of 135S A particles (E) Purified RV-A2 was incubated with +/−PDS or PhenDC3 at the concentrations indicated for 4 h at 34 °C. Free compounds were removed by centrifugal ultrafiltration, and the retained material was used to infect HeLa cells. The percentage of infected cells was determined at 9 h pi by FACS analysis of the intracellularly produced VP2 with mAb 8F5 and an anti-mouse AlexaFluor 488 conjugated secondary antibody and is indicated as bars (n = 3; * p ≤ 0.05; ** p ≤ 0.01).
Figure 4
Figure 4
PDS treatment of protein-free RNA cores results in a drastic reorganization in the Na+ but not the K+ phosphate buffer. (A) The RV-A2 capsid proteins were digested via gentle proteolysis in 100 mM Na+ phosphate buffer or 100 mM K+ phosphate buffer, as indicated. The protein-free RNA cores were then mixed with ThT (final concentration of 5 µM), and the ThT fluorescence signal was acquired at 30 °C. (B) RV-A2 RNA (prepared as in (A)) was incubated with 20 µM PDS for 10 min at room temperature and subjected to rotary shadowing followed by TEM. Insets depicting representative images of non-PDS-treated ex-virion RNA in Na+ or K+ phosphate buffers are displayed. (C) Samples similarly treated as in (B) were analyzed by AFM in the presence of 100 mM Na+ or K+ phosphate buffer. (D) Purified RV-A2 was diluted in the above buffers and incubated overnight with or without 20 µM PDS at room temperature. After ultrafiltration, the infectivity of the respective retentates was determined by end-point titration. Viral titer is expressed as TCID50 in the bar graph (n = 3). The significance of the differences was evaluated by the two-way ANOVA; NS—statistically not significant (p ≥ 0.05). (E) HeLa cells were challenged with RV-A2 (MOI = 10) for 30 min at 4 °C, allowing virus attachment. A synchronized virus entry was triggered by a transfer to 34 °C. Immediately before (=0 min pi), 180 min, and 300 min pi after the temperature shift, the medium in the respective well was adjusted to 20 µM PDS, and incubation of cells continued for 9 h to allow for one cycle of infection. Non-infected cells without PDS treatment were used as controls. Cells were immunostained with mAb 8F5 and analyzed by flow cytometry. Non-infected and infected populations are displayed at the left and right, respectively, in the fluorescence intensity histogram, and the corresponding percentage is provided on top. MFI is the mean value of fluorescence intensity calculated for each sample. ‘*’ p ≤ 0.05.

Similar articles

Cited by

References

    1. Esneau C., Duff A.C., Bartlett N.W. Understanding Rhinovirus Circulation and Impact on Illness. Viruses. 2022;14:141. doi: 10.3390/v14010141. - DOI - PMC - PubMed
    1. Jacobs S.E., Lamson D.M., St George K., Walsh T.J. Human rhinoviruses. Clin. Microbiol. Rev. 2013;26:135–162. doi: 10.1128/CMR.00077-12. - DOI - PMC - PubMed
    1. Gern J.E., Busse W.W. Association of Rhinovirus Infections with Asthma. Clin. Microbiol. Rev. 1999;12:9–18. doi: 10.1128/CMR.12.1.9. - DOI - PMC - PubMed
    1. Tang J.W., Lam T.T., Zaraket H., Lipkin W.I., Drews S.J., Hatchette T.F., Heraud J.-M., Koopmans M.P., Abraham A.M., Baraket A., et al. Global epidemiology of non-influenza RNA respiratory viruses: Data gaps and a growing need for surveillance. Lancet Infect. Dis. 2017;17:e320–e326. doi: 10.1016/S1473-3099(17)30238-4. - DOI - PMC - PubMed
    1. Heikkinen T., Jarvinen A. The common cold. Lancet. 2003;361:51–59. doi: 10.1016/S0140-6736(03)12162-9. - DOI - PMC - PubMed

Publication types

LinkOut - more resources