. 2023 Apr 11:17:1047848.
doi: 10.3389/fnins.2023.1047848. eCollection 2023.

Steady electrocorticogram characteristics predict specific stress-induced behavioral phenotypes

Affiliations

Steady electrocorticogram characteristics predict specific stress-induced behavioral phenotypes

Laura Desnouveaux et al. Front Neurosci. .

Abstract

Introduction: Depending on the individual, exposure to an intense stressor may, or may not, lead to a stress-induced pathology. Predicting the physiopathological evolution in an individual is therefore an important challenge, at least for prevention. In this context, we developed an ethological model of simulated predator exposure in rats: we call this the multisensorial stress model (MSS). We hypothesized that: (i) MSS exposure can induce stress-induced phenotypes, and (ii) an electrocorticogram (ECoG) recorded before stress exposure can predict phenotypes observed after stress.

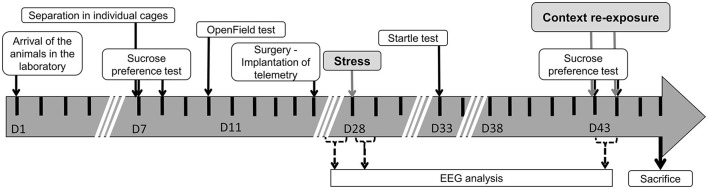
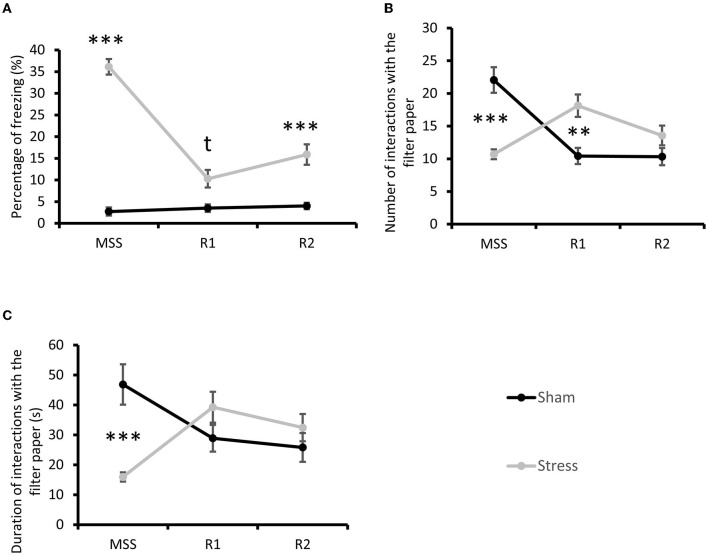
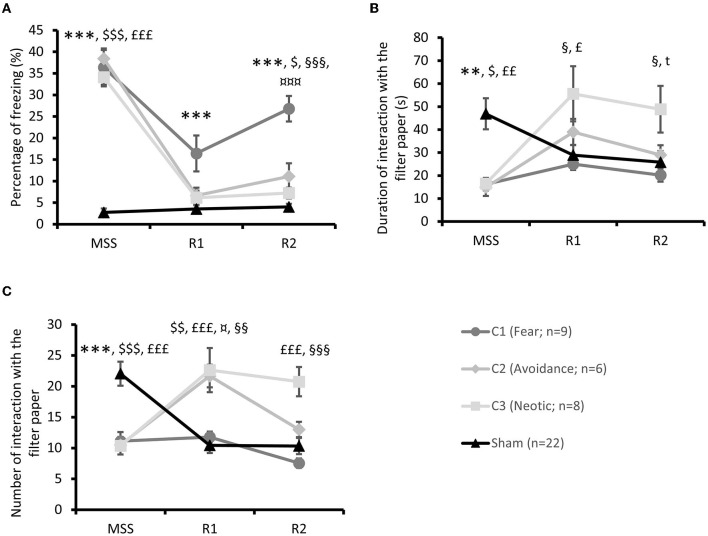
Methods: Forty-five Sprague Dawley rats were equipped with ECoG telemetry and divided into two groups. The Stress group (n = 23) was exposed to an MSS that combined synthetic fox feces odor deposited on filter paper, synthetic blood odor, and 22 kHz rodent distress calls; the Sham group (n = 22) was not exposed to any sensorial stimulus. Fifteen days after initial exposure, the two groups were re-exposed to a context that included a filter paper soaked with water as a traumatic object (TO) reminder. During this re-exposure, freezing behavior and avoidance of the filter paper were measured.

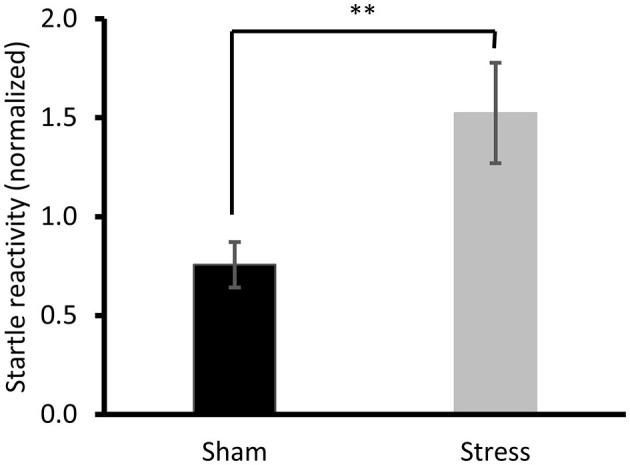
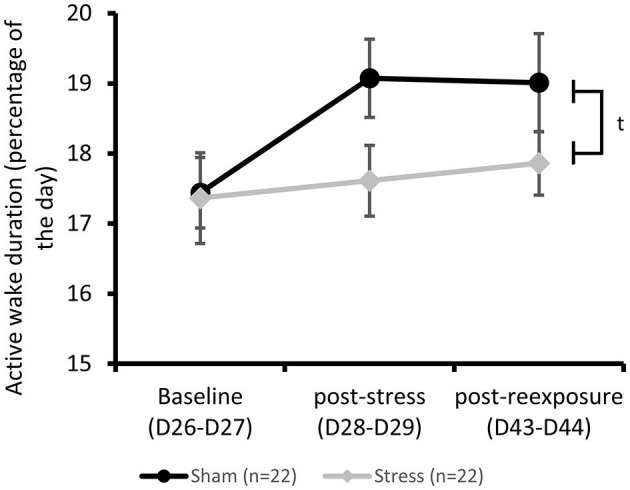
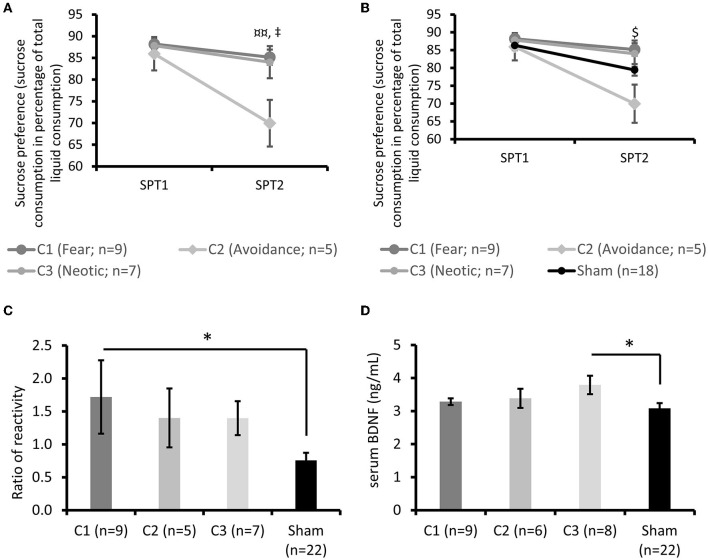
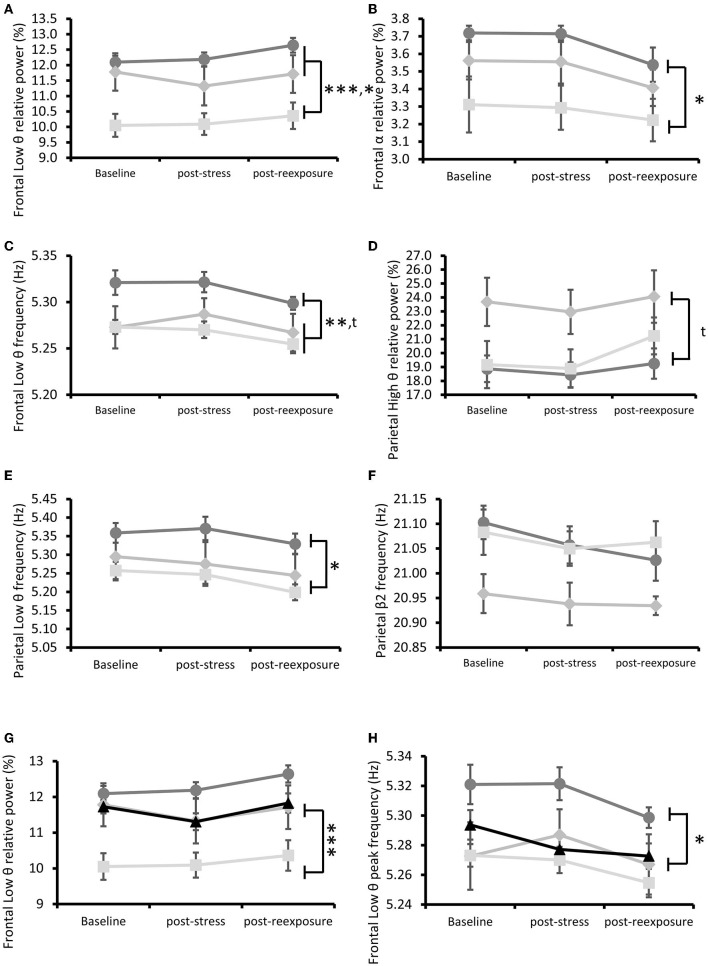
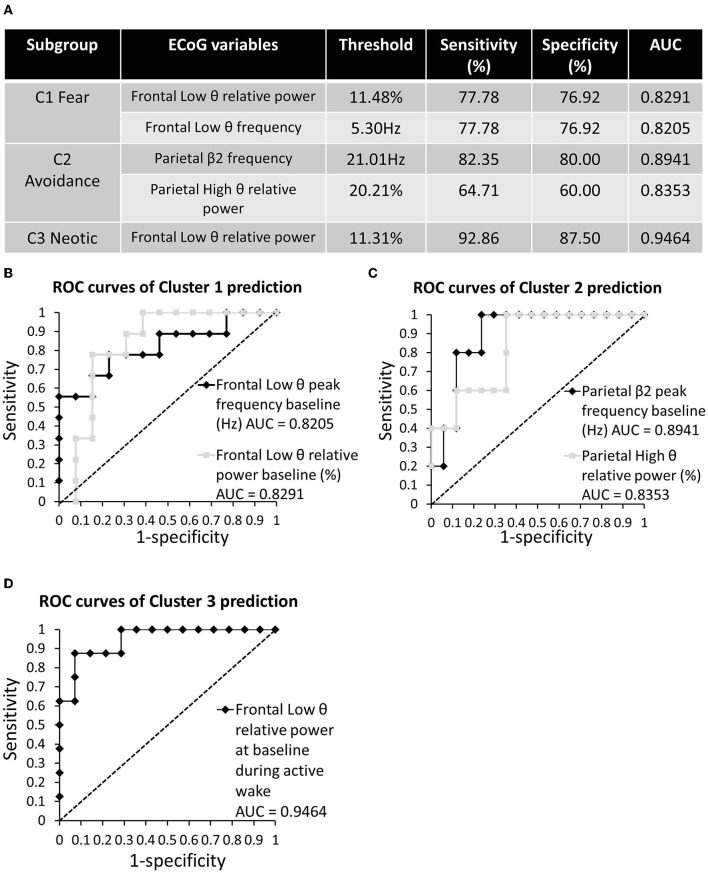
Results: Three behaviors were observed in the Stress group: 39% developed a fear memory phenotype (freezing, avoidance, and hyperreactivity); 26% developed avoidance and anhedonia; and 35% made a full recovery. We also identified pre-stress ECoG biomarkers that accurately predicted cluster membership. Decreased chronic 24 h frontal Low θ relative power was associated with resilience; increased frontal Low θ relative power was associated with fear memory; and decreased parietal β2 frequency was associated with the avoidant-anhedonic phenotype.

Discussion: These predictive biomarkers open the way to preventive medicine for stress-induced diseases.

Keywords: EEG; fear; multisensorial stress; theta; vulnerability; β2.


Conflict of interest statement

The authors declare that the research was conducted in the absence of any commercial or financial relationships that could be construed as a potential conflict of interest.

Figures

Figure 1
Figure 1
Experimental time course.
Figure 2
Figure 2
Multisensorial stress context exposure. (A) Percentage of freezing during the 10-min MSS, sham-MSS, and re-exposures. Post-hoc Bonferroni test tp < 0.10, ***p < 0.001. (B) Number of interactions with TO during the 10-min MSS, sham-MSS, and re-exposures. Post-hoc Bonferroni test **p < 0.01, ***p < 0.001. (C) Duration (in sec) of interaction with TO during the 10-min MSS, sham-MSS, and re-exposures. Post-hoc Bonferroni test ***p < 0.001. Results are expressed as mean ± SEM.
Figure 3
Figure 3
Startle response. Post-hoc Bonferroni test **p < 0.01. Results are expressed as mean ± SEM.
Figure 4
Figure 4
Active wake characterization: Active wake duration measured by telemetry. ANOVA for repeated measures, group effect: tp < 0.10. Results are expressed as mean ± SEM.
Figure 5
Figure 5
Stress group clustering. (A) Percentage of freezing during MSS, and R1 and R2 re-exposures. Post-hoc tests ***p < 0.001 between the C1 subgroup (Fear) and the Sham group, $p < 0.05 between the C2 subgroup and the Sham group, $$$p < 0.001 between the C2 subgroup (Avoidance) and the Sham group,£££p < 0.001 between the C3 subgroup (Neotic) and Sham group, §§§p < 0.001 between the C1 and C3 subgroups, ¤¤¤p < 0.001 between the C1 and C2 subgroups. (B) Duration in seconds of interaction with TO during MSS, and R1 and R2 re-exposures. Post-hoc tests **p < 0.01 between the C1 subgroup and the Sham group, $p < 0.05 between the C2 subgroup (Avoidance) and Sham group,£p < 0.05 between the C3 subgroup (Neotic) and Sham group,££p < 0.01 between the C3 subgroup (Neotic) and Sham group, §p < 0.05 between the C1 and C3 subgroups, tp < 0.10 between the C3 subgroup and the Sham group. (C) Number of interactions with TO during MSS, and R1 and R2 re-exposures. Post-hoc tests ***p < 0.001 between the C1 subgroup and the Sham group, $$p < 0.01 between the C2 subgroup and the Sham group, $$$p < 0.001 between the C2 subgroup and the Sham group,£££p < 0.001 between the C3 subgroup and the Sham group, ¤p < 0.05 between the C1 and C2 subgroups, §§p < 0.01 between the C1 and C3 subgroups, §§§p < 0.001 between the C1 and C3 subgroups. Results are expressed as mean ± SEM.
Figure 6
Figure 6
Behavioral and biological subgroup characterization. (A) Sucrose preference tests before and after stress exposure. Post-hoc test ¤¤p < 0.01 between the C1 (Fear) and C2 (Avoidance) subgroups,p < 0.05 between the C2 and C3 (Neotic) subgroups. (B) Sucrose preference tests before and after stress exposure. $p < 0.05 between the C2 subgroup and the Sham group. (C) Startle reactivity compared to the Sham group. Post-hoc test *p < 0.05. (D) sBDNF at death compared to the Sham group. Post-hoc test *p < 0.05. Results are expressed as mean ± SEM.
Figure 7
Figure 7
ECoG subgroup characterization throughout the experiment. (A) Frontal Low θ relative power. *p < 0.05 between the C3 (Neotic) and C2 (Avoidance) subgroups, ***p < 0.001 between the C1 and C3 subgroups. (B) Frontal α relative power. *p < 0.05 between the C1 and C3 subgroups. (C) Frontal Low θ frequency. **p < 0.01 between the C1 and C3 subgroups, tp < 0.10 between the C1 and C2 subgroups. (D) Parietal High θ relative power. tp < 0.10 between the C1 and C2 subgroups. (E) Parietal Low θ frequency. *p < 0.05 between the C1 and C3 subgroups. (F) Parietal β2 frequency. (G) Frontal Low θ relative power. Stress subgroups compared to the Sham group. Post-hoc test ***p < 0.001 between the C3 subgroup and the Sham group. (H) Frontal Low θ frequency. Post-hoc test *p < 0.05 between the C1 subgroup and the Sham group. Results are expressed as mean ± SEM.
Figure 8
Figure 8
ROC curves for cluster membership predicted using baseline EcoG. (A) Summary of ECoG variables predicting cluster membership with AUC > 0.8. (B) ROC curves for C1 (Fear) predictivity. (C) ROC curves for C2 (Avoidance) predictivity. (D) ROC curves for C3 (Neotic) predictivity.

References

    1. Arns M., Etkin A., Hegerl U., Williams L. M., DeBattista C., Palmer D. M., et al. . (2015). Frontal and rostral anterior cingulate (rACC) theta EEG in depression: Implications for treatment outcome? Eur. Neuropsychopharmac. 25, 1190–1200. 10.1016/j.euroneuro.2015.03.007 - DOI - PubMed
    1. Arshamian A., Laska M., Gordon A. R., Norberg M., Lahger C., Porada D. K., et al. . (2017). A mammalian blood odor component serves as an approach-avoidance cue across phylum border—from flies to humans. Sci. Rep. 7, 13635. 10.1038/s41598-017-13361-9 - DOI - PMC - PubMed
    1. Baker P. M., Mathis V., Lecourtier L., Simmons S. C., Nugent F. S., Hill S., et al. . (2022). Lateral Habenula beyond avoidance: Roles in stress, memory, and decision-making with implications for psychiatric disorders. Front. Syst. Neurosc. 16, 826475. 10.3389/fnsys.2022.826475 - DOI - PMC - PubMed
    1. Berenz E. C., York T. P., Bing-Canar H., Amstadter A. B., Mezuk B., Gardner C. O., et al. . (2019). Time course of panic disorder and posttraumatic stress disorder onsets. Soc. Psychiatry Psychiatr. Epidemiol. 54, 639–647. 10.1007/s00127-018-1559-1 - DOI - PMC - PubMed
    1. Blanchard R. J., Blanchard D. C. (1989). Attack and defense in rodents as ethoexperimental models for the study of emotion. Prog. Neuropsychopharmacol. Biol. Psychiatry 13, S3–14. 10.1016/0278-5846(89)90105-X - DOI - PubMed