. 2023 Apr 10;127(15):7484-7491.
doi: 10.1021/acs.jpcc.3c00069. eCollection 2023 Apr 20.

Quantum Interference and Contact Effects in the Thermoelectric Performance of Anthracene-Based Molecules

Affiliations

Quantum Interference and Contact Effects in the Thermoelectric Performance of Anthracene-Based Molecules

Joseph M Hamill et al. J Phys Chem C Nanomater Interfaces. .

Abstract

We report on the single-molecule electronic and thermoelectric properties of strategically chosen anthracene-based molecules with anchor groups capable of binding to noble metal substrates, such as gold and platinum. Specifically, we study the effect of different anchor groups, as well as quantum interference, on the electric conductance and the thermopower of gold/single-molecule/gold junctions and generally find good agreement between theory and experiments. All molecular junctions display transport characteristics consistent with coherent transport and a Fermi alignment approximately in the middle of the highest occupied molecular orbital/lowest unoccupied molecular orbital gap. Single-molecule results are in agreement with previously reported thin-film data, further supporting the notion that molecular design considerations may be translated from the single- to many-molecule devices. For combinations of anchor groups where one binds significantly more strongly to the electrodes than the other, the stronger anchor group appears to dominate the thermoelectric behavior of the molecular junction. For other combinations, the choice of electrode material can determine the sign and magnitude of the thermopower. This finding has important implications for the design of thermoelectric generator devices, where both n- and p-type conductors are required for thermoelectric current generation.


Conflict of interest statement

The authors declare no competing financial interest.

Figures

Figure 1
Figure 1
Schematic of a thermoelectric generator with the n- and p-conducting branches, cold and hot reservoirs, load resistance, and the thermal (Seebeck) voltage.
Figure 2
Figure 2
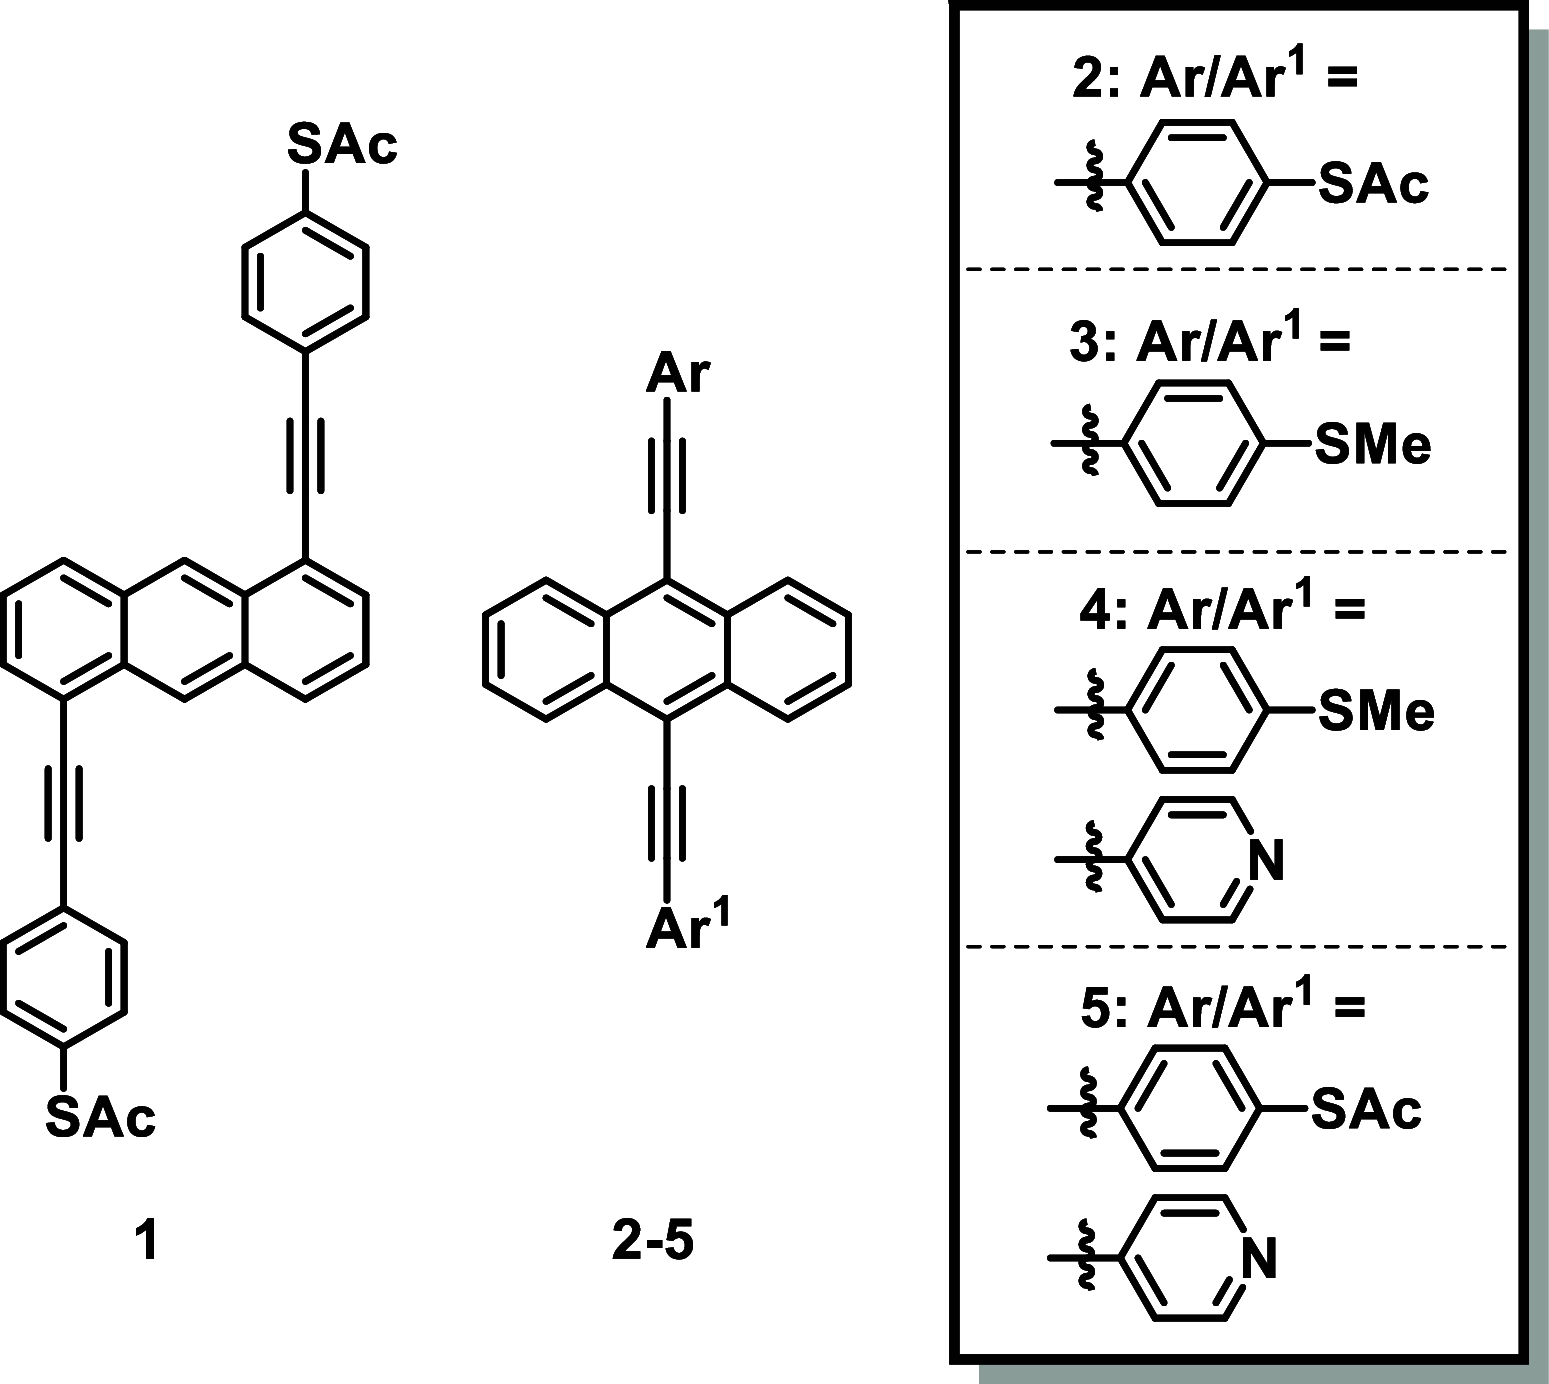
(a) Molecules measured in this study: 1,5-di(4-(ethynylphenyl)thioacetate)anthracene (1), 9,10-di(4-(ethynylphenyl)thioacetate)anthracene (2), 9,10-di(4-ethynylthioanisole)anthracene (3), 9-(4-(ethynylphenyl)thioacetate)-10-(4-ethynylpyridine)anthracene (4), and 9-(4-ethynlthioanisole)-10-(4-ethynylpyridine)anthracene (5).
Figure 3
Figure 3
Example STM IV experiment performed on the adlayer of molecule 2. (a) Example withdrawal series with I/V sweeps across the Au/Au junction in purple through yellow. Sweeps across Au/2/Au in green. Sweeps across the open junction in blue. (b) 2D current vs bias intensity plot after Vcorr is removed from each group. (c) 3D scatter plot of displacement, Δz, conductance, G, and voltage offset, Vtherm, from each trace (sweeps across the open junction are removed) clustered using the Gaussian mixture model into a Au/Au cluster (gold) and a molecular cluster (green) and a noise cluster (red). (d) 1D histograms of Vtherm for the three clusters above and for the entire data set (gray) at ΔT = 27 K.
Figure 4
Figure 4
(a) Scatter plots of ΔV vs ΔT measurements of molecule 2 with separate trend lines for two separate experiments (light and dark green) and combined trend lines with 95% confidence intervals (green). (b) Scatter plots of G vs ΔT and (c) Δz vs ΔT for the same measurements, with Gmol and Δzmol from each separate measurement calculated as the mean of a Gaussian fit of all data and standard deviation as error bars. Trend lines are aids for the eye. (d) ΔV vs ΔT trend lines with 95% confidence intervals for molecules 1 (blue), 2 (green), 4 (purple), 5 (red), and clean Au/Au (gold). (e) Summary of Smol for all molecules in this study, and the internal reference at the Au/Au contact. Blue/red/green represent trials 1/2/3, and orange is the combined result (error bars: standard error of the slope from the linear least-square fit).
Figure 5
Figure 5
Example constant bias STM BJ experiment performed on the adlayer of molecule 2. (a) ca. 7k traces combined in a 2D conductance vs displacement intensity plot with an example trace (crimson). Cross-hairs are (Δzmol, Gmol) from the STM IV measurements with a standard deviation [trials 1 and 2 (blue), combined data set (orange)]. (b) 1D conductance histogram of all traces from constant bias measurements in gray and the Gaussian fit of the molecular plateau region (red). Blue: 1D conductance histogram of all sweeps from the STM IV mode from data plotted in Figure 3c. (c) 1D displacement histogram of all traces in constant bias measurement determined at a conductance of 10–5.2G0. Two-peak area-type Gaussian fit (red/yellow). Junction formation probability: 77%. 1D displacement histogram from the molecular cluster in STM IV mode (blue line) from data plotted in Figure 3c.
Figure 6
Figure 6
Electric and thermoelectric properties of 1–5, a comparison between the experiment and theory. Top panel: Gmol values from theory in Au/Au and Au/Pt junctions for 1–5 are similar at DFT-predicted mid-gap (black squares). Experiments for 1 and 2 formally yield a high Gmol value (STM IV, red open circles) and a lower one (solid red circles), see above, which is closer to theoretical predictions. Experimental Gmol values for 1–4 extracted from thin film measurements in Au/Pt junctions (blue circles) from refs (23) and (24) are shown for comparison and compare well with theoretical predictions and values from STM BJ. Bottom panel: predicted Stheory in Au/Au junctions (black squares) for 1, 2, 4, and 5 is positive, whereas for 3, it is negative, in line with both experimental data sets, where available. Interestingly, for 4, STM IV data from Au/Au junctions yield a positive Smol value but a negative one for measurements in Pt/Au junctions. This can be rationalized based on substrate-induced changes in the electronic structure of the junction, as described in the main text. Note: Experimental Smol values are unavailable for 3 and 5 in Au/Au and Au/Pt junctions, respectively; theoretical values are all mid-gap simulations (EFEFDFT ≈ mid-gap).

References

    1. Volta A.; Banks J. I. On the Electricity Excited by the Mere Contact of Conducting Substances of Different Kinds. Philos. Mag. 1800, 7, 289–311. 10.1080/14786440008562590. - DOI
    1. Seebeck T. J.Magnetische Polarisation der Metalle und Erze durch Temperatur-Differenz. In Abhandlungen der Königlichen Akademie Der Wissenschaften zu Berlin; Reimer G., Ed.; Königlichen Akademie Der Wissenschaften zu Berlin: Berlin, 1822; pp 265–373.
    1. Telkes M. The Efficiency of Thermoelectric Generators. J. Appl. Phys. 1947, 18, 1116–1127. 10.1063/1.1697593. - DOI
    1. Cullen J. M.; Allwood J. M. Theoretical Efficiency Limits for Energy Conversion Devices. Energy 2010, 35, 2059–2069. 10.1016/j.energy.2010.01.024. - DOI
    1. Yan Q.; Kanatzidis M. G. High-performance thermoelectrics and challenges for practical devices. Nat. Mater. 2022, 21, 503–513. 10.1038/s41563-021-01109-w. - DOI - PubMed