. 2023 Apr 11:14:1113735.
doi: 10.3389/fimmu.2023.1113735. eCollection 2023.

CD90 is not constitutively expressed in functional innate lymphoid cells

Affiliations

CD90 is not constitutively expressed in functional innate lymphoid cells

Jan-Hendrik Schroeder et al. Front Immunol. .

Abstract

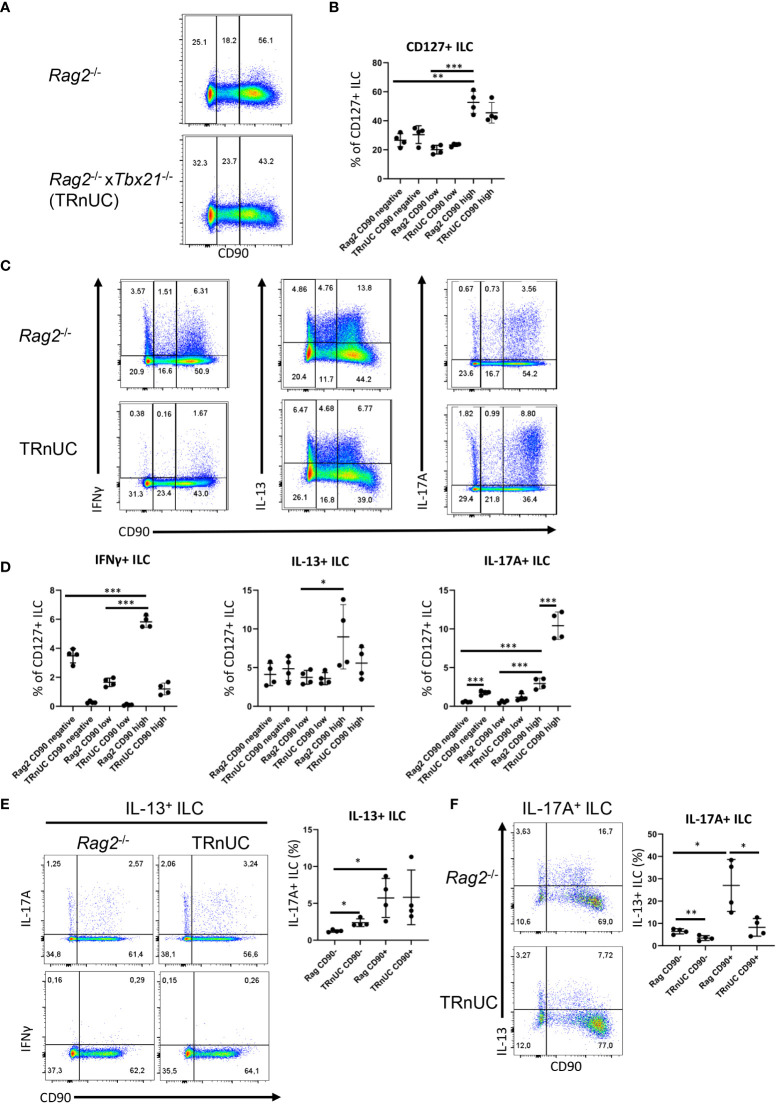
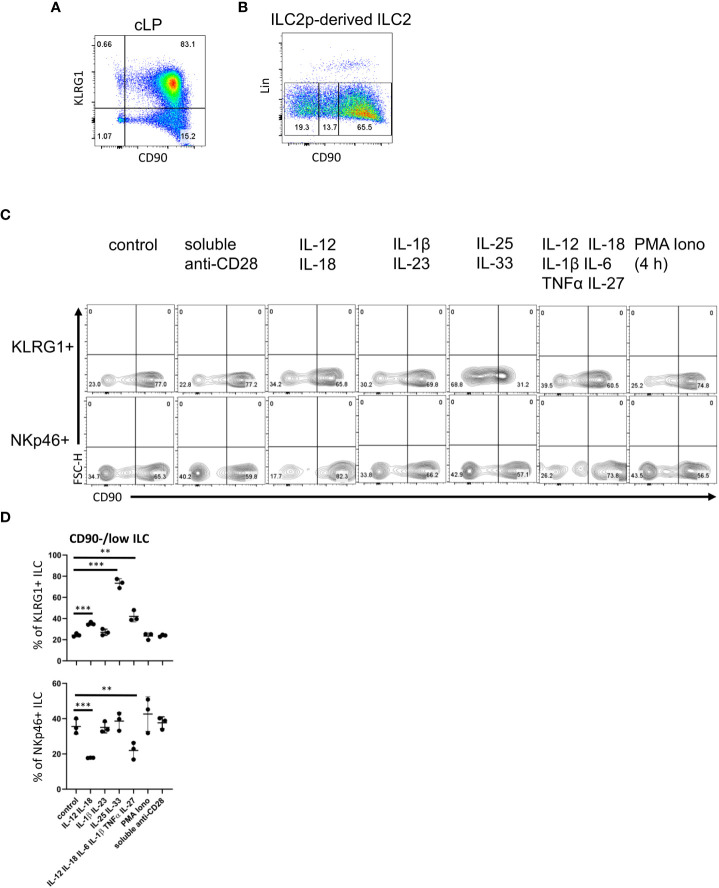
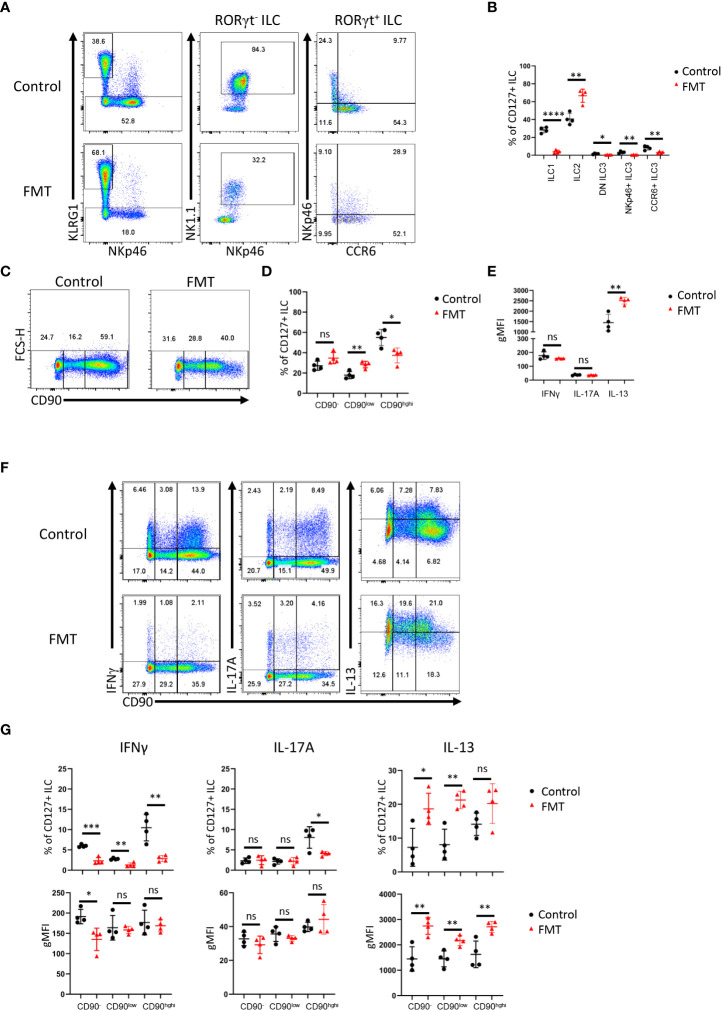
Huge progress has been made in understanding the biology of innate lymphoid cells (ILC) by adopting several well-known concepts in T cell biology. As such, flow cytometry gating strategies and markers, such as CD90, have been applied to indentify ILC. Here, we report that most non-NK intestinal ILC have a high expression of CD90 as expected, but surprisingly a sub-population of cells exhibit low or even no expression of this marker. CD90-negative and CD90-low CD127+ ILC were present amongst all ILC subsets in the gut. The frequency of CD90-negative and CD90-low CD127+ ILC was dependent on stimulatory cues in vitro and enhanced by dysbiosis in vivo. CD90-negative and CD90-low CD127+ ILC were a potential source of IL-13, IFNγ and IL-17A at steady state and upon dysbiosis- and dextran sulphate sodium-elicited colitis. Hence, this study reveals that, contrary to expectations, CD90 is not constitutively expressed by functional ILC in the gut.

Keywords: CD90; DSS-colitis; fecal microbial transplant (FMT); innate lymphoid cell (ILC); intestine.


Conflict of interest statement

The authors declare that the research was conducted in the absence of any commercial or financial relationships that could be construed as a potential conflict of interest.

Figures

Figure 1
Figure 1
CD90-negative Rag2-deficient ILC are a substantial source of IFNγ and IL-13 during DSS colitis. cLP ILC from 5% DSS-treated Rag2 -/- and TRnUC mice were isolated and stimulated with PMA and ionomycin (3 hours) prior to flow cytometry analysis. (A) Frequencies of CD90hi, CD90low and CD90- in total CD127+ ILC and (B) statistical analyses are shown. (C) IFNγ, IL-13 and IL-17A expression in CD90hi, CD90low and CD90- total CD127+ ILC and (D) corresponding statistical analyses are outlined. (E) CD90 co-expression with IL-17A or IFNγ in IL-13+ ILC and corresponding statistical analyses are shown. (F) Flow cytometry and statistical analysis of CD90 and IL-13 expression in IL-17A+ ILC are presented. Data shown are representative of 4 biological replicates. *p < 0.05; **p< 0.01; ***p<0.001.
Figure 2
Figure 2
cLP ILC have a variable expression of CD90 depending on stimulatory cues. (A) KLRG1 and CD90 co-expression in cLP CD127+ ILC was demonstrated by flow cytometry (n=12). (B) ILC2 were generated from ILC2p stimulated with IL-7, SCF and IL-33, and seeded onto OP9-DL1. CD90hi, CD90low and CD90- ILC2 are shown. (C, D) KLRG1+ or KLRG1- CD127+ ILC were isolated and stimulated in vitro for 48 hours prior to harvest and flow cytometry analyses of KLRG1+ or NKp46+ ILC, respectively. In addition to a control condition, soluble agonistic anti-CD28 antibodies, IL-12&IL-18, IL-1β&IL23, IL-25&IL-33 or IL-12&IL-18& IL-1β&IL-6&TNFα &IL-27 were used as stimuli. In a separate condition designated as “PMA Iono”, sorted cells were stimulated with PMA and ionomycin in the presence of monensin for the final 4 hours prior to harvesting. (D) Flow cytometry analyses of CD90hi and CD90low/neg CD127+ ILC and statistical analyses of CD90low/neg ILC frequencies among KLRG1+ or NKp46+ cLP ILC are outlined. Data shown are representative of 3 biological replicates. **p< 0.01; ***p<0.001.
Figure 3
Figure 3
Transcriptomic analyses of CD90 expression in intestinal ILC. scRNA-seq data sets of intestinal ILC from published studies (47, 49, 55) were employed to analyze expression of Thy1 (encoding CD90) across ILC subsets and its role on the global transcriptional profile. (A) UMAP plots of ILC subset annotation from the scRNA-seq data sets of the (47, 55) studies. (B) UMAP analyses of gene expression in the ILC subset clusters in the data set obtained from (55). (C) UMAP analysis of Thy1 expression intensity in ILC subsets in the respective studies. A trajectory analysis along the Thy1 expression intensity was performed in the indicated ILC subsets. (D, E) Volcano plots comparing gene expression (log2 fold change and padj) between Thy1 high ILC versus Thy1 low/negative (D) ILC subsets, as annotated in the respective published data set, and (E) total ILC. The most differentially expressed genes are labelled. In order to generate the volcano plots the median normalized Thy1 expression across all datasets was calculated and used to delineate Thy1 high and Thy1 low/negative cells.
Figure 4
Figure 4
Dysbiosis-triggered appearance of functional cLP ILC with a low expression of CD90. Feces from TRUC mice were transferred into Rag2 -/- mice and cLP leukocytes were isolated 21 days later from treated and untreated mice. (A) KLRG1+ ILC2, KLRG1- RORγt- NKp46+ NK1.1+ ILC1, KLRG1- RORγt+ ILC3 subsets from FMT-treated and untreated control mice were analyzed by flow cytometry. ILC3 subsets were defined as NKp46+ CCR6-, CCR6+ NKp46- or DN (‘double negative’) in these analyses. (B) A statistical analysis of ILC subset frequency among the whole cLP ILC population is outlined. (C) ILC with no or a low or high expression of CD90 were analyzed by flow cytometry and (D) a statistical analysis of the frequency of these ILC among the whole ILC population is presented. (E) The per cell expression of IFNγ, IL-17A and IL-13 in ILC was analyzed statistically. (F) IFNγ, IL-17A and IL-13 expression in CD90-, CD90low and CD90high ILC was determined by flow cytometry. (G) Related statistical analyses investigating the frequency of respective ILC and the per cell expression of IFNγ, IL-17A and IL-13 in the CD90-, CD90low and CD90high ILC populations are shown. Data are representative of 4 biological replicates. ns, non-significant; *p < 0.05; **p< 0.01; ***p<0.001; ****p<0.0001.

References

    1. Bal SM, Golebski K, Spits H. Plasticity of innate lymphoid cell subsets. Nat Rev Immunol (2020) 20(9):552–65. doi: 10.1038/s41577-020-0282-9 - DOI - PubMed
    1. Klose CSN, Artis D. Innate lymphoid cells control signaling circuits to regulate tissue-specific immunity. Cell Res (2020) 30(6):475–91. doi: 10.1038/s41422-020-0323-8 - DOI - PMC - PubMed
    1. Schroeder JH, Howard JK, Lord GM. Transcription factor-driven regulation of ILC1 and ILC3. Trends Immunol (2022) 43(7):564–79. doi: 10.1016/j.it.2022.04.009 - DOI - PMC - PubMed
    1. Leyton L, Díaz J, Martínez S, Palacios E, Pérez LA, Pérez RD. Thy-1/CD90 a bidirectional and lateral signaling scaffold. Front Cell Dev Biol (2019) 7:132. doi: 10.3389/fcell.2019.00132 - DOI - PMC - PubMed
    1. Sauzay C, Voutetakis K, Chatziioannou A, Chevet E, Avril T. CD90/Thy-1, a cancer-associated cell surface signaling molecule. Front Cell Dev Biol (2019) 7:66. doi: 10.3389/fcell.2019.00066 - DOI - PMC - PubMed

Publication types

LinkOut - more resources