. 2023 Jul;10(20):e2206787.
doi: 10.1002/advs.202206787. Epub 2023 Apr 28.

Identification and Characterization of the Wilms Tumor Cancer Stem Cell

Affiliations

Identification and Characterization of the Wilms Tumor Cancer Stem Cell

Astgik Petrosyan et al. Adv Sci (Weinh). 2023 Jul.

Abstract

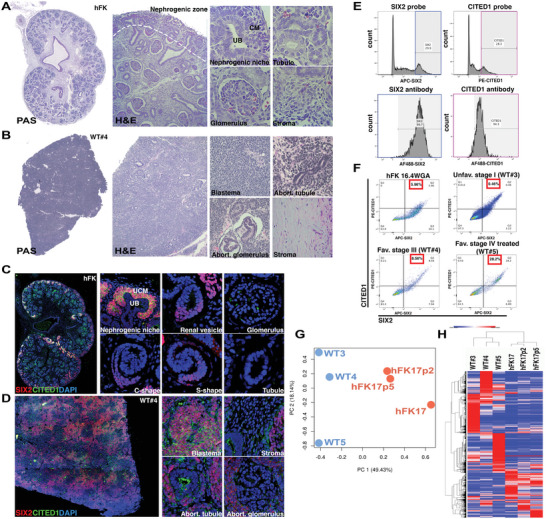
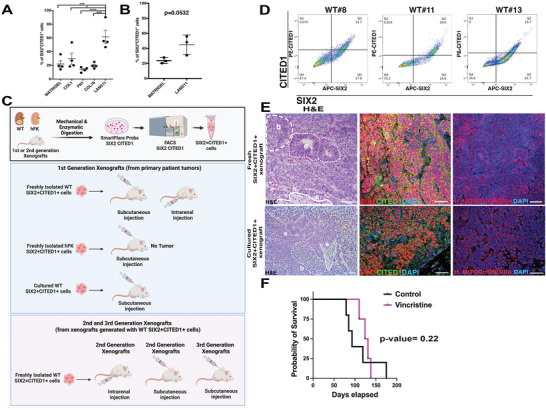
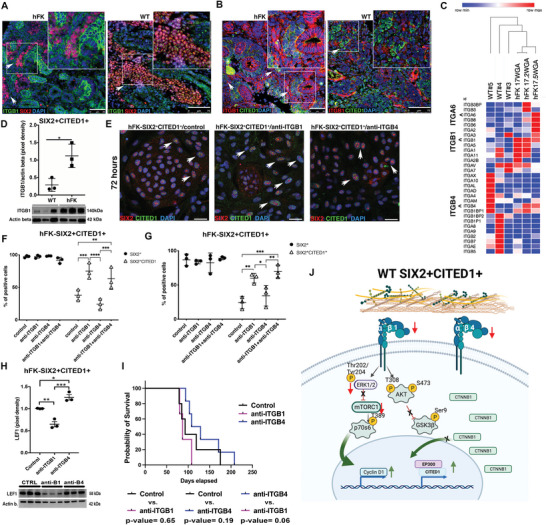
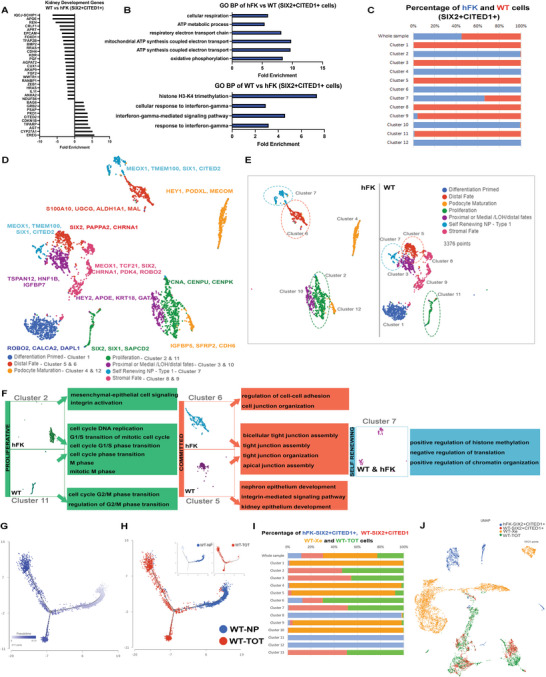
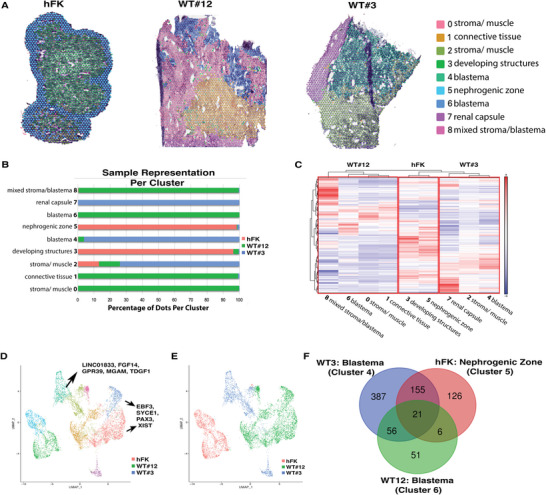
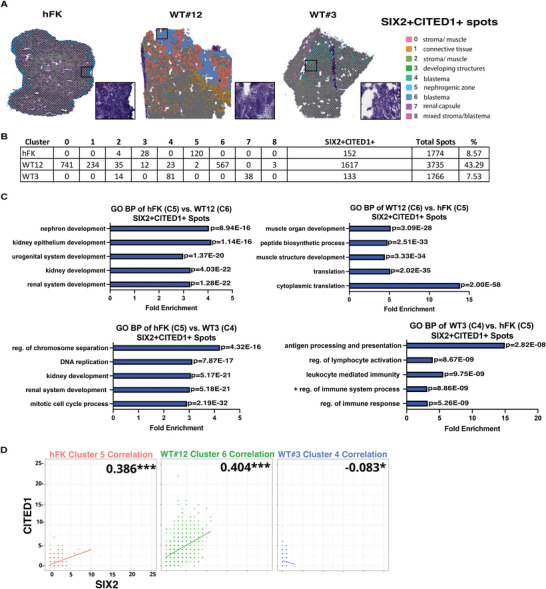
A nephrogenic progenitor cell (NP) with cancer stem cell characteristics driving Wilms tumor (WT) using spatial transcriptomics, bulk and single cell RNA sequencing, and complementary in vitro and transplantation experiments is identified and characterized. NP from WT samples with NP from the developing human kidney is compared. Cells expressing SIX2 and CITED1 fulfill cancer stem cell criteria by reliably recapitulating WT in transplantation studies. It is shown that self-renewal versus differentiation in SIX2+CITED1+ cells is regulated by the interplay between integrins ITGβ1 and ITGβ4. The spatial transcriptomic analysis defines gene expression maps of SIX2+CITED1+ cells in WT samples and identifies the interactive gene networks involved in WT development. These studies define SIX2+CITED1+ cells as the nephrogenic-like cancer stem cells of WT and points to the renal developmental transcriptome changes as a possible driver in regulating WT formation and progression.

Keywords: Wilms tumor; cancer; nephron progenitors.


Conflict of interest statement

The authors declare no conflict of interest.

Figures

Figure 1
Figure 1
SIX2+CITED1+ cells in hFK and WT have different transcriptional signatures. A,B) Periodic acid Schiff (PAS, left, whole image) and H&E (right, close‐up images) staining of hFK (A,10 WGA) and WT#4 (B, favorable stage III) show the nephrogenic zone (white dotted line) and differentiating structures (second panel: ureteric bud, UB; cap mesenchyme CM; tubule, glomerulus, and stroma) of hFK, and unorganized WT histology with triphasic components (second panel, stroma, blastema, and epithelial structures including abortive glomeruli and tubules). 10× images acquired and composed using Photoshop DC (Adobe) for whole images, right panels of 20X images. C,D) SIX2 (red) and CITED1 (green) immunofluorescence staining of C) hFK 10 WGA and D) WT#4. SIX2+CITED1+ co‐expression in hFK (C, second panel) in the nephrogenic niche (uninduced cap mesenchyme, UCM) but absent within developing (renal vesicle, C‐shape, S‐shape) and mature (glomerulus and tubule) structures. SIX2+CITED1+ expression is dispersed throughout the WT (D, second panels) in blastema but not in stroma or abortive structures (glomerulus and tubule). Nuclei stained with DAPI (blue), 10× images acquired and composed using Photoshop DC (Adobe) for whole images, right panels of 20× images. E) SmartFlare technique validation by flow cytometry. SIX2‐Cy5 and CITED1‐Cy3 probes (top left and right panel respectively) were individually used to isolate cells from hFK (17.4 WGA). Flow cytometry confirmed that 99.7% of SIX2+ cells and 94.3% of CITED1+ cells co‐express both mRNA and protein (bottom left and right panels). F) FACS sorting (by Smartflares): 5.96% of cells from hFK 16.4 WGA are SIX2+CITED1+ cells, 0.46% from WT#3 (unfavorable stage I), 8.56% from WT#4 (favorable stage III) and 28.2% from WT#5 (favorable chemotherapy‐treated stage IV). G,H) Bulk RNA‐seq analysis of hFK (17, 17.2, and 17.5 WGA) and WT (n = 3, as in F). PCA (principal component analysis, G) describes 49.43% and 18.14% of the variability, along PC1 and PC2 respectively, within the expression data set. SIX2+CITED1+ cells from WT cluster independently of SIX2+CITED1+ cells from hFK. H) Hierarchical clustering of total gene expression in SIX2+CITED1+ cells from hFK and WT highlights higher similarity among SIX2+CITED1+ cells from different hFK versus higher divergence of SIX2+CITED1+ cells from different WT.
Figure 2
Figure 2
WT‐derived SIX2+CITED1+ cells can be expanded in vitro and generate in vivo xenografts. A flow cytometry analysis of SIX2+CITED1+ cells (%) from hFK (17 WGA) cultured for 5 days on matrigel, collagen I (COL1), fibronectin (FN1), collagen16 (COL16), or laminin511 (LAM511). *p < 0.05; ***p < 0.001; mean ± SEM. B) Flow cytometry analysis of SIX2+CITED1+ cells (%) from hFK (17 WGA) cultured for 28 d on matrigel or LAM511. C) Schematic representation of in vivo limiting dilution and serial xenografts experiments (created with Biorender). D) FACS sorting of SIX2+CITED1+ cells using Smartflare probes from different WT subtypes with favorable histology, stage II (WT#8: 14.7%, WT#11: 30%, and WT#13: 10.7%). E) Representative H&E staining (left panel), SIX2 (red) and CITED1 (green, center) and human mitochondria (red) immunofluorescence staining (right panel) of xenograft generated from freshly isolated WT#8 (favorable stage II)‐SIX2+CITED1+ cells (4 months after injection) and cultured WT#8‐SIX2+CITED1+ cells (passage 6, 4 months after injection). Classical triphasic WT structures are shown (b: blastema, e: epithelium, and s: stroma; white lines). Nuclei stained with DAPI (blue), scale bar = 50 µm. F) Survival analysis of mice after injection of cultured SIX2+CITED1+ cells from WT#8 (favorable stage II) either without treatment (control, n = 12) or after vincristine treatment (450 µg kg−1 vincristine sulfate IP every 4 days, n = 4).
Figure 3
Figure 3
SIX2+CITED1+ cell self‐renewal: the role of the extracellular matrix niche. A,B) Representative immunofluorescence staining showing the distribution of ITGβ1 (green) and SIX2 (red) in hFK (10 WGA) and WT (WT#12, favorable stage III) A) and for ITGβ1 (red) and CITED1 (green) in hFK (10 WGA) and WT (WT#8 favorable stage II. B) Nuclei stained with DAPI (blue); scale bars 50 and 75 µm, respectively. C) Heatmap showing gene expression profile for integrins in SIX2+CITED1+ cells from hFK (17, 17.2, and 17.5 WGA) and WT (WT#3 anaplastic stage I, WT#4: non‐anaplastic, stage III, and WT#5: non‐anaplastic chemo‐treated, stage IV). D) Densitometric analysis by western blot (WB) of ITGβ1 expression in freshly isolated SIX2+CITED1+ cells from WT (WT#8,11,12, favorable stage II, favorable stage III, and favorable stage II) versus SIX2+CITED1+ cells from hFK (15,16,18 WGA) showing higher expression of ITGβ1 in hFK cells; β‐actin was used as housekeeping protein for normalization. WB bands are presented below the graph, *p < 0.05. E) Representative immunofluorescence staining of SIX2 (red) and CITED1 (green) in SIX2+CITED1+ cells from hFK (17 WGA) cultured for 72 h with/without 1 µg mL−1 anti‐ITGβ1 or 0.5 µg mL−1 anti‐ITGβ4 neutralizing antibody showing increased expression of CITED1 in cells treated with anti‐ITGβ1. Nuclei stained with DAPI (blue). Scale bar = 50 µm. F,G) Percentage of SIX2+CITED1+ cells and total SIX2+ cells from hFK (17 WGA) by flow cytometry analysis after F) 5 d or G) 28 d of culture with/without anti‐ITGβ1 or anti‐ITGβ4 neutralizing antibody or a combination of both. *p < 0.05, **p < 0.01, ***p < 0.001, ****p < 0.0001; mean ± SEM. H) Densitometric analysis by WB of LEF1 protein expression in hFK SIX2+CITED1+ cells (17 WGA) cultured for 28 d with/without anti‐ITGβ1 or anti‐ITGβ4 neutralizing antibody β‐actin was used as housekeeping control. WB bands are presented below the graph. *p < 0.05. I) Kaplan‐Meier survival analysis of mice injected with WT SIX2+CITED1+ cells, without treatment (control, n = 4) or with the treatment of anti‐ITGβ1 (n = 5) or anti‐ITGβ4 (n = 4), endpoint tumor size 1.5 cm. J) Schematic representation showing the proposed role of ITGβ1 and ITGβ4 in WT SIX2+CITED1+ cells.
Figure 4
Figure 4
Bulk and scRNA‐seq analysis reveal heterogenicity of hFK and WT SIX2+CITED1+ cells. A) Ingenuity Pathway Analysis (IPA) of nephrogenic development‐specific genes in SIX2+CITED1+ cells derived from WT versus hFK. The graph shows significantly upregulated and downregulated genes in the nephrogenic development pathway in WT. B) Gene Ontology (GO) sets enriched in hFK SIX2+CITED1+ cells (top) and WT SIX2+CITED1+ cells (bottom) are visualized by fold enrichment score. P < 0.05. Upregulated DE genes were used for each comparison. C) Fraction of cells (% of cells; x‐axis; hFK, blue; WT, red) in each cluster (y‐axis). D) Uniform manifold approximation and projection (UMAP) of 3376 droplet‐based scRNA‐seq profiles of SIX2+CITED1+ cells from hFK (16 WGA) and WT#8 (favorable stage II), generated by unsupervised assignment of clusters. Clusters are labeled (bottom) by post‐hoc annotation based on relevant differentially expressed nephrogenic genes. E) Split‐by‐sample UMAP, highlighting how the different cell subpopulations are divided between WT and hFK samples. F) GO analysis for selected clusters shows shared enrichment for proliferative (clusters 2 and 11) and differentiating (clusters 5 and 6) gene sets. P < 0.05. Upregulated DE genes were used for each comparison. Common cluster 7 is highly enriched for genes involved in methylation and chromatin organization. G) Trajectory and H) pseudo‐time ordering of the integration of WT SIX2+CITED1+ cells and WT‐TOT (tumor of origin from which the SIX2+CITED1+ cells were obtained) arranged into a major trajectory bifurcating into two branches representing divergent differentiation paths. (H, top panel: blue: WT‐NP; red: WT‐TOT). I) Distribution of SIX2+CITED1+ cells from hFK (blue), SIX2+CITED1+ cells from WT (red), WT‐Xe (xenograft from freshly isolated and transplanted WT#8 SIX2+CITED1+ cells, yellow) and WT‐TOT (total primary WT) samples (green) to each cluster. J) UMAP of 10121 droplet‐based scRNA‐seq profiles from the integration of SIX2+CITED1+ cells from hFK (blue), SIX2+CITED1+ cells from WT (red), WT‐Xe (yellow) and WT‐TOT (green) samples.
Figure 5
Figure 5
Spatial transcriptomics (ST) analysis of integrated data from hFK, WT#12 and WT#3. A) ST performed on integrated data of hFK (16.6 GWA), WT#12 favorable stage III, and WT#3 unfavorable stage I identified 9 clusters by unsupervised clustering. Histological identification of morphological regions within the integration analysis is shown. B) Fraction of spots (x‐axis) from each sample in each cluster (y‐axis). C) Hierarchical clustering of all identified genes within the 9 clusters stratified based on integrated samples. D) Uniform manifold approximation and projection (UMAP) of 7282 spot‐based ST from the integrated samples, colored by clusters generated by unsupervised assignment. Specific cluster genes are reported. E) UMAP of 7282 spot‐based ST from the integration of hFK (red), WT#3 (blue), and WT#12 (green). F) Venn diagram of differentially expressed genes (DEG) in hFK nephrogenic zone cluster 5 (red) and WT#3 (blue) and 12 (green) blastema clusters 4 and 6, respectively. Only DEG with average log fold change >0.5 or ←0.5 and adjusted p‐value <0.05 were included. The list and distribution of genes included in the VENN diagram can be found in Dataset S#8 (Supporting Information).
Figure 6
Figure 6
Spatial transcriptomics (ST) analysis of SIX2+CITED1+ spots from hFK and WT reveals molecular heterogeneity of histologically similar structures in different WT. A. ST visualization of SIX2+CITED1+ spots in hFK, WT#12, and WT#3 obtained by unsupervised clustering of ST performed on integrated data. The hFK SIX2+CITED1+ spots are localized in the nephrogenic zone (identified by cap mesenchyme as shown by the H&E, black box). Zoomed in H&E representing the cap mesenchyme in hFK and the blastema component in WT#12 and WT#3 that are spread throughout the WT.  B) Table summarizing the distribution of SIX2+CITED1+ spots per cluster and the percentage of total SIX2+CITED1+ spots compared to the total number of spots per sample (right side column) C) List of top gene ontology (GO) biological process of hFK nephrogenic zone (cluster 5, SIX2+CITED1+ spots) compared to WT#3 blastema (cluster 4) and WT#12 blastema (cluster 6) SIX2+CITED1+ spots (left panels) and in WT#3 blastema (cluster 4) or WT#12 blastema (cluster 6) SIX2+CITED1+ spots compared to hFK nephrogenic zone (cluster 5, SIX2+CITED1+ spots, right panels). Fold enrichment of each gene set is shown, P < 0.05; upregulated DE genes were used for each comparison. D) Pearson correlation between the expression of CITED1 and SIX2 was performed on SIX2+CITED1+ spots found in clusters of WT#3 (cluster 4), hFK (cluster 5), and WT#12 (cluster 6), with dots representing spots; dots color intensity indicating the number of spots superimposed with a similar expression of SIX2 (x‐axis) and CITED1 (y‐axis).

References

    1. McMahon A. P., Curr. Top. Dev. Biol. 2016, 117, 31. - PMC - PubMed
    1. Sacco S. D., Thornton M. E., Petrosyan A., Lavarreda‐Pearce M., Sedrakyan S., Grubbs B. H., De Filippo R. E., Perin L., Stem Cells Transl. Med. 2017, 6, 419. - PMC - PubMed
    1. Little M. H., McMahon A. P., Cold Spring Harbor Perspect. Biol. 2012, 4, a008300. - PMC - PubMed
    1. Oxburgh L., Nat. Rev. Urol. 2016, 13, 304. - PubMed
    1. Davidoff A. M., Adv. Pediatr. 2012, 59, 247. - PMC - PubMed

Publication types

Substances