. 2023 Jul 3;222(7):e202211039.
doi: 10.1083/jcb.202211039. Epub 2023 Apr 28.

Parallel phospholipid transfer by Vps13 and Atg2 determines autophagosome biogenesis dynamics

Affiliations

Parallel phospholipid transfer by Vps13 and Atg2 determines autophagosome biogenesis dynamics

Rahel Dabrowski et al. J Cell Biol. .

Abstract

During autophagy, rapid membrane assembly expands small phagophores into large double-membrane autophagosomes. Theoretical modeling predicts that the majority of autophagosomal phospholipids are derived from highly efficient non-vesicular phospholipid transfer (PLT) across phagophore-ER contacts (PERCS). Currently, the phagophore-ER tether Atg2 is the only PLT protein known to drive phagophore expansion in vivo. Here, our quantitative live-cell imaging analysis reveals a poor correlation between the duration and size of forming autophagosomes and the number of Atg2 molecules at PERCS of starving yeast cells. Strikingly, we find that Atg2-mediated PLT is non-rate limiting for autophagosome biogenesis because membrane tether and the PLT protein Vps13 localizes to the rim and promotes the expansion of phagophores in parallel with Atg2. In the absence of Vps13, the number of Atg2 molecules at PERCS determines the duration and size of forming autophagosomes with an apparent in vivo transfer rate of ∼200 phospholipids per Atg2 molecule and second. We propose that conserved PLT proteins cooperate in channeling phospholipids across organelle contact sites for non-rate-limiting membrane assembly during autophagosome biogenesis.


Conflict of interest statement

Disclosures: The authors declare no competing interests exist.

Figures
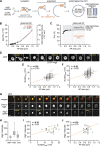
Figure 1.
Figure 1.
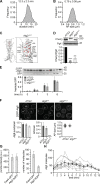
Membrane assembly and Atg2 at PERCS are not rate-limiting for autophagosome formation. (A) Model for autophagosome biogenesis based on vesicle- and non-vesicle PLT mechanisms. (B) Number of phospholipids and intermembrane volume needed to form autophagosomes of indicated diameter (AP size) is based on an intermembrane distance of 5 nm (Bieber et al., 2022) and calculated as described in Materials and methods. The red regression line and P value indicate a near linear relationship between diameter (AP size) and both parameters. (C) The relative quantitative contribution of vesicle- and non-vesicle phospholipid transfer to autophagosomes. Based on the total phospholipid content of three Atg9 vesicles (60 nm) and the corresponding number of COPII vesicles (80 nm) required to form the intermembrane volume of autophagosomes of a given size, we calculated the number of phospholipids derived from non-vesicle phospholipids as described in Materials and methods. (D) Timelapse fluorescence imaging of WT cells expressing 2GFP-ATG8 after starvation (1 h). Representative timeline of autophagosome biogenesis is shown as single Z-sections. Arrowheads indicate nucleated phagophores. Scale bar is 0.5 µm. (E and F) Quantification of data is shown in D. (E) Simple linear regression of durationmax (time from nucleation until maximum size) and autophagosome (AP) size (number of independent experiments, n = 6; 230 events analyzed in total). (F) Simple linear regression of durationtotal (time from nucleation until disappearance) and autophagosome (AP) size (number of independent experiments, n = 6; 230 events analyzed in total). (G) Timelapse fluorescence imaging of WT cells expressing Cherry-ATG8 and ATG2-3GFP after starvation (1 h). Images are single Z-sections. Representative timeline of autophagosome biogenesis is shown. Atg2 signal intensity was measured at the indicated time points: start, maximum (“max”), and end. Scale bar is 0.5 µm. (H–J) Quantification of data shown in G (number of independent experiments, n = 3; 30 events analyzed in total). (H) Number of Atg2 molecules at indicated timepoints. Simple linear regression of maximum number of Atg2 molecules and durationtotal (I) or autophagosome (AP) size (J).
Figure S1.
Figure S1.
Atg2-mediated PLT is essential for autophagosome formation. (A) Relative frequency of autophagosome biogenesis durations from data shown in Fig. 1, D–F. (B) Relative frequency of autophagosome sizes from data shown in Fig. 1, D–F. (C) AlphaFold-based structure-prediction of S. cerevisiae Atg2 with mutated amino acid residues in Atg2ΔPLT shown in red (Jumper et al., 2021). (D) Western blot analysis of whole cell extracts and quantifications of protein levels of Atg2-Cherry, Atg2low-2Cherry, and Atg2ΔPLT-Cherry expressed from the endogenous ATG2 locus using α-Cherry and α-Pgk1 antibodies. (E) Indicated strains expressing 2GFP-ATG8 were starved, and autophagy flux was analyzed at indicated time points by whole-cell extraction and Western blot analysis using an α-GFP antibody. Data are means ± SD (number of independent experiments, n = 4). (F) Fluorescence imaging of indicated strains expressing 2GFP-ATG8 after starvation (1 h). Quantification of the number of Atg8 puncta and autophagosomes (APs) per cell (number of independent experiments, n = 4; 200 cells/strain analyzed in total) and autophagosome size (n = 4; 40 APs/strain). Scale bar is 3 µm. (G) Fluorescence imaging of cells expressing CSE4-GFP or ATG2-3GFP after starvation (1 h). Fluorescence intensities for punctate signals were quantified, and the mean Cse4-GFP intensity was normalized to 80 molecules (number of independent experiments, n = 3; 150 cells/strain analyzed in total). (H) Number of Atg2 molecules during autophagosome biogenesis for 10 events in WT cells is shown in gray (included in Fig. 4 A). The mean ± SD over time for these 10 events is shown in black. Source data are available for this figure: SourceData FS1.
Figure 2.
Figure 2.
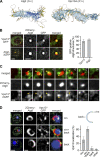
Vps13 quantitatively localizes to the phagophore rim. (A) AlphaFold-based structure predictions of S. cerevisiae Atg2 and Rattus norvegicus Vps13A (Jumper et al., 2021). (B) Fluorescence imaging of Δvps13 cells expressing 2Cherry-ATG8 and pRS423-VPS13^GFP or cells expressing Cherry-ATG8 and ATG2-3GFP after starvation (1 h). The analysis of Vps13 and Atg2 was performed in independent experiments. Quantified data are shown in the right panel (number of independent experiments, n = 4; 200 structures analyzed in total). Scale bars are 2 and 1 µm (zoom in). (C) Timelapse fluorescence imaging of WT cells expressing VPS13^2GFP and 2Cherry-ATG8 after starvation (1 h). Representative timeline for autophagosome biogenesis is shown as a single section. Scale bar is 0.5 µm. (D) Fluorescence imaging of Δvps13 cells expressing 2Cherry-ATG8, pRS423-VPS13^GFP, and pRS425-APE1-BFP after starvation (1 h). Quantified data are shown in the right panel (number of independent experiments, n = 4; 200 structures analyzed in total). Scale bars are 2 and 1 µm (zoom in).
Figure S2.
Figure S2.
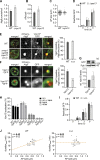
Analysis of autophagy in the absence of Vps13 or known Vps13-adaptor proteins. (A–C) Fluorescence imaging of WT and Δvps13 cells expressing 2GFP-ATG8 after starvation (1 h). (A and B) Quantification of the number of Atg8 puncta (A) and autophagosomes (APs; B; number of independent experiments, n = 4; 200 cells/strain analyzed in total). (C) Autophagosome size distribution for WT and Δvps13 cells (number of independent experiments, n = 4; 40 APs/strain analyzed in total). (D) Quantification of the autophagic flux of indicated strains expressing 2GFP-ATG8 during starvation. Data are means ± SD (number of independent experiments, n = 4). Cells were analyzed at indicated time points by whole cell extraction and Western blot analysis using α-GFP antibody. (E) Fluorescence imaging of WT and Δmcp1Δypt35Δspo71 (ΔΔΔ) cells expressing 2Cherry-ATG8 and pRS423-VPS13^GFP in a Δvps13 strain background after starvation (1 h). Quantification of Vps13-positive Atg8 structures shown in the right panel (number of independent experiments, n = 4; 200 structures/strain analyzed in total). Scale bars are 2 and 1 µm (zoom in). (F) Fluorescence imaging of cells expressing 2Cherry-ATG8 and either pRS423-VPS13^GFP or pRS423-VPS13^GFPΔC in Δvps13 background after starvation (1 h) and quantification of Vps13-positive Atg8 structures are shown in the right panel (number of independent experiments, n = 4; 200 structures/strain analyzed in total). Scale bars are 2 and 1 µm (zoom in). (G) Western blot analysis of whole cell extracts and quantifications of protein levels of Vps13^GFP and Vps13ΔC^GFP using α-Vps13 and α-Pgk1 antibodies. Data are means ± SD (number of independent experiments, n = 3). (H) Quantification of fluorescent images of Δvps13, Δvps13 Δypt35, and Δvps13 Δmcp1Δypt35Δspo71 (ΔΔΔ) cells expressing 2Cherry-ATG8, pRS423-VPS13^GFP, and pRS425-APE1-BFP after starvation (1 h; number of independent experiments, n = 4; 200 structures analyzed in total). (I) Quantification of the autophagic flux of indicated strains expressing 2GFP-ATG8 during starvation. Data are means ± SD (number of independent experiments, n = 4). (J) Timelapse fluorescence imaging of WT and ΔΔΔ cells expressing 2GFP-ATG8 after starvation (1 h). Simple linear regression of durationtotal and autophagosome size in WT and ΔΔΔ cells after time-lapse fluorescence imaging of yeast cells expressing 2GFP-ATG8 after starvation (1 h; number of independent experiments, n = 3; 30 events/strain analyzed in total). WT data were included in Fig. 1, D–F. Source data are available for this figure: SourceData FS2.
Figure 3.
Figure 3.
Rate-limiting membrane assembly in the absence of Vps13. (A) Time-lapse fluorescence imaging of WT and Δvps13 cells expressing 2GFP-ATG8 after starvation (1 h). Representative timelines for autophagosome biogenesis events are shown as single Z-sections. WT data were included in Fig. 1, D–F (number of independent experiments, n = 6; 60 events/strain analyzed in total). Scale bar is 0.5 µm. (B) Durationmax of autophagosome biogenesis for data shown in A. (C and D) Simple linear regressions of durationmax and autophagosome size for WT (C) and Δvps13 (D) cells. (E) Durationtotal of autophagosome biogenesis for data shown in A. (F and G) Simple linear regressions of durationtotal and autophagosome size for WT (F) and Δvps13 (G) cells. (H) Timelapse fluorescence imaging of WT and Δvps13 cells expressing 2GFP-ATG8 and pRS425-APE1-BFP after starvation (1 h). Representative timelines for phagophore expansion events are shown (number of independent experiments, n = 3; 30 events/strain analyzed in total). Scale bar is 1 µm. (I and J) Simple linear regressions of duration and phagophore size for WT (I) and Δvps13 (J) cells.
Figure 4.
Figure 4.
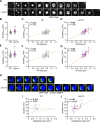
Rate-limiting number of Atg2 proteins during autophagosome biogenesis in the absence of Vps13. (A) Time-lapse fluorescence imaging of WT and Δvps13 cells expressing Cherry-ATG8 and ATG2-3GFP after starvation (1 h; n = 3; 30 events/strain) shown as single Z-sections. Scale bar is 0.5 µm. (B–D) Quantification of data is shown in A. (B) Number of Atg2 molecules at indicated timepoints: start, maximum (max), and end. (C and D) Simple linear regression of the number of Atg2 molecules and autophagosome (AP) size for WT (C) and Δvps13 cells (D). (E) Number of phospholipids transferred per Atg2 molecule and second in vivo. Calculations are based on the model shown in Fig. 1, A–C, and the duration and size of autophagosomes and the number of Atg2 molecules for each event shown in A–D.
Figure 5.
Figure 5.
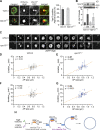
Vps13-mediated PLT is required for non-rate-limiting membrane assembly during autophagosome biogenesis. (A) Fluorescence imaging of indicated strains expressing 2Cherry-ATG8 and pRS423-VPS13^GFP in Δvps13 background after starvation (1 h). Right panel shows quantified data (number of independent experiments, n = 4; 200 structures/strain analyzed in total). Scale bars are 2 and 1 µm (zoom in). (B) Normalized protein levels of genomic and plasmid-based overexpressed (OE, pRS423) Vps13^GFP and Vps13ΔPLT^GFP in growing cells analyzed by whole-cell extraction and Western blot quantification using α-Vps13 and α-Pgk1 antibodies. (C) Time-lapse fluorescence imaging of WT and vps13ΔPLT cells expressing 2GFP-ATG8 after starvation (1 h; number of independent experiments, n = 3; 30 events/strain analyzed in total). Representative timelines of autophagosome biogenesis are shown as single Z-sections. Scale bar is 0.5 µm. WT data were included in Fig. 1, D–F. (D and E) Quantification of data shown in C. (D and E) Simple linear regression of durationmax and autophagosome (AP) size in WT (D) and vps13ΔPLT cells (E). (F and G) Simple linear regression of durationtotal and autophagosome (AP) size in WT (F) and vps13ΔPLT cells (G). (H) Model for parallel PLT via the conserved PLT proteins Vps13 and Atg2 driving phagophore expansion after nucleation from Atg9 and COPII vesicles during autophagosome biogenesis. Source data are available for this figure: SourceData F5.
Figure S3.
Figure S3.
Deficient Vps13-mediated PLT does not affect autophagy capacity. (A–D) Fluorescence imaging of indicated strains expressing 2GFP-ATG8 after starvation (1 h). (A and B) Quantification of the number of Atg8 puncta (A) and autophagosomes (APs; B) per cell (number of independent experiments, n = 4; 200 cells/strain analyzed in total). (C and D) Autophagosome size distribution (C) and durationtotal of autophagosome biogenesis (D). Data are means ± SD (number of independent experiments, n = 4; 40 APs/strain analyzed in total). (E) Autophagic flux of indicated strains expressing 2GFP-ATG8 at indicated time points of starvation analyzed by whole-cell extraction and Western blot analysis using an α-GFP antibody. Data are means ± SD (number of independent experiments, n = 4). Source data are available for this figure: SourceData FS3.

References

    1. Adlakha, J., Hong Z., Li P., and Reinisch K.M.. 2022. Structural and biochemical insights into lipid transport by VPS13 proteins. J. Cell Biol. 221:221. 10.1083/jcb.202202030 - DOI - PMC - PubMed
    1. Anding, A.L., Wang C., Chang T.K., Sliter D.A., Powers C.M., Hofmann K., Youle R.J., and Baehrecke E.H.. 2018. Vps13D encodes a ubiquitin-binding protein that is required for the regulation of mitochondrial size and clearance. Curr. Biol. 28:287–295.e6. 10.1016/j.cub.2017.11.064 - DOI - PMC - PubMed
    1. Axe, E.L., Walker S.A., Manifava M., Chandra P., Roderick H.L., Habermann A., Griffiths G., and Ktistakis N.T.. 2008. Autophagosome formation from membrane compartments enriched in phosphatidylinositol 3-phosphate and dynamically connected to the endoplasmic reticulum. J. Cell Biol. 182:685–701. 10.1083/jcb.200803137 - DOI - PMC - PubMed
    1. Bean, B.D.M., Dziurdzik S.K., Kolehmainen K.L., Fowler C.M.S., Kwong W.K., Grad L.I., Davey M., Schluter C., and Conibear E.. 2018. Competitive organelle-specific adaptors recruit Vps13 to membrane contact sites. J. Cell Biol. 217:3593–3607. 10.1083/jcb.201804111 - DOI - PMC - PubMed
    1. Biazik, J., Ylä-Anttila P., Vihinen H., Jokitalo E., and Eskelinen E.L.. 2015. Ultrastructural relationship of the phagophore with surrounding organelles. Autophagy. 11:439–451. 10.1080/15548627.2015.1017178 - DOI - PMC - PubMed

Publication types

MeSH terms

Substances