. 2023 Jul 3;222(7):e202210078.
doi: 10.1083/jcb.202210078. Epub 2023 Apr 28.

Quantitative analysis of autophagy reveals the role of ATG9 and ATG2 in autophagosome formation

Affiliations

Quantitative analysis of autophagy reveals the role of ATG9 and ATG2 in autophagosome formation

David G Broadbent et al. J Cell Biol. .

Abstract

Autophagy is a catabolic pathway required for the recycling of cytoplasmic materials. To define the mechanisms underlying autophagy it is critical to quantitatively characterize the dynamic behavior of autophagy factors in living cells. Using a panel of cell lines expressing HaloTagged autophagy factors from their endogenous loci, we analyzed the abundance, single-molecule dynamics, and autophagosome association kinetics of autophagy proteins involved in autophagosome biogenesis. We demonstrate that autophagosome formation is inefficient and ATG2-mediated tethering to donor membranes is a key commitment step in autophagosome formation. Furthermore, our observations support the model that phagophores are initiated by the accumulation of autophagy factors on mobile ATG9 vesicles, and that the ULK1 complex and PI3-kinase form a positive feedback loop required for autophagosome formation. Finally, we demonstrate that the duration of autophagosome biogenesis is ∼110 s. In total, our work provides quantitative insight into autophagosome biogenesis and establishes an experimental framework to analyze autophagy in human cells.


Conflict of interest statement

Disclosures: The authors declare no competing interests exist.

Figures
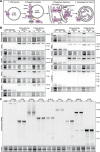
Figure 1.
Figure 1.
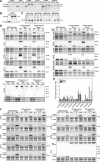
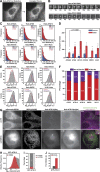
A HaloTag-based platform for quantitative analysis of autophagy in human cells. (A) Model showing autophagy factors and the complexes they form from phagophore initiation, toward phagophore expansion and autophagosome closure. Proteins tagged in this study are indicated in pink. (B) Western blots of autophagy proteins showing size shift of the tagged protein and exclusive expression of the tagged protein in comparison to the parental U2OS cell line. Three concentrations (100, 50, and 25% of initial lysis volume) were loaded on the gel. (C) Fluorescence gel showing gene tagging; two distinct monoclonal lines (C1 and C2) were selected for each edited gene. Cell lines were labeled with saturating amounts of HaloTag ligand JF646 (250 nM, 30 min). Source data are available for this figure: SourceData F1.
Figure S1.
Figure S1.
Validation and functional characterization of genome-edited clones expressing HaloTagged autophagy factors. (A and B) PCR analysis from genomic DNA of genome-edited clones for verifying the correct insertion of the HaloTag at the autophagy loci. For amplifying the insertion, primers outside the homology arms region were designed. The edited clones show an expected shift of ∼2 kb on the PCR product, corresponding to the 3xFlag-HaloTag insert. (C) PCR analysis from genomic DNA of genome-edited clones for verifying the correct insertion of the HaloTag in the high GC-rich ULK1 and WIPI2 gene loci. For amplifying the insertion, primers outside the homology arms and inside the 3xFlag-HaloTag regions were designed. The edited clones show a PCR product, which is absent in the parental U2OS cell line. (D) Western blots for determining the expression levels of the HaloTagged autophagy proteins relative to the wildtype protein before and after removal of HaloTag using the TEV protease. (E) Quantification of the Western blots (A), showing the ratio between HaloTag and parental cell line (N = 3, mean ± SD). (F) Western blot analysis of LC3 levels in parental and genome-edited cell lines in control (Ctr) and upon treatment with rapamycin (R, 100 nM for 2 h), or rapamycin + bafilomycin (R+B, 100 nM each, for 2 h). Source data are available for this figure: SourceData FS1.
Figure S2.
Figure S2.
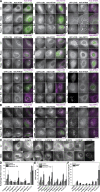
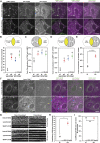
Autophagy induced foci formation by HaloTagged autophagy proteins. (A) Live-cell imaging of GFP-LC3 and JF646-labeled HaloTagged proteins in control (Ctr) and upon treatment with rapamycin (Rapa, 100 nM for 2 h) or rapamycin + bafilomycin (Rapa+Baf, 100 nM each, for 2 h). Both treatments show an expected increase in autophagy and LC3 foci. Scale bar = 10 μm. (B) IF with anti-LC3B antibody and HaloTag JF646 labeling for Halo-ATG5, Halo-ATG16, and Halo-WIPI2 cell lines in control (Ctr) and upon treatment with rapamycin (Rapa, 100 nM for 2 h) or rapamycin + bafilomycin (Rapa+Baf, 100 nM each, for 2 h). Both treatments show an expected increase in autophagy and LC3 foci. Scale bar = 10 μm. (C) Representative images of JF646-labeled HaloTagged proteins under control (Ctr) or EBSS starvation media, demonstrating foci-forming ability upon autophagy induction. Scale bar = 10 μm. (D) Quantification of autophagy factor foci from live-cell imaging (A). Data represent the mean ± 1SD of three biological replicates. (E) Quantification of LC3 foci from live-cell imaging (A; N = 3, mean ± SD). (F) Quantification of autophagy factor foci from live-cell imaging (C; N = 3, mean ± SD).
Figure 2.
Figure 2.
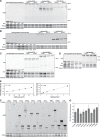
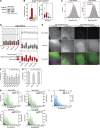
Absolute protein abundance quantification of autophagy factors in human cells. (A) Example in-gel fluorescence containing the quantification standards (HaloTag + cell lysate) and ATG13 protein. (B) Histogram of flow cytometry measurements depicting the relative protein abundances of U2OS (negative control), and two clones of cells expressing Halo-ATG2A and Halo-WIPI2. (C) Corrected protein abundance quantification of the tagged autophagy proteins with in-gel fluorescence and flow cytometry (N = 3, mean ± SD including error propagation). (D) Graph showing the correlation between protein abundance measured by flow cytometry compared to in-gel fluorescence. Source data are available for this figure: SourceData F2.
Figure S3.
Figure S3.
Absolute protein abundance quantification of HaloTagged autophagy factors. (A–D) Representative fluorescence gels for the absolute quantification of the autophagy proteins. (E) Standard curve for cell number using stain-free gels (left) and florescent HaloTag protein (right), demonstrating an excellent correlation between intensity and gel loadings. (F) Representative fluorescence gel of HaloTagged proteins in the absence or presence of TEV protease. (G) Ratio of HaloTag fluorescence in the absence and presence of TEV protease (B; N = 3, mean ± SD). Source data are available for this figure: SourceData FS3.
Figure 3.
Figure 3.
Live-cell single-molecule analysis of autophagy proteins. (A and B) Example of single-particle tracking of (A) ATG9 and (B) ATG16, and the corresponding fitting of the step-size probability distribution with SpotON algorithm. Numbers inside the micrographs indicate the imaging frame associated with the track. Movies were acquired at 6.8 ms per frame, scale bar = 1 μm. (C) Results of diffusive analysis for the HaloTagged autophagy proteins under control and EBSS starvation. Top three panels present the diffusion coefficients of the tracks based on the SpotON analysis. Bottom panel depicts the percentage associated with each fraction. The box indicates confidence interval ± SD, the square indicates the average, and the horizontal line is the median; for each condition, three biological replicates were analyzed, ∼20 cells/replicate.
Figure 4.
Figure 4.
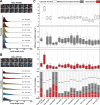
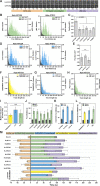
High-throughput quantification of autophagy factor foci lifetime and diffusion dynamics. (A) Upon labeling with fluorescent dye (JF646), cells expressing HaloTagged autophagy factors were starved (EBSS) and imaged at four frames per minute for 1 h. TrackIT was used to detect foci based on threshold intensity (left) and connected into tracks using the nearest neighbor algorithm (right). Scale bar = 5 μm. (B) Example images of foci for Halo-ATG2A (upper panel) and Halo-ATG13 (bottom panel). Scale bar = 1 μm. (C) Histograms of foci lifetime for the HaloTagged autophagy proteins in control conditions (Control) and after 1 h nutrient starvation (EBSS). Three biological replicates (20–30 cells per replicate) were performed for each HaloTag cell line. The number of data points (n) is indicated in each graph in the figure panels. (D) Quantification of the number of foci formed per cell by autophagy factors over the course of 1 h imaging in control (Control) and nutrient starvation (EBSS) conditions (N = 3 biological replicates, mean ± SD). A two-tailed t test was used for statistical analysis (*P < 0.05). (E) Histograms of diffusion coefficients of the foci formed by autophagy factors under nutrient starvation. Histograms were fitted with Gaussian curves. For the proteins other than Halo-ATG2A, we fixed the mean of one subpopulation (in red) to match Halo-ATG2A mean. An additional subpopulation (in purple) represents non-ATG2A-like foci. The black line represents the cumulative fitting. (F) Distribution of ATG2A-like and non-ATG2A-like foci diffusion coefficients (N = 3 biological replicates, mean ± SD). (G) Co-localization of ATG13 foci with the ER in control conditions (siCTR) or CHMP2A knock-down (siCHMP2A) cells. The ER was marked with mEmerald-SEC61, and high-resolution images were generated using the CARE algorithm. Halo-ATG13 foci were scaled at low (1×) and high (2.5×) brightness. Scale bar = 5 μm. (H) Histogram of step-size distribution of Halo-ATG2A-positive (H-ATG2A+, red) and Halo-ATG2A-negative (H-ATG2A−, gray) GFP-ATG13 foci. Three biological replicates (20–30 cells per replicate) were performed for each experiment. (I) Fraction of GFP-ATG13 foci showing accumulation of Halo-ATG2A (N = 3 biological replicates, mean ± SD). (J) GFP-ATG13 foci lifetime for Halo-ATG2A+ and Halo-ATG2A− populations (N = 3 biological replicates, mean ± SD).
Figure S4.
Figure S4.
Quantification of diffusion and kinetic properties of HaloTagged autophagy proteins and autophagy induced foci. (A) Western blot showing partial depletion of CHMP2A in Halo-ATG13 cell line upon siRNA-mediated knockdown. (B) Graphs depicting foci frequency and foci lifetimes of ATG13 in complete media or EBSS treated with VPS34 inhibitor compound 31. Data represent mean ± SD. Letters indicate statistically homogenous groups established by ANOVA (P < 0.05). (C) Distribution of diffusion coefficients for Halo-ATG2A and Halo-ATG2A foci imaged a 3-s frame interval. In Halo-ATG13, Gaussian fitting shows two populations with distinct diffusive properties (solid purple and red lines). Cumulative fitting is shown in a solid black line. (D) Results of diffusive analysis for the parental Halo-ATG13 and ULK1, FIP200, and ATG101 knockout under control and EBSS starvation. Left panel depicts the percentage associated with each fraction. Right panels present the diffusion coefficients of the tracks based on the SpotON analysis. Boxes indicate confidence interval ± SD, the square indicates the average, and the horizontal line is the median; for each condition, three biological replicates were analyzed, ∼20 cells/replicate. (E) Images demonstrating the titration of the virus such that the G120A mutant does not form aggregates (left) and positive control in an ATG9A knockout (right). (F) Bar graph representing the average lifetime of GFP-P62 within ATG-edited cell lines. Data represent mean ± SD of three biological replicates (20–30 cells per replicate). Letters indicate statistically homogenous groups established by ANOVA (P < 0.05). (G) Bar graph depicting the average lifetime of GFP-LC3 within ATG-edited cell lines. Data represent mean ± SD of three biological replicates (20–30 cells per replicate). Letters indicate statistically homogenous groups established by ANOVA (P < 0.05). (H and I) Histograms of the lifetime of Halo-Tagged protein foci that colocalized (green) or did not colocalize (dark gray) with (H) GFP-P62 or (I) GFP-LC3 (light blue). Source data are available for this figure: SourceData FS4.
Figure 5.
Figure 5.
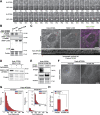
All tracked populations of autophagy factors foci require ULK1 and PI3K activity. (A) Fluorescence gel and Western blots demonstrating successful knockout of ULK1, FIP200, and ATG101 from the Halo-ATG13 cell line. (B) Western blots demonstrating impaired autophagy when ULK1, FIP200, and ATG101 are individually depleted from the Halo-ATG13 cell line. For the treatment experiments, cells were preincubated in control media with ULK1-101 (1 μM) or without drug for 1 h where indicated. Cells were then switched to their control or EBSS starvation media, with or without bafilomycin (100 nM), for an additional hour. (C) Quantification of the Western blots in B. Data represent mean ± SD over three biological replicates. Phospho-P62 band (red striped bar graph) was detected and quantified only in the FIP200 and ATG101 knock-out cell lines. (D) Histograms of Halo-ATG13 foci lifetimes for the parental Halo-ATG13 cells and ULK1, FIP200, ATG101 knock-out cell lines in control conditions (Control) and after 1 h nutrient starvation (EBSS). Three biological replicates (20–30 cells per replicate) were performed for each cell line. The number of data points (n) is indicated in each graph in the figure panels. (E) Quantification of the number of foci formed per cell by HaloTag-ATG13 over the course of 1 h imaging in control (Control) and nutrient starvation (EBSS) conditions (N = 3, mean ± SD). A two-tailed t test was used for statistical analysis. (F) Histograms of foci lifetimes for the HaloTag-ATG2A (left) and HaloTag-ATG13 (center) in control and nutrient starvation (EBSS, 1 h) conditions with and without wortmannin (1 μM). Cells were pretreated with Wortmannin for 1 h. Right panel presents the quantification of the foci frequency. Data represent mean ± SD over three biological replicates (20–30 cells per replicate). A two-tailed t test was used for statistical analysis (*P < 0.05, ***P < 0.001).
Figure 6.
Figure 6.
Analysis of the maturation kinetics of autophagosomes using dual-color imaging. (A) Example images showing formation, growth, and disappearance of colocalized Halo-ATG13 and GFP-p62 foci using dual-color live-cell imaging under EBSS starvation (1 h). Scale bar = 2 μm. (B) Histograms of the lifetimes of Halo-ATG2A and Halo-ATG13 foci that colocalized (green) or did not colocalize (dark gray) with virally transduced GFP-P62. (C) Percentage of HaloTagged autophagy protein foci that colocalized with P62 foci. Data represent mean ± SD of three biological replicates (20–30 cells per replicate). A two-tailed t test was used for statistical analysis. (D) Histograms of the lifetimes of Halo-ATG2A and Halo-ATG13 foci that colocalized (light blue) or did not colocalize (dark gray) with virally transduced GFP-LC3. (E) Percentage of HaloTagged autophagy protein foci that colocalized with LC3 foci. Data represent mean ± SD of three biological replicates (20–30 cells per replicate). A two-tailed t test was used for statistical analysis. (F–H) Histograms of the lifetimes of Halo-ATG13 foci that colocalized or did not colocalize (dark gray) with (F) GFP-GABARAPL1 (yellow), (G) GFP-LC3 (light blue), (H) GFP-p62 (green) stably expressed from an AAVS1 locus insertion. (I) Percentage of HaloTagged autophagy protein foci that colocalized with the adaptors GFP-GABARAPL1, GFP-LC3, and GFP-P62 stably expressed from an AAVS1 locus insertion. Data represent mean ± SD of three biological replicates (20–30 cells per replicate). A two-tailed t test was used for statistical analysis. (J) Quantification of the average HaloTagged autophagy protein foci lifetimes for GFP-P62 positive (green) and negative (dark gray) foci. Data represent mean ± SD of three biological replicates (20–30 cells per replicate). (K) Quantification of the average HaloTagged autophagy protein foci lifetimes for GFP-LC3 positive (light blue) and negative (dark gray) foci. Data represent mean ± SD of three biological replicates (20–30 cells per replicate). (L) Quantification of the average Halo-ATG13 foci lifetimes that are negative (dark gray) or positive for adaptor signals (GABARAPL1, yellow; LC3, light blue; P62, green). Data represent mean ± SD of three biological replicates (20–30 cells per replicate). (M) Quantification of the timing of the three distinct phases of autophagosome formation for the HaloTag proteins under EBSS starvation (1 h). Data represent mean ± SD of three biological replicates (20–30 cells per replicate).
Figure 7.
Figure 7.
ATG9 does not detectably accumulate at the site of autophagosome formation. (A) Example image showing the formation of GFP-P62 spot in the absence of any Halo-ATG9A accumulation. Scale bar = 1 μm. (B) Fluorescent gels showing Halo-ATG9A (JFX650, top) and SNAP-LC3B (JFX650, middle) labeling and Western blot showing probed with an LC3 antibody showing the exclusive expression of SNAP-LC3B in genome-edited cells. (C) Micrographs of cells expressing Halo-ATG9A (JFX650) and SNAP-LC3B (JF503; top, scale bar = 10 µm) and kymograph of a SNAP-LC3B spot showing no accumulation of Halo-ATG9A (one frame per second, frames 79–360). (D) Fluorescent gel of SNAP-LC3B (JFX650) after cell starvation and treatment with bafilomycin, demonstrating lipid conjugation of SNAP-LC3B (bottom band). (E) Fluorescence gel and Western blots demonstrating successful ATG9A gene knockout from cells expressing Halo-ATG2A. The ATG9A knock-out cells accumulate P62, indicating impaired autophagy. (F) Micrographs showing a decrease of Halo-ATG2A foci when ATG9A is knocked out (scale bar = 10 μm). Halo-ATG9A does not form detectable foci under EBSS starvation (right panel). (G) Histograms of Halo-ATG2A foci lifetime in parental and ATG9A knock-out cells (EBSS, 1 h). (H) Quantification of the number of foci formed per cell over the course of an hour by Halo-ATG2A in control and ATG9A knock-out cells. Data represent mean ± SD of three biological replicates (20–30 cells per replicate). A two-tailed t test was used for statistical analysis (*P < 0.05). Source data are available for this figure: SourceData F7.
Figure 8.
Figure 8.
ATG9 compartments that co-localize with LC3 foci are lysosomes. (A) Micrographs showing the cellular distribution of transiently expressed RFP-ATG9A, endogenous Halo-ATG9A, and lysosomes, marked with mNeon-LAMP1. Experiments were performed immediately (upper panel) and 24 h (bottom panel) after labeling Halo-ATG9A. Scale bar = 10 μm. (B–E) Quantification of Halo-ATG9A and RFP-ATG9A tracks colocalized with mNeon-LAMP1. The number of cells (n) is indicated in each graph in the figure panels. Top schemes depict which signals were used to calculate the fractions in the corresponding graph. The marker represents mean ± 95% confidence interval. Letters indicate a statistically homogeneous group established by ANOVA (P < 0.05) followed by Bonferroni post-hoc test. (F) Micrographs showing the cellular distribution of endogenous edited SNAP-LC3 and Halo-ATG9A, and lysosomes, marked with LysoTracker. Experiments were performed immediately (upper panel) and 24 h (bottom panel) after Halo-ATG9A labeling. Scale bar = 10 µm. (G) Kymographs showing colocalization of SNAP-LC3/Halo-ATG9A immediately and 24 h after Halo-ATG9A labeling. (H) Number of co-diffusing Halo-ATG9A and SNAP-LC3 foci immediately and 24 h after Halo-ATG9A labeling. The marker represents mean ± 95% confidence interval (*P < 0.05). The number of data points (n) is indicated in each graph in the figure panels. (I) Fraction of colocalized SNAP-LC3 and Halo-ATG9A foci that also colocalized with lysosomes marked with LysoTracker. The marker represents mean ± 95% confidence interval.
Figure S5.
Figure S5.
Pulse-chase analysis of Halo-ATG9 localization and degradation. (A) Representative micrographs of U2OS and Halo-ATG9A knockout (KO) cells pulse-labeled with JFX650 HaloTag ligand at 0 and 24 h after labeling to demonstrate the level of background fluorescence in the absence of a Halo-ATG9A. Left panel: fluorescence signal; right panel: bright field. (B) Representative micrographs of JFX650 labeled Halo-ATG9A at 0 h (top) and 24 h (bottom) after labeling in the endogenously edited cell line (left) or in the stable tetracycline-inducible Halo-ATG9A add-back in ATG9A knock-out cells (right two panels). ATG9A knock-out cells (same images as in A) were included as a comparison to assess non-specific background signal. (C) Fluorescence gel showing time-dependent cleavage of Halo-ATG9A in cells exposed to a single doxycycline pulse (P) or continuously grown in the presence of doxycycline (C), with progressive accumulation of a lower (∼34 kD) fluorescent band corresponding to the HaloTag protein. (D) Representative micrographs showing the overlap between the endoplasmic reticulum (marked with GFP-SEC61) and RFP-ATG9A. (E) Representative micrographs showing the overlap between Halo-ATG9A and transiently expressed RFP-ATG9A. Source data are available for this figure: SourceData FS5.
Figure 9.
Figure 9.
Model for the biogenesis of the autophagosome. Upon autophagy induction, a ULK1 complex–PI3-kinase feedback loop initiates the assembly of autophagy proteins on an untethered ATG9A vesicle. Approximately half of these prephagophores proceed to be tethered to cellular membranes via ATG2A. Only 20% of the ATG2A-positive phagophores mature to a point where the ATG8 family proteins (LC3, GABARAPL1) and the cargo adaptor P62 are detectably recruited, while the majority (80%) of autophagy protein foci disassemble without forming mature autophagosomes. The formation and growth of a full autophagosome take about 90–145 s. Upon closure, the autophagy proteins dissociate, and the mature autophagosome is untethered and delivered to lysosomes (>60 s).

Comment in

References

    1. Barth, S., Glick D., and Macleod K.F.. 2010. Autophagy: Assays and artifacts. J. Pathol. 221:117–124. 10.1002/path.2694 - DOI - PMC - PubMed
    1. Berg, T.O., Fengsrud M., Strømhaug P.E., Berg T., and Seglen P.O.. 1998. Isolation and characterization of rat liver amphisomes. Evidence for fusion of autophagosomes with both early and late endosomes. J. Biol. Chem. 273:21883–21892. 10.1074/jbc.273.34.21883 - DOI - PubMed
    1. Bright, N.A., Gratian M.J., and Luzio J.P.. 2005. Endocytic delivery to lysosomes mediated by concurrent fusion and kissing events in living cells. Curr. Biol. 15:360–365. 10.1016/j.cub.2005.01.049 - DOI - PubMed
    1. Cattoglio, C., Pustova I., Walther N., Ho J.J., Hantsche-Grininger M., Inouye C.J., Hossain M.J., Dailey G.M., Ellenberg J., Darzacq X., et al. 2019. Determining cellular CTCF and cohesin abundances to constrain 3D genome models. Elife. 8:e40164. 10.7554/eLife.40164 - DOI - PMC - PubMed
    1. Chang, C., Jensen L.E., and Hurley J.H.. 2021a. Autophagosome biogenesis comes out of the black box. Nat. Cell Biol. 23:450–456. 10.1038/s41556-021-00669-y - DOI - PMC - PubMed

Publication types

MeSH terms