. 2023 Jun;145(6):749-772.
doi: 10.1007/s00401-023-02568-y. Epub 2023 Apr 28.

Defects in lysosomal function and lipid metabolism in human microglia harboring a TREM2 loss of function mutation

Affiliations

Defects in lysosomal function and lipid metabolism in human microglia harboring a TREM2 loss of function mutation

Fabia Filipello et al. Acta Neuropathol. 2023 Jun.

Abstract

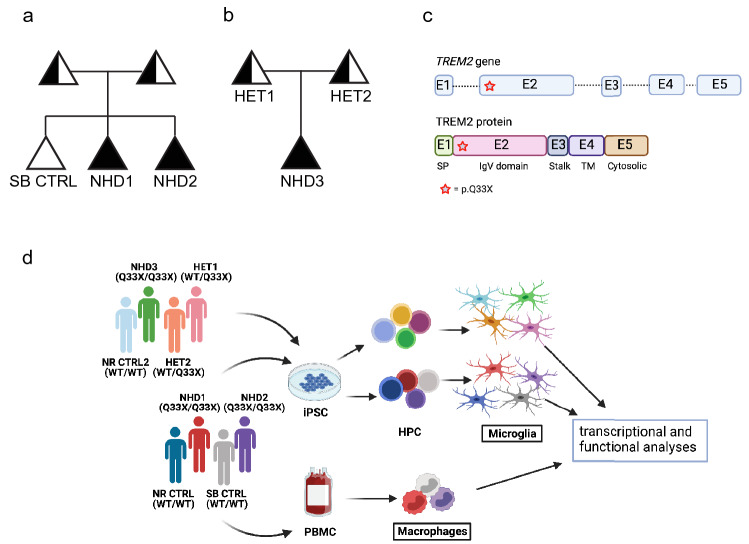
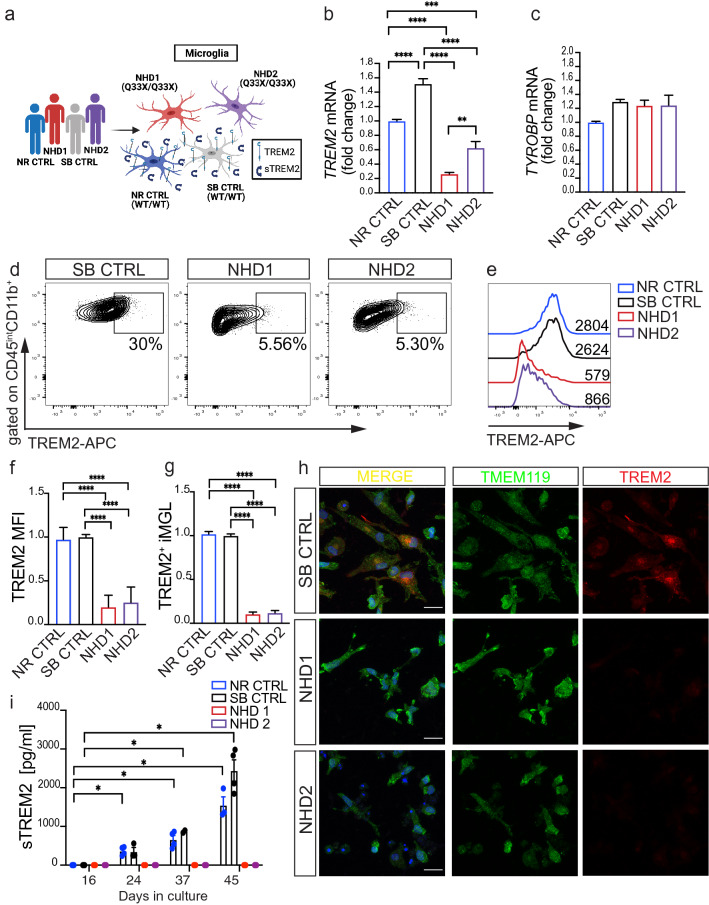
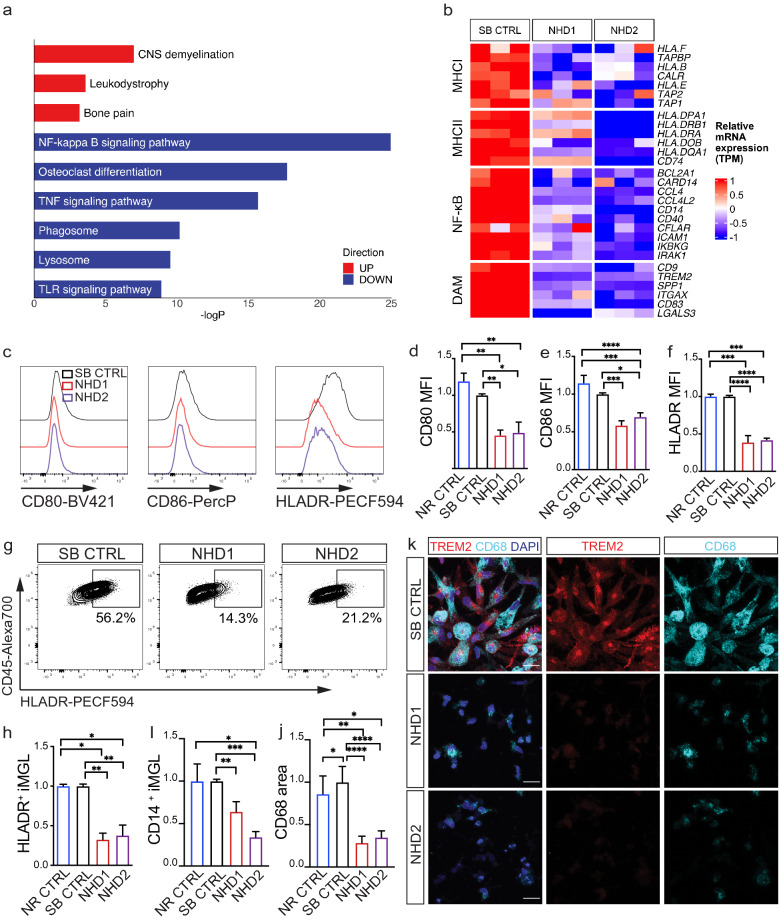
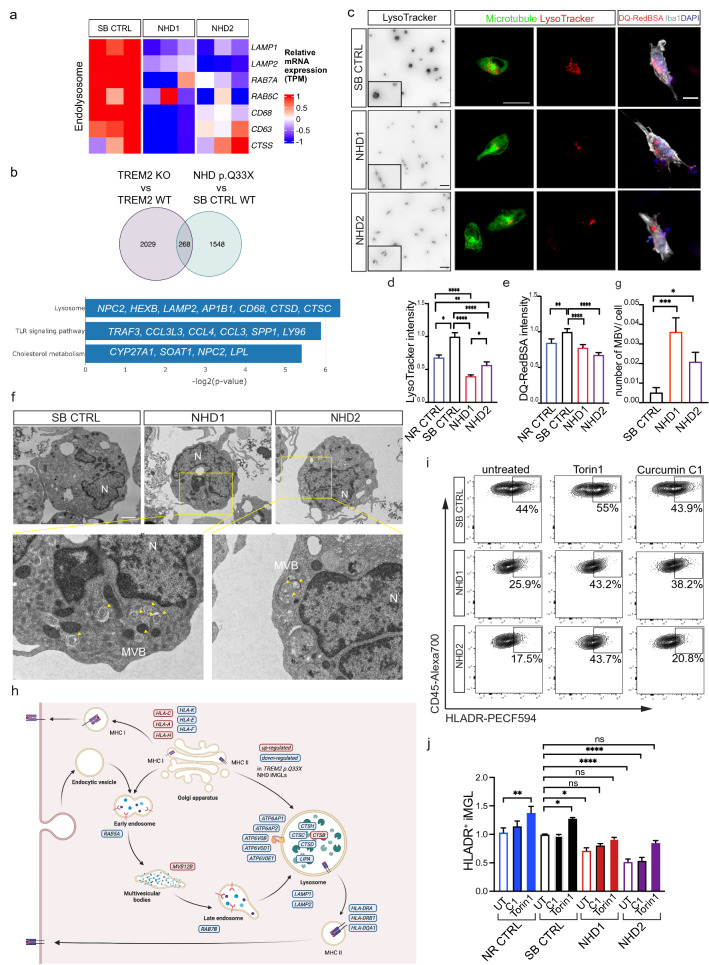
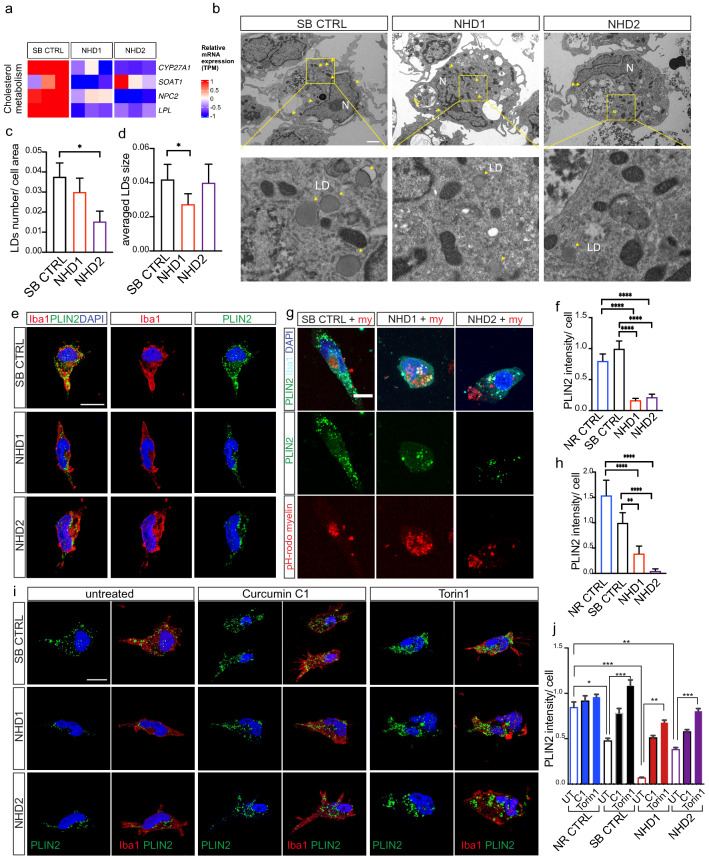
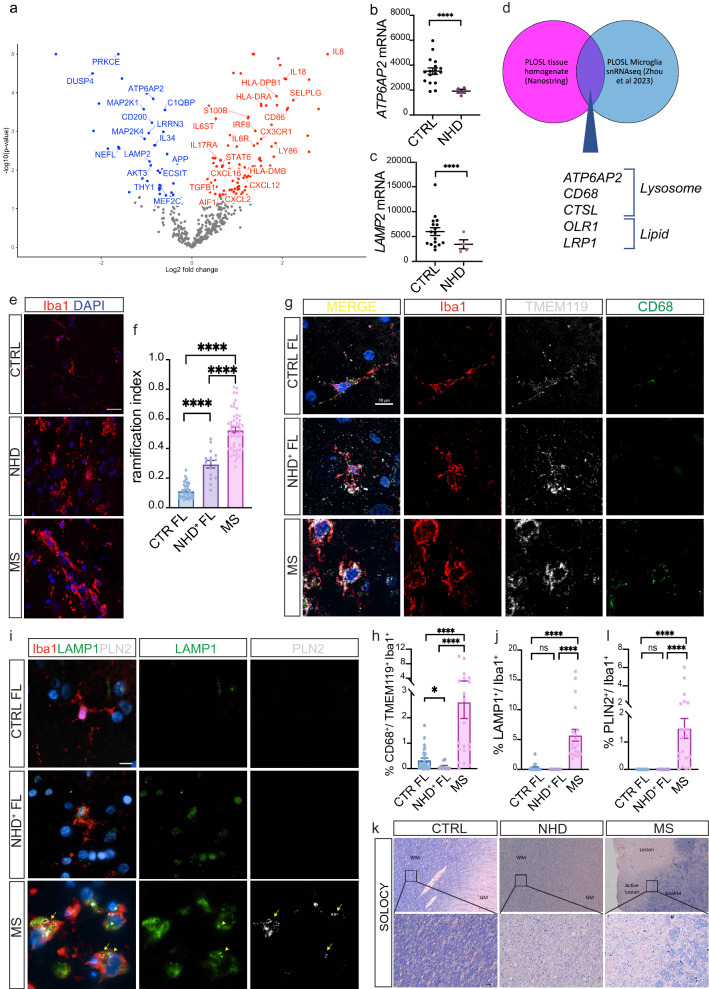
TREM2 is an innate immune receptor expressed by microglia in the adult brain. Genetic variation in the TREM2 gene has been implicated in risk for Alzheimer's disease and frontotemporal dementia, while homozygous TREM2 mutations cause a rare leukodystrophy, Nasu-Hakola disease (NHD). Despite extensive investigation, the role of TREM2 in NHD pathogenesis remains poorly understood. Here, we investigate the mechanisms by which a homozygous stop-gain TREM2 mutation (p.Q33X) contributes to NHD. Induced pluripotent stem cell (iPSC)-derived microglia (iMGLs) were generated from two NHD families: three homozygous TREM2 p.Q33X mutation carriers (termed NHD), two heterozygous mutation carriers, one related non-carrier, and two unrelated non-carriers. Transcriptomic and biochemical analyses revealed that iMGLs from NHD patients exhibited lysosomal dysfunction, downregulation of cholesterol genes, and reduced lipid droplets compared to controls. Also, NHD iMGLs displayed defective activation and HLA antigen presentation. This defective activation and lipid droplet content were restored by enhancing lysosomal biogenesis through mTOR-dependent and independent pathways. Alteration in lysosomal gene expression, such as decreased expression of genes implicated in lysosomal acidification (ATP6AP2) and chaperone mediated autophagy (LAMP2), together with reduction in lipid droplets were also observed in post-mortem brain tissues from NHD patients, thus closely recapitulating in vivo the phenotype observed in iMGLs in vitro. Our study provides the first cellular and molecular evidence that the TREM2 p.Q33X mutation in microglia leads to defects in lysosomal function and that compounds targeting lysosomal biogenesis restore a number of NHD microglial defects. A better understanding of how microglial lipid metabolism and lysosomal machinery are altered in NHD and how these defects impact microglia activation may provide new insights into mechanisms underlying NHD and other neurodegenerative diseases.

Keywords: Induced pluripotent stem cells; Lysosome; Microglia; Nasu-Hakola disease; TREM2; Transcriptomics.


Conflict of interest statement

The authors declare that there is no conflict of interest.

Figures

Fig. 1
Fig. 1
TREM2 p.Q33X variant in two families affected by NHD. a and b NHD family pedigrees. Black symbols denote individuals clinically affected by NHD who carry the homozygous Q33X mutation in TREM2 (NHD1, NHD2, and NHD3). White symbols denote a clinically healthy, non-carrier family member (SB CTRL). Half shaded symbols denote heterozygous TREM2 p.Q33X carriers (HET1 and HET2). Analyses presented in this manuscript were performed on the three siblings belonging to the first NHD family (SB CTRL, NHD1 and NHD2) and one unrelated control (NR CTRL). For the NHD second family, analyses were performed on two parents (HET1 and HET2), their affected child (NHD3), and one unrelated control (NR CTRL2). Triangles are used to anonymize pedigree. c Schematic representation of the human TREM2 gene (top) and protein (bottom). TREM2 gene showing exonic (numbered boxes) and intronic (line) regions. The Q33X mutation is located in exon 2 (indicated as a red star). d Study design depicting the bioinformatic and cellular analyses performed in this study. iPSC-derived human microglia (iMGLs) were generated from iPSCs (all donor lines), while human macrophages were purified from peripheral blood mononuclear cells (PBMCs)-derived from the same donors (NHD1, NHD2 and SB CTRL). Fully differentiated iMGLs and macrophages were assayed for molecular and biochemical analyses
Fig. 2
Fig. 2
TREM2 p.Q33X mutation abolishes cell surface expression of TREM2 receptor on iMGLs and abrogates sTREM2 production. a Diagram representing patient-derived iMGLs from NR CTRL, SB CTRL, NHD1 and NHD2 lines. b and c RT-qPCR of TREM2 and TYROBP mRNA in NR CTRL, SB CTRL, NHD1 and NHD2 iMGLs. ***P < 0.001, ****P < 0.0001, One-way ANOVA with Tukey’s post hoc test. Data are pooled from two independent experiments. d-g FACS analysis of TREM2 receptor expression at iMGL cell surface. d Representative dot plots showing the percentage of TREM2+ cells in the CD45int CD11b+ population. e Representative histogram of TREM2 mean fluorescent intensity (MFI) in SB CTRL, NHD1 and NHD2 iMGLs. f Quantification of TREM2 MFI and g TREM2+ iMGLs in NR CTRL, SB CTRL, NHD1 and NHD2 iMGLs. ****P < 0.0001, One-way ANOVA with Tukey’s post hoc test. Data are pooled from four independent experiments. h Representative confocal images of iMGLs from SB CTRL, NHD1 and NHD2 stained for TMEM119 (green), TREM2 (red) and DAPI (blue). Scale bar, 10 μm. i Media from NR CTRL, SB CTRL, NHD1 and NHD2 iMGLs were collected during iMGLs differentiation and sTREM2 was measured by ELISA. *P < 0.05, Two-way ANOVA with Dunnett’s post hoc test. Data are pooled from two independent experiments. Data shown are mean ± SEM
Fig. 3
Fig. 3
Defective immune activation in NHD iMGLs. a Pathway analysis of protein coding differentially expressed genes (DEG) in NHD versus SB CTRL iMGLs (SB CTRL, NHD1, NHD2; n = 3 replicates/line; EnrichR; DEG are defined by FDR < 0.05, DEGs in Supplementary Table 2, online resource). b Heatmap of DEGs belonging to MHC I, MHC II, NF-κB and DAM pathways in iMGLs. c Representative histograms. d-f relative quantification performed by FACS showing cell surface d CD80, e CD86 and f HLA-DR MFIs in NR CTRL, SB CTRL, NHD1 and NHD2 iMGLs. g Representative dot plots showing the percentage (%) HLA-DR+ cells in SB CTRL, NHD1 and NHD2 iMGLs. h Quantification of % HLA-DR+ and i) CD14+ cells in NR CTRL, SB CTRL, NHD1 and NHD2 iMGLs. *P < 0.5, **P < 0.01, ***P < 0.001, ****P < 0.0001, One-way ANOVA with Tukey’s post hoc test. Data are pooled from four independent experiments. j Quantification of CD68 area in NR CTRL, SB CTRL, NHD1 and NHD2 iMGLs. k Representative confocal images of iMGLs stained for CD68 (cyan), TREM2 (red) and DAPI (blue). *P < 0.05, **P < 0.01, ****P < 0.0001, One-way ANOVA with Kruskal Wallis test and Dunn’s multiple comparison test. Data are pooled from two independent experiments. Data shown are mean ± SEM
Fig. 4
Fig. 4
Lysosomal defects and multivesicular body accumulation in NHD iMGLs. a Heatmap of differentially expressed endo-lysosomal genes LAMP1, LAMP2, RAB7A, CTSS, CD63, CD68, RAB5C in iMGLs from NHD versus SB CTRL. b Venn diagram of downregulated genes shared between CRISPR/Cas9-engineered TREM2 knockout (KO) versus WT published in [67] and NHD versus SB CTRL (p < 0.05; common DEGs = 268) and pathway analysis of the 268 DEGs in common between TREM2 KO versus WT and NHD versus SB CTRL iMGLs. c Left panel, representative fluorescent images (in black and white) of iMGLs stained with LysoTracker Red. Insets represent enlarged images of cells. Scale bar, 10 μm. Middle panel, confocal images of LysoTracker Red (red) and microtubule (ViaFluor® 488, green) staining in iMGLs. Scale bar, 20 μm. Right panel, confocal images of iMGLs stained with DQ-Red-BSA (red), Iba1 (grey) and DAPI (blue). Scale bar 10 μm. d-e Quantification of d LysoTracker and e DQ-Red-BSA intensity in NR CTRL, SB CTRL, NHD1 and NHD2 iMGLs; CTCF values are normalized to SB CTRL. LysoTracker: NR CTRL n = 127 cells; SB CTRL = 156 cells, NHD1 n = 168 cells; NHD2 n = 107 cells. DQ-Red-BSA: NR CTRL n = 131 cells; SB CTRL = 141 cells, NHD1 n = 177 cells; NHD2 n = 145 cells. *P < 0.05, **P < 0.01, ****P < 0.0001, One-way ANOVA with Kruskal Wallis test and Dunn’s multiple comparison test. Data are pooled from two independent experiments. f Representative electron microscopy images of SB CTRL, NHD1 and NHD2 iMGLs and higher magnification. Undigested material (lamellar structures) is detected within multivesicular bodies (MVBs) in NHD1 and NHD2 iMGLs (yellow arrowheads). N, nucleus. Scale bar, 2 μm (top) and 500 nm (bottom). g Quantification of the number of late endosome/MVBs with inclusion bodies normalized per cell area in SB CTRL, NHD1 and NHD2 iMGLs. SB CTRL n = 18 cells; NHD1 n = 18 cells; NHD2 n = 17 cells. *P < 0.05, ***P < 0.001, One-way ANOVA with Kruskal Wallis test and Dunn’s multiple comparison test. h) Diagram representing the upregulated (red) and downregulated (blue) genes in NHD iMGLs compared to SB CTRL belonging to lysosomal and phagocytic pathways. Adapted from BioRender (2022). Endocytic Pathway Comparison (Layout). Retrieved from https://app.biorender.com/biorender-templates/t-61fd5292e07d3d00a5bd4c21-endocytic pathway-comparison-layout. i Representative dot plots showing the % of HLA-DR+ iMGLs in SB CTRL, NHD1 and NHD2 iMGLs untreated or pre-treated with Torin1 (250 nM) or with the curcumin analog C1 (1 μM). j Quantification of % of HLA-DR +  iMGLs. *P < 0.05, **P < 0.01, ****P < 0.0001. One-way ANOVA with Holm-Šídák's post hoc test. Data are pooled from two independent experiments. Data shown are mean ± SEM
Fig. 5
Fig. 5
NHD iMGLs display reduced number of lipid droplets. a Heatmap of cholesterol pathway genes CYP27A1, SOAT1, NCP2, LPL in iMGLs from NHD versus SB CTRL. b Representative electron microscopy images of SB CTRL, NHD1 and NHD2 iMGLs showing lipid droplets (LD) (yellow arrowheads). At the bottom are enlarged images of the enclosed area. N, nucleus. Scale bar, 2 μm. c Quantification of the number of lipid droplets per cell area in SB CTRL, NHD1 and NHD2 iMGLs. d Quantification of the average of lipid droplets size in SB CTRL; NHD1 and NHD2 iMGLs. SB CTRL n = 18 cells; NHD1 n = 18 cells; NHD2 n = 17 cells. *P < 0.05, One-way ANOVA with Tukey’s post hoc test. e Representative confocal images of Perilipin2 (PLIN2) (green) in Iba-1+ iMGLs (red), DAPI (blue). Scale bar, 10 μm. f Quantification of PLIN2 intensity. NR CTRL n = 77 cells; SB CTRL = 101 cells, NHD1 n = 97 cells; NHD2 n = 69 cells. ****P < 0.0001, One-way ANOVA with Kruskal Wallis test and Dunn’s multiple comparison test. Data are pooled from three independent experiments. g Representative confocal images of PLIN2 (green) in Iba-1+ iMGLs (cyan), DAPI (blue), treated with pH-rodo human myelin (my; red) for 24 h. Scale bar, 10 μm. h PLIN2 intensity quantification in iMGLs treated with pH-rodo human myelin. NR CTRL n = 37 cells; SB CTRL = 39 cells, NHD1 n = 47 cells; NHD2 n = 39 cells. **P < 0.01, ****P < 0.0001, One-way ANOVA with Kruskal Wallis test and Dunn’s multiple comparison test. Data are pooled from two independent experiments. i Representative confocal images of Perilipin2 (PLIN2) (green) in Iba-1+  iMGLs (red), DAPI (blue) in SB CTRL, NHD1 and NHD2 iMGLs untreated or pre-treated with Torin1 (250 nM) or with the curcumin C1 (1 μM). Scale bar, 10 μm. j Quantification of PLIN2 intensity. NR CTRL n = 77 cells; SB CTRL = 101 cells, NHD1 n = 97 cells; NHD2 n = 69 cells. *P < 0.05, **P < 0.01, ***P < 0.001, One-way ANOVA with Kruskal Wallis test and Dunn’s multiple comparison test. Data shown are mean ± SEM
Fig. 6
Fig. 6
Post-mortem tissues from NHD patients display lysosomal and lipid metabolism defects. a NanoString analysis was performed on hippocampi from four NHD patients (one TREM2 D134G; one TREM2 c.482 + 2 T > C; two TYROBP c.141delG) and 17 controls. Volcano plot of DEG between NHD and control brains (p < 0.05). Red: upregulated genes; blue: downregulated genes. b ATP6AP2, and c LAMP2 mRNA (raw counts) from NanoString analysis of NHD versus control brains. ****P < 0.0001. d Venn diagram of DEGs shared between NanoString analysis of PLOS tissues homogenates (hippocampi) versus controls (p < 0.05) and the DEGs of PLOS (n = 3) versus controls (n = 11) in the microglia cluster from snRNA-seq dataset [108] (Supplementary Table 7, online resource). e Representative confocal images of Iba-1+ microglia (red) and DAPI (blue) staining of frontal lobe (FL) regions of a healthy control, one NHD patient (NHD1+ (FL)), and one multiple sclerosis (MS) patient (active lesion in the medulla). Scale bar, 20 μm. f Microglia morphometric analysis of FL regions of three healthy controls, one NHD1+ (FL), and two MS patients. The analysis was performed using a ramification index [RI = 4π × cell area/(cell perimeter)2] that captures microglia cell shape. FL: CTRL n = 38 cells; NHD1+ n = 15 cells; MS n = 50 cells. ****P < 0.0001, analysis was performed between two groups using an Unpaired T test. g Representative fluorescence images of Iba-1+ microglia (red), TMEM119 (gray), CD68 (green) and DAPI (blue) staining of FL regions of a healthy control, one NHD patient (NHD1+ (FL)), and one MS patients (active lesion in the medulla). Scale bar, 10 μm. h Quantification of CD68+ signal per TMEM119+ Iba1+ cell. FL: CTRL n = 28 cells; NHD1+ n = 10 cells; MS n = 20 cells. *P < 0.05, ****P < 0.0001, analysis was performed between two groups using a Mann–Whitney T test. i Representative images of Iba-1+ microglia (red), PLIN2 (grey), LAMP1 (green) and DAPI (blue) staining of FL regions of a healthy control, one NHD patient (NHD1+ (FL)), and one MS patients (active lesion in the medulla). Scale bar, 20 μm. j Quantification of LAMP1 signal per Iba1+ cell. LAMP1 intensity: FL: CTRL n = 17 cells; NHD1+ n = 10 cells; MS n = 20 cells. ****P < 0.0001, analysis was performed between two groups using a Mann–Whitney T test. k White matter (WM) and grey matter (GW) regions with no pathology in one control individual (CTRL), one NHD patient, and one MS patient (normal appearing white matter, NAWM; and active lesions in the white matter, MS ACTIVE) were stained with solochrome cyanine staining (SOLOCY). Original magnification: 4X and 20X; scale bar: 250 μm and 25 μm, respectively. l Quantification of PLIN2 signal per Iba-1+ cell. PLIN2 intensity: FL: CTRL n = 17 cells; NHD1+ n = 10 cells; MS n = 20 cells. ****P < 0.0001, analysis was performed between two groups using a Mann–Whitney T test

References

    1. Abud EM, Ramirez RN, Martinez ES, Healy LM, Nguyen CHH, Newman SA, et al. iPSC-derived human microglia-like cells to study neurological diseases. Neuron. 2017;94:278–293.e279. doi: 10.1016/j.neuron.2017.03.042. - DOI - PMC - PubMed
    1. Adam MP, Ardinger HH, Pagon RA, Wallace SE, Bean LJH, Gripp KW et al (1993) GeneReviews. City
    1. Aoki N, Tsuchiya K, Togo T, Kobayashi Z, Uchikado H, Katsuse O, et al. Gray matter lesions in Nasu-Hakola disease: a report on three autopsy cases. Neuropathology. 2011;31:135–143. doi: 10.1111/j.1440-1789.2010.01152.x. - DOI - PubMed
    1. Badimon A, Strasburger HJ, Ayata P, Chen X, Nair A, Ikegami A, et al. Negative feedback control of neuronal activity by microglia. Nature. 2020;586:417–423. doi: 10.1038/s41586-020-2777-8. - DOI - PMC - PubMed
    1. Ballabio A, Gieselmann V. Lysosomal disorders: from storage to cellular damage. Biochim Biophys Acta. 2009;1793:684–696. doi: 10.1016/j.bbamcr.2008.12.001. - DOI - PubMed

Publication types

Supplementary concepts