. 2023 Jun 28;194(1):70-83.
doi: 10.1093/toxsci/kfad042.

Fetal and neonatal dioxin exposure causes sex-specific metabolic alterations in mice

Affiliations

Fetal and neonatal dioxin exposure causes sex-specific metabolic alterations in mice

Myriam P Hoyeck et al. Toxicol Sci. .

Abstract

Epidemiological studies report associations between early-life exposure to persistent organic pollutants (POPs) and impaired metabolic homeostasis in adulthood. We investigated the impact of early-life exposure to low-dose 2,3,7,8-tetrachlorodibenzo-p-dioxin (TCDD or 'dioxin') on the establishment of β-cell area during the perinatal period, as well as β-cell health and glucose homeostasis later in life. Adult female mice were injected with either corn oil (CO; vehicle control) or TCDD (20 ng/kg/day) 2×/week throughout mating, pregnancy, and lactation; offspring were thus indirectly exposed to maternal TCDD in utero and during lactation, with pollutant exposure ending at weaning. All offspring were maintained on chow diet from weaning until 12-17 weeks of age, after which a subset of CO- and TCDD-exposed offspring were transferred to a 45% high fat diet (HFD) as a metabolic stressor for an additional 10 weeks. TCDD significantly upregulated cytochrome P450 1a1 (Cyp1a1) gene expression in offspring pancreas at birth and weaning, indicating that maternal TCDD directly reaches the developing pancreas. TCDD-exposed pups were transiently hypoglycemic at birth and females were born with reduced % β-cell area, which persisted into adulthood. Early-life TCDD exposure had no persistent long-term effects on glucose homeostasis in chow-fed offspring, but when transferred to HFD, TCDD-exposed female offspring had a delayed onset of HFD-induced hyperglycemia, more pronounced HFD-induced hyperinsulinemia, and increase % PCNA+ β-cells compared with CO-exposed female offspring. This study demonstrates that early-life exposure of mice to TCDD has modest effects on metabolic health in chow-fed offspring but alters metabolic adaptability to HFD feeding in females.

Keywords: diabetes; dioxin; early-life pollutant exposure; hypoglycemia; metabolic adaptability; β-cell mass.


Figures

Figure 1.
Figure 1.
Low-dose TCDD exposure during pregnancy induced Cyp1a1 expression in dam and offspring pancreas. (A) Schematic summary timeline of the study. Female mice were injected with either corn oil (CO) or 20 ng/kg/day TCDD 2×/week during mating and pregnancy (n = 6/group); offspring were indirectly exposed in utero. Dams were euthanized at gestational day (GD) 15.5 or postnatal day 1 (P1). Offspring were euthanized at P1. (B–E) Cyp1a1 and (F–I) Nqo1 gene expression were measured at (B and F) GD15.5 (n = 3–4/experimental group) and (C–E and G–I) P1 in (B, C, F, and G) dams (n = 5–6/group) and (D, E, H, and I) offspring (n = 1–2 pups/sex/litter, n = 5–6 different litters/group). All data is presented as mean±SEM. *p < .05 and **p < .01 versus CO. The following statistical tests were used: (B and H) two-tailed unpaired t test; (C, F, and G) two-tailed unpaired t test for pancreas, Mann–Whitney test for liver; (D and E) Mann–Whitney test; and (I) Mann–Whitney t test for pancreas, two-tailed unpaired test for liver.
Figure 2.
Figure 2.
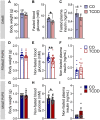
Low-dose TCDD exposure during pregnancy caused hypoglycemia in dams and offspring at postnatal day 1. (A) Body weight at ∼GD15.5, (B) fasted blood glucose at P1, and (C) fasted plasma insulin at P1 in dams. (D and G) Body weight, (E and H) non-fasted blood glucose, and (F and I) non-fasted plasma insulin in offspring at P1, with each dot representing an individual pup (n = 1–9 pups/sex/litter, n = 5–6 different litters/group). All data are presented as mean±SEM. *p < .05 and **p < .01 versus CO. The following statistical tests were used: (A–C, E, F, and H) two-tailed unpaired t test; (D, G, and I) Mann–Whitney test.
Figure 3.
Figure 3.
Low-dose TCDD exposure in utero reduced % β-cell area per islet in female but not male offspring at P1. (A and E) Average islet size, (B and F) % insulin (INS)+ area/islet area, (C and G) % glucagon (GCG)+ area/islet area, and (D and H) % MAFA+INS+ cells/islet in (A–D) female offspring (n = 1 pup/litter, n = 3–6 different litters/group) and (E–H) male offspring (n = 1 pup/litter, n = 4–6 different litters/group). Representative images showing immunofluorescence staining for (I) insulin and glucagon, (J) insulin and MAFA, (K) CK19 and TUNEL, and (L) insulin and TUNEL, including a pancreas section treated with DNase as a positive control. Scale bars = 50 µm. All data are presented as mean±SEM. Individual data points on bar graphs represent biological replicates (ie, different litters); a maximum of 1 male and 1 female pup per litter was used for this analysis. *p < .05 versus vehicle CO. The following statistical tests were used: (A–C and E–H) two-tailed unpaired t test; (D) two-tailed Mann–Whitney test.
Figure 4.
Figure 4.
TCDD-exposed male offspring were transiently hypoglycemic at weaning, but no persistent effects on body weight, blood glucose, or plasma insulin levels were observed in either sex. (A) Schematic summary timeline of the study. A new cohort of female mice were injected with either corn oil (CO) or 20 ng/kg/day TCDD 2×/week during mating, pregnancy, and lactation; offspring were indirectly exposed in utero and postnatally during lactation up until weaning (‘Maternal TCDD Exposure’ window). Male and female offspring were maintained on chow diet until postnatal weeks 12–17 (9–14 weeks following the last TCDD exposure; ‘Post TCDD Exposure’ window). This age range results from the duration of mating, with a 5-week difference between the first and last litters. At postnatal weeks 12–17, a subset of CO- and TCDD-exposed offspring were transferred to a 45% HFD or remained on chow diet for an additional 10 weeks. BW = body weight, BG = blood glucose, GTT = glucose tolerance test, ITT = insulin tolerance test. (B and I) Cyp1a1 gene expression in pancreas and liver of (B) female and (I) male offspring at weaning (n = 1–2/sex/litter, n = 9–10 different litters/group). (C and J) Body weight, (D and K) non-fasted blood glucose, and (E and L) non-fasted plasma insulin levels were measured at postnatal week 3 in (C–E) female and (J–L) male offspring (n = 1–3/sex/litter, n = 8–10 different litters/group). (F and M) Body weight and (G and N) fasting blood glucose were measured weekly between 4 and 16 weeks of age in (F and G) female and (M and N) male offspring (n = 1–3/sex/litter, n = 10 different litters/group). Fasted plasma insulin levels were measured at postnatal weeks 4, 5–6, and 13–17 in (H) females and (O) males (n = 1–3/sex/litter, n = 9–10 different litters/group). All data are presented as mean±SEM. Individual data points on bar graphs represent biological replicates (different mice). *p < .05 and **p < .01 versus CO. The following statistical tests were used: (B, C, and H–O) two-tailed Mann–Whitney test; (F, G, M, N) two-way REML ANOVA with Sidak’s test; and (D and E) two-tailed unpaired t test.
Figure 5.
Figure 5.
TCDD-exposed male offspring showed transient glucose intolerance and reduced glucose-stimulated plasma insulin levels. Glucose tolerance tests (GTTs) and insulin tolerance tests (ITTs) were performed at postnatal week 5–9 (ie, 2–6 weeks post-TCDD) and postnatal week 12–17 (ie, 9–14 weeks post-TCDD) (see Figure 4A for study timeline) (n = 1–3/sex/litter, n = 9–10 different litters/group). (A, D, G, and J) Blood glucose and (B, E, H, and K) plasma insulin levels during GTTs at (A, B, G, and H) postnatal week 5–6 and (D, E, J, and K) postnatal week 14–17 in (A, B, D, and E) female and (G, H, J, and K) male offspring. Blood glucose levels during ITTs at (C and I) postnatal weeks 6–9 and (F and L) postnatal weeks 12–15 in (C and F) female and (I and L) male offspring. ITT values are normalized relative to time zero for each mouse. All data are presented as a line graph and area under the curve. All data are presented as mean±SEM. Individual data points in bar graphs represent biological replicates (different mice). *p < .05 and **p < .01. The following statistical tests were used: (A) line graph, two-way RM ANOVA with Sidak’s test; bar graph, two-tailed Mann–Whitney test; (B–L), line graph, two-way RM ANOVA with Sidak’s test; bar graph, two-tailed unpaired t test.
Figure 6.
Figure 6.
Early-life TCDD exposure increased % fat mass in HFD-fed females but decreased % fat mass in HFD-fed males relative to chow. At postnatal weeks 12–17 (ie, 9–14 weeks post-TCDD), a subset of CO- and TCDD-exposed offspring were transferred to 45% HFD feeding or remained on standard chow for another 10 weeks (‘Metabolic Challenge’; see Figure 4A for study timeline) (n = 1–2/sex/litter, n = 8–10 different litters/group). (A and E) Body weight and (B and F) fasting blood glucose were measured weekly in (A and B) female and (E and F) male offspring; data are presented as a line graph and area under the curve. Fat mass and lean mass were measured by EchoMRI after 9 weeks of HFD feeding in (C) female and (G) male offspring. % fat mass in HFD-fed offspring normalized to their chow-fed counterpart in (D) female and (H) male offspring. All data are presented as mean±SEM. Individual data points in bar graphs represent biological replicates (different mice). *p < .05 and **p < .01. The following statistical tests were used: A, line graph, two-way RM ANOVA with Tukey’s multiple comparison test; bar graph, two-way ANOVA with Tukey’s multiple comparison test; (B, E, and F) line graph, two-way REML ANOVA with Tukey’s multiple comparison test; bar graph, two-way ANOVA with Tukey’s multiple comparison test; (C and G) two-way ANOVA with Tukey’s multiple comparison test; (D and H) two-tailed unpaired t test. The following comparison groups were used for statistical analysis: 1, COHFD versus COChow; 2, TCDDHFD versus COChow; 3, TCDDHFD versus TCDDChow.
Figure 7.
Figure 7.
Early-life TCDD exposure delayed the onset of hyperglycemia and caused more pronounced hyperinsulinemia in HFD-fed female offspring. Glucose tolerance tests (GTTs) were performed after 1.5 and 8 weeks of HFD feeding (see Figure 4A for study timeline) (n = 1–2/sex/litter, n = 8–10 different litters/group). (A, C, E, and G) Blood glucose and (B, D, F, and H) plasma insulin levels at (A, B, E, and F) week 1.5 and (C, D, G, and H) week 8 of HFD feeding in (A–D) female and (E–H) male offspring; data are presented as a line graph and area under the curve. All data are presented as mean±SEM. Individual data points in bar graphs represent biological replicates (different mice). *p < .05 and **p < .01. (A–H) Line graph, two-way REML ANOVA with Tukey’s multiple comparison test; bar graph, two-way ANOVA with Tukey’s multiple comparison test. The following comparison groups were used for statistical analysis: 1, COHFD versus COChow; 2, TCDDHFD versus COChow; 3, TCDDHFD versus TCDDChow; 4, TCDDHFD versus COHFD.
Figure 8.
Figure 8.
TCDDChow female offspring continued to have reduced % β-cell area into adulthood and TCDDHFD females had increased % PCNA+ β cells. Pancreas was harvested from offspring at 10 weeks post-HFD for histological analysis (see Figure 4A for study timeline) (n = 1/sex/litter, n = 4–5 different litters/group). (A and F) Average islet size, (B, C, G, H) % insulin (INS)+ area/islet area, (D and I) % glucagon (GCG)+ area/islet area, and (E and J) % insulin+ PCNA+ cells/pancreas section. (C and H) % insulin (INS)+ area/islet area at P1 and endpoint presented side by side. (I) Representative images showing immunofluorescent staining for insulin and PCNA. Scale bars = 50 μm. All data are presented as mean±SEM. Individual data points in bar graphs represent biological replicates (different mice). The following statistical tests were used: (A, B, D–G, I, and J) two-way ANOVA with Tukey’s multiple comparison test; (C) two-tailed unpaired t test at P1; two-tailed Mann–Whitney test at endpoint; and (H) two-tailed unpaired t test at P1 and endpoint.

References

    1. Aerts R., Van Overmeire I., Colles A., Andjelković M., Malarvannan G., Poma G., Den Hond E., Van de Mieroop E., Dewolf M.-C., Charlet F., et al. (2019). Determinants of persistent organic pollutant (POP) concentrations in human breast milk of a cross-sectional sample of primiparous mothers in Belgium. Environ. Int. 131, 104979. - PubMed
    1. Ashcroft F. M., Rorsman P. (2012). Diabetes mellitus and the β cell: the last ten years. Cell 148, 1160–1171. - PMC - PubMed
    1. Baeyens L., Lemper M., Staels W., De Groef S., De Leu N., Heremans Y., German M. S., Heimberg H. (2018). (Re)generating human beta cells: status, pitfalls, and perspectives. Physiol. Rev. 98, 1143–1167. - PMC - PubMed
    1. Basile G., Kulkarni R. N., Morgan N. G. (2019). How, when, and where do human β-cells regenerate? Curr. Diab. Rep. 19, 48. - PMC - PubMed
    1. Baumert B. O., Goodrich J. A., Hu X., Walker D. I., Alderete T. L., Chen Z., Valvi D., Rock S., Berhane K., Gilliland F. D., et al. (2022). Plasma concentrations of lipophilic persistent organic pollutants and glucose homeostasis in youth populations. Environ. Res. 212, 113296. - PMC - PubMed

Publication types