. 2023 May 30;42(5):112436.
doi: 10.1016/j.celrep.2023.112436. Epub 2023 Apr 26.

PSGL-1 attenuates early TCR signaling to suppress CD8+ T cell progenitor differentiation and elicit terminal CD8+ T cell exhaustion

Affiliations

PSGL-1 attenuates early TCR signaling to suppress CD8+ T cell progenitor differentiation and elicit terminal CD8+ T cell exhaustion

Jennifer L Hope et al. Cell Rep. .

Abstract

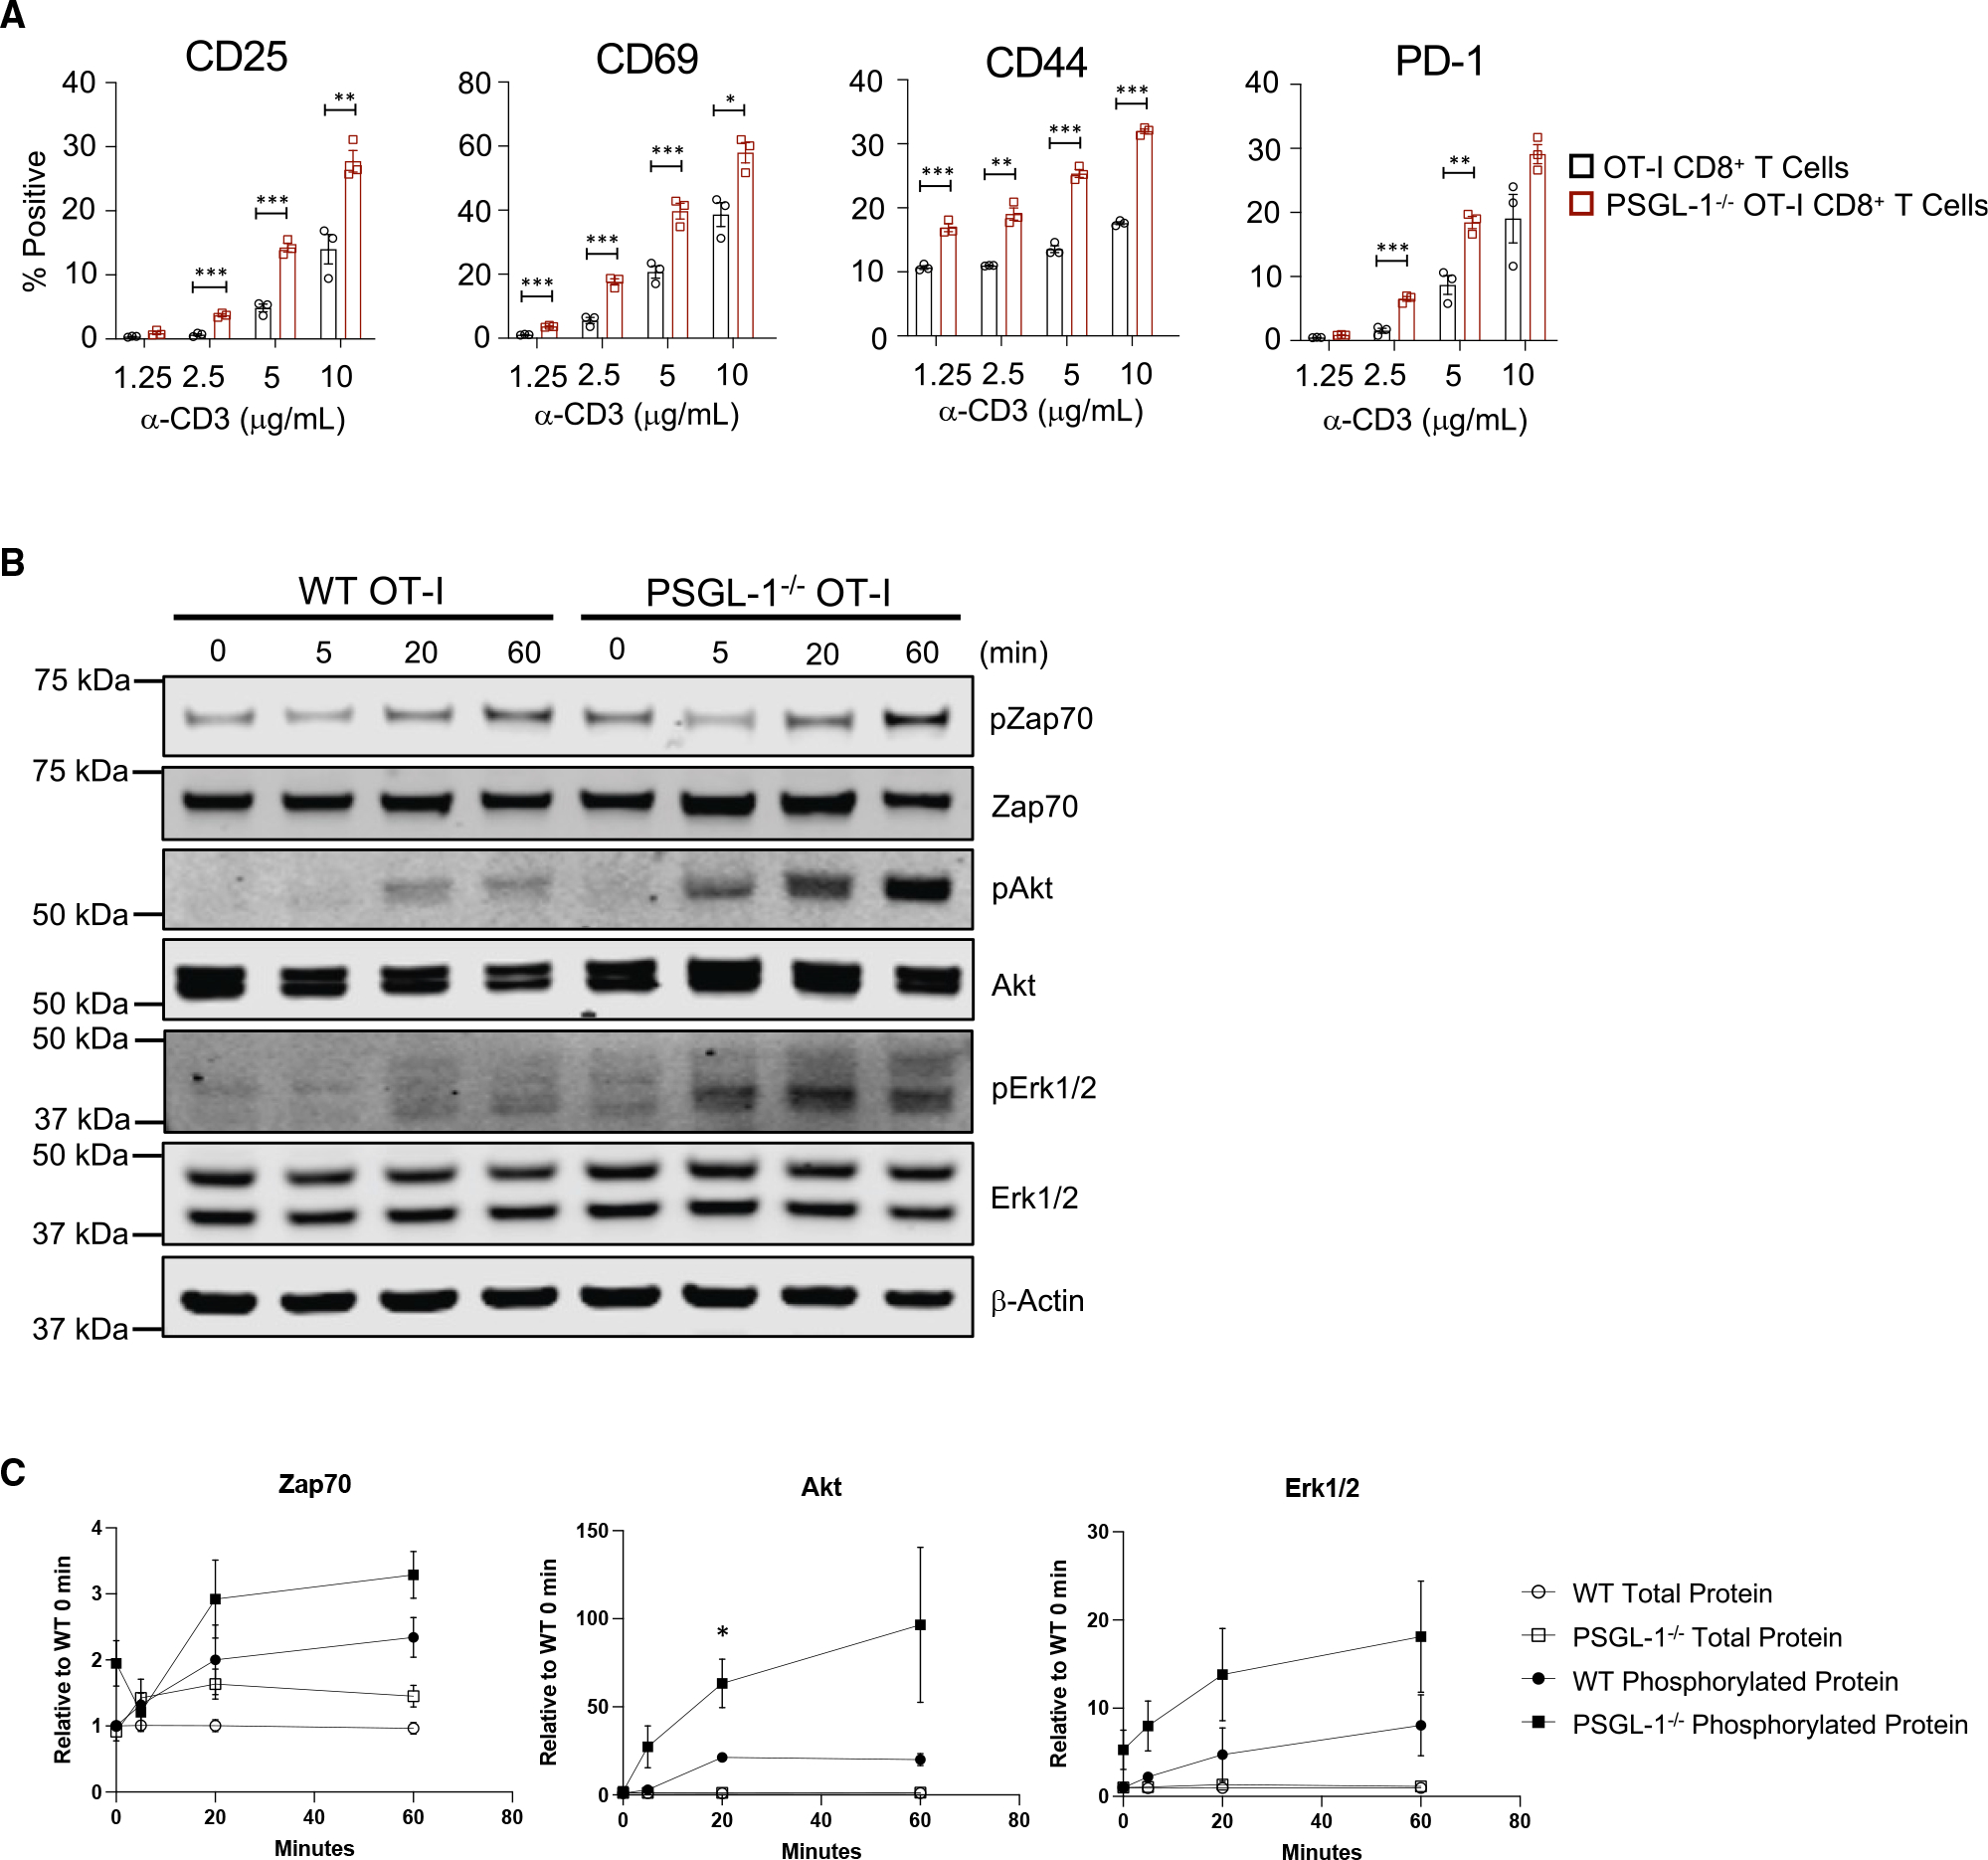
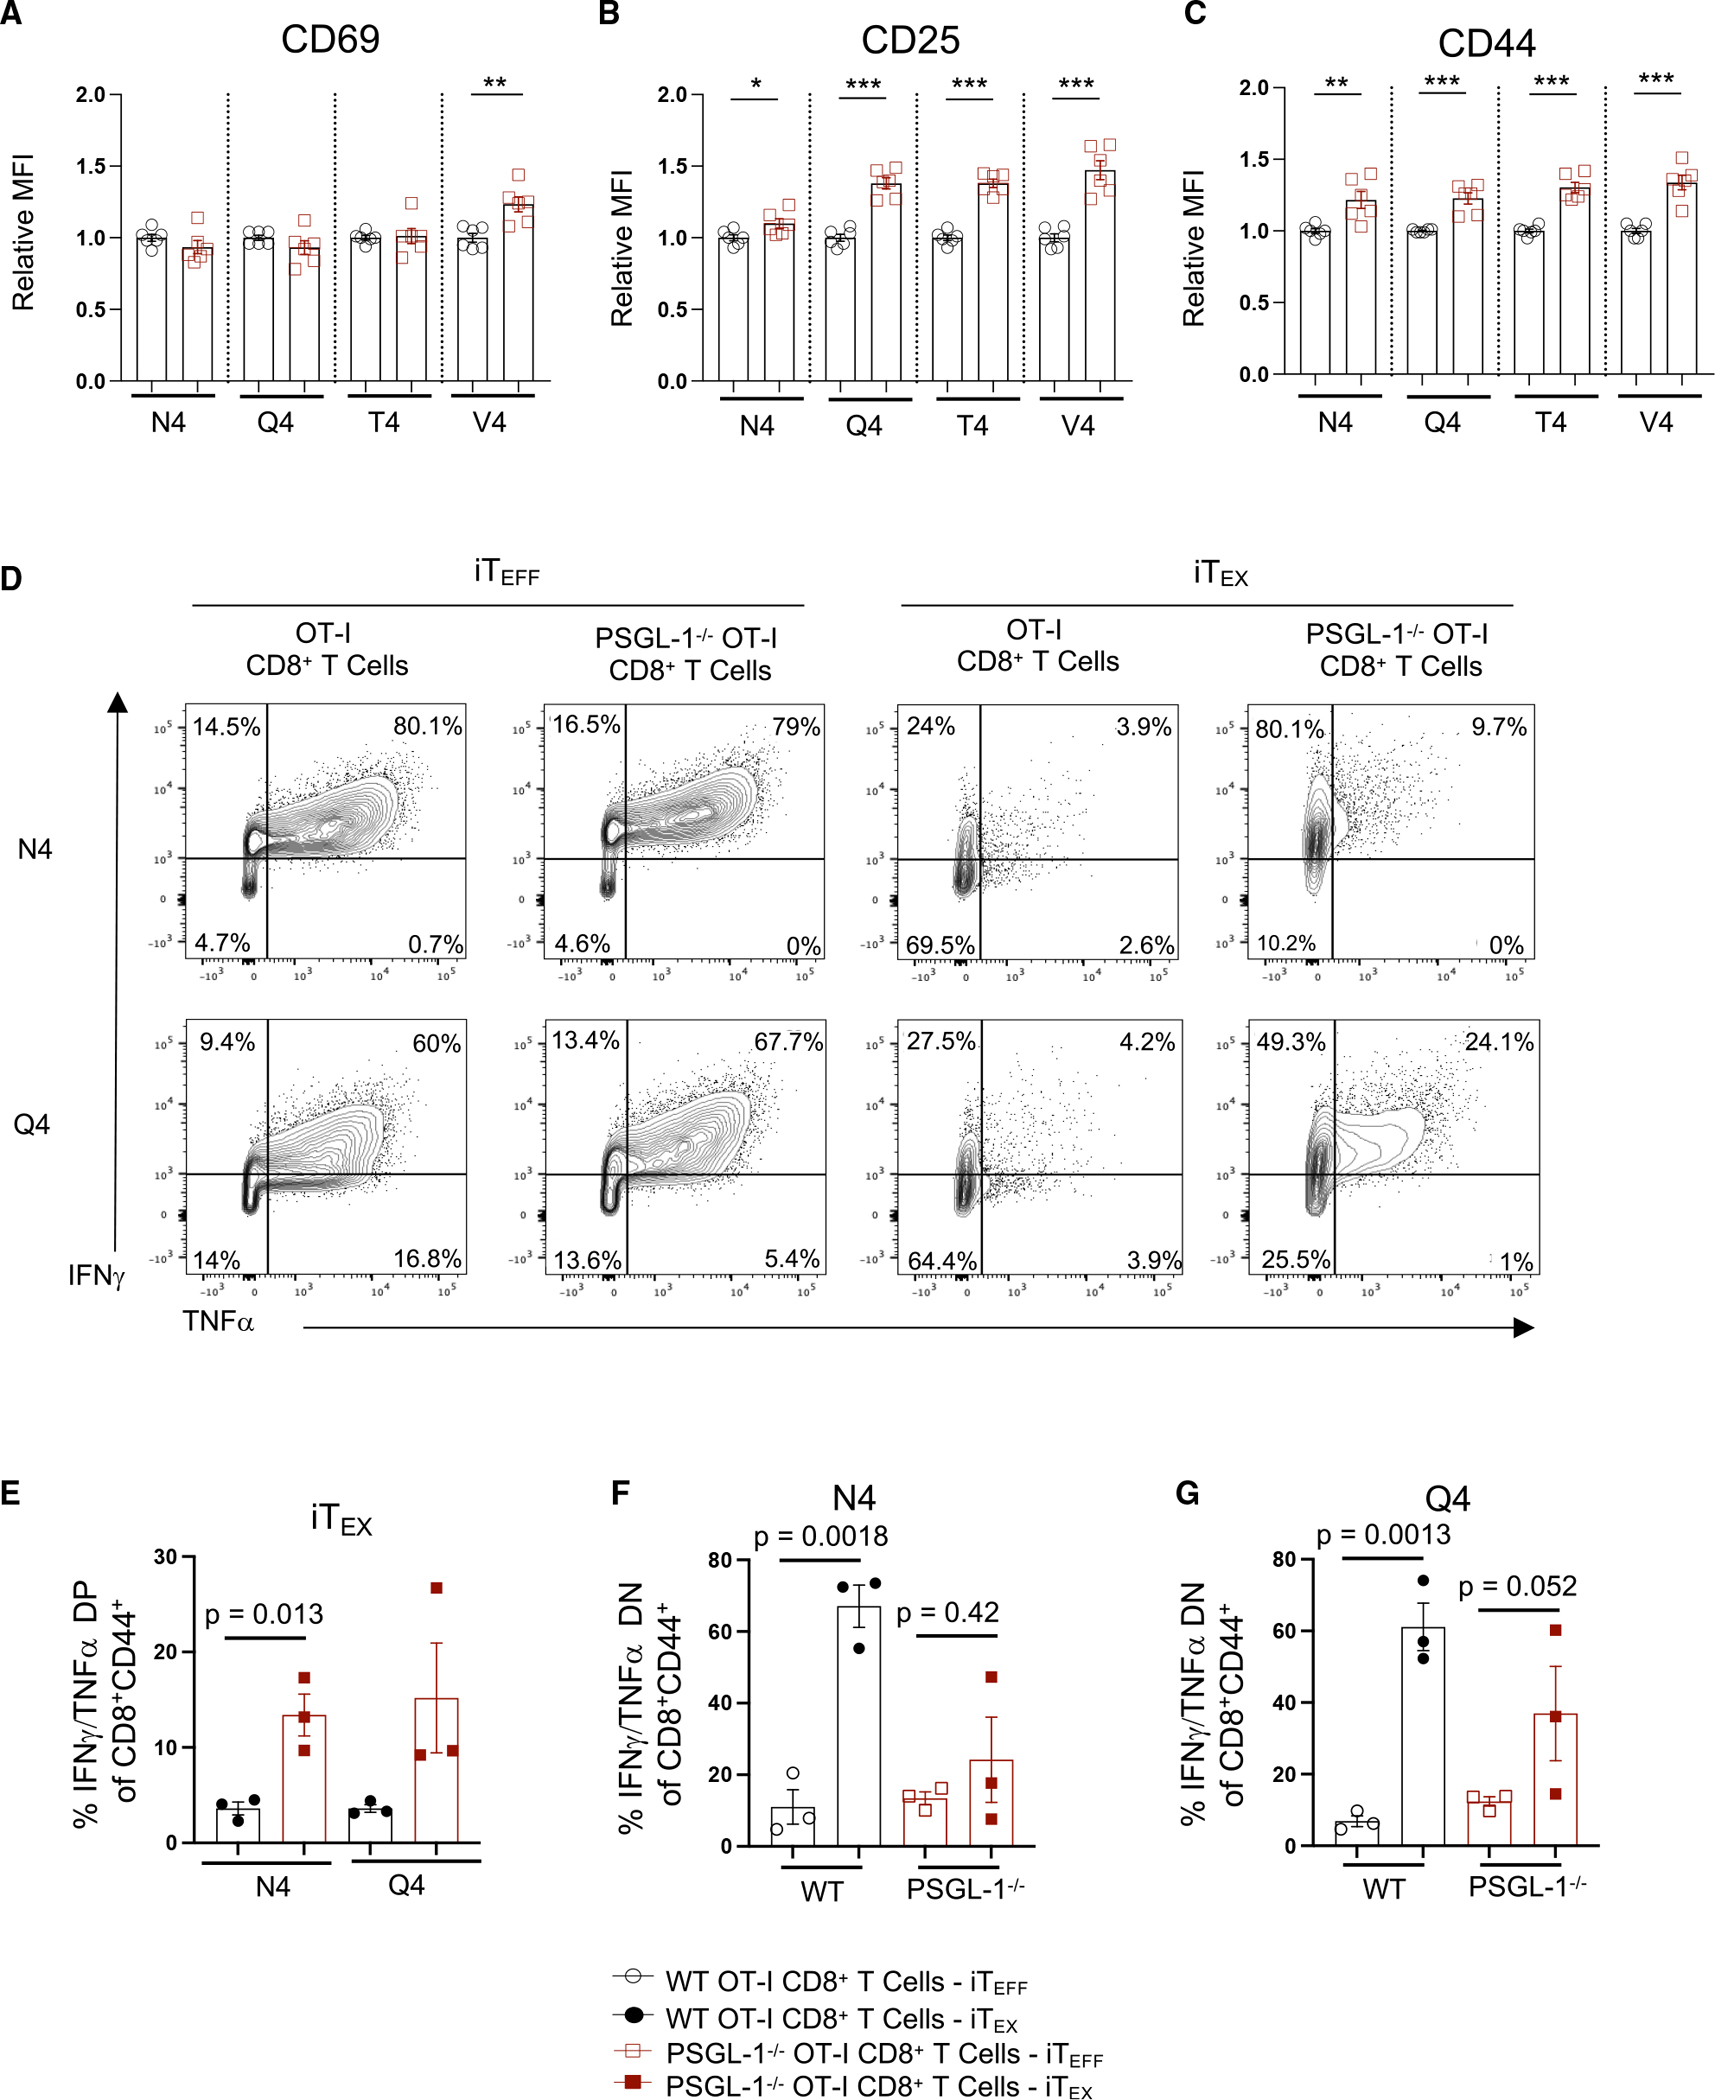
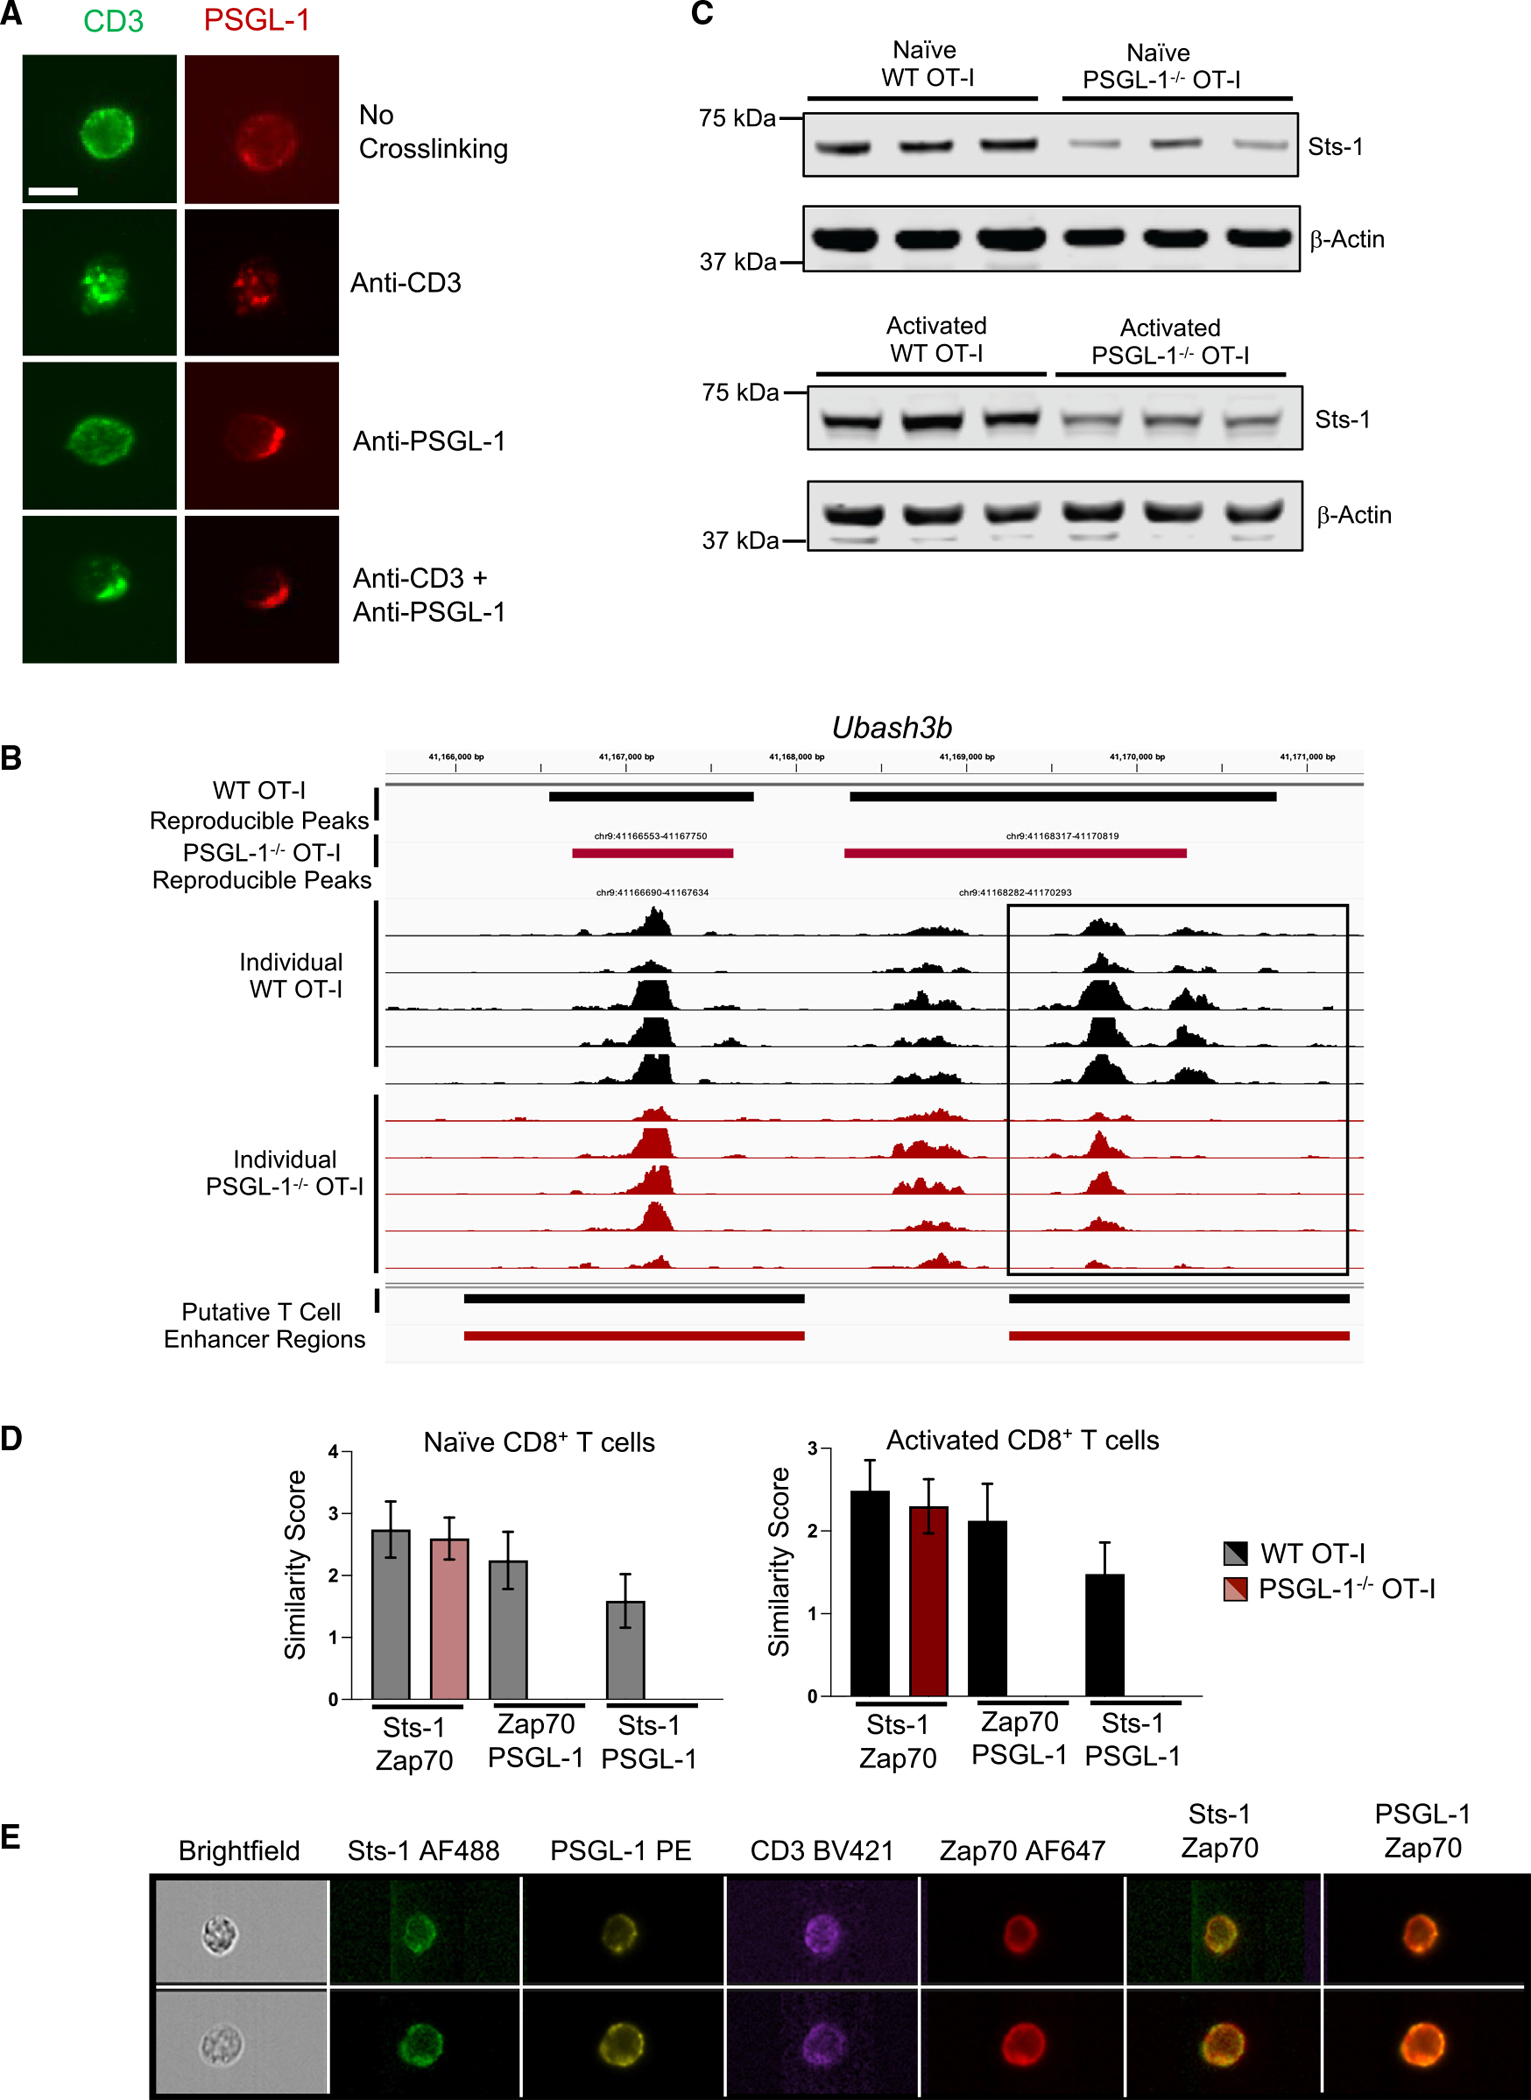
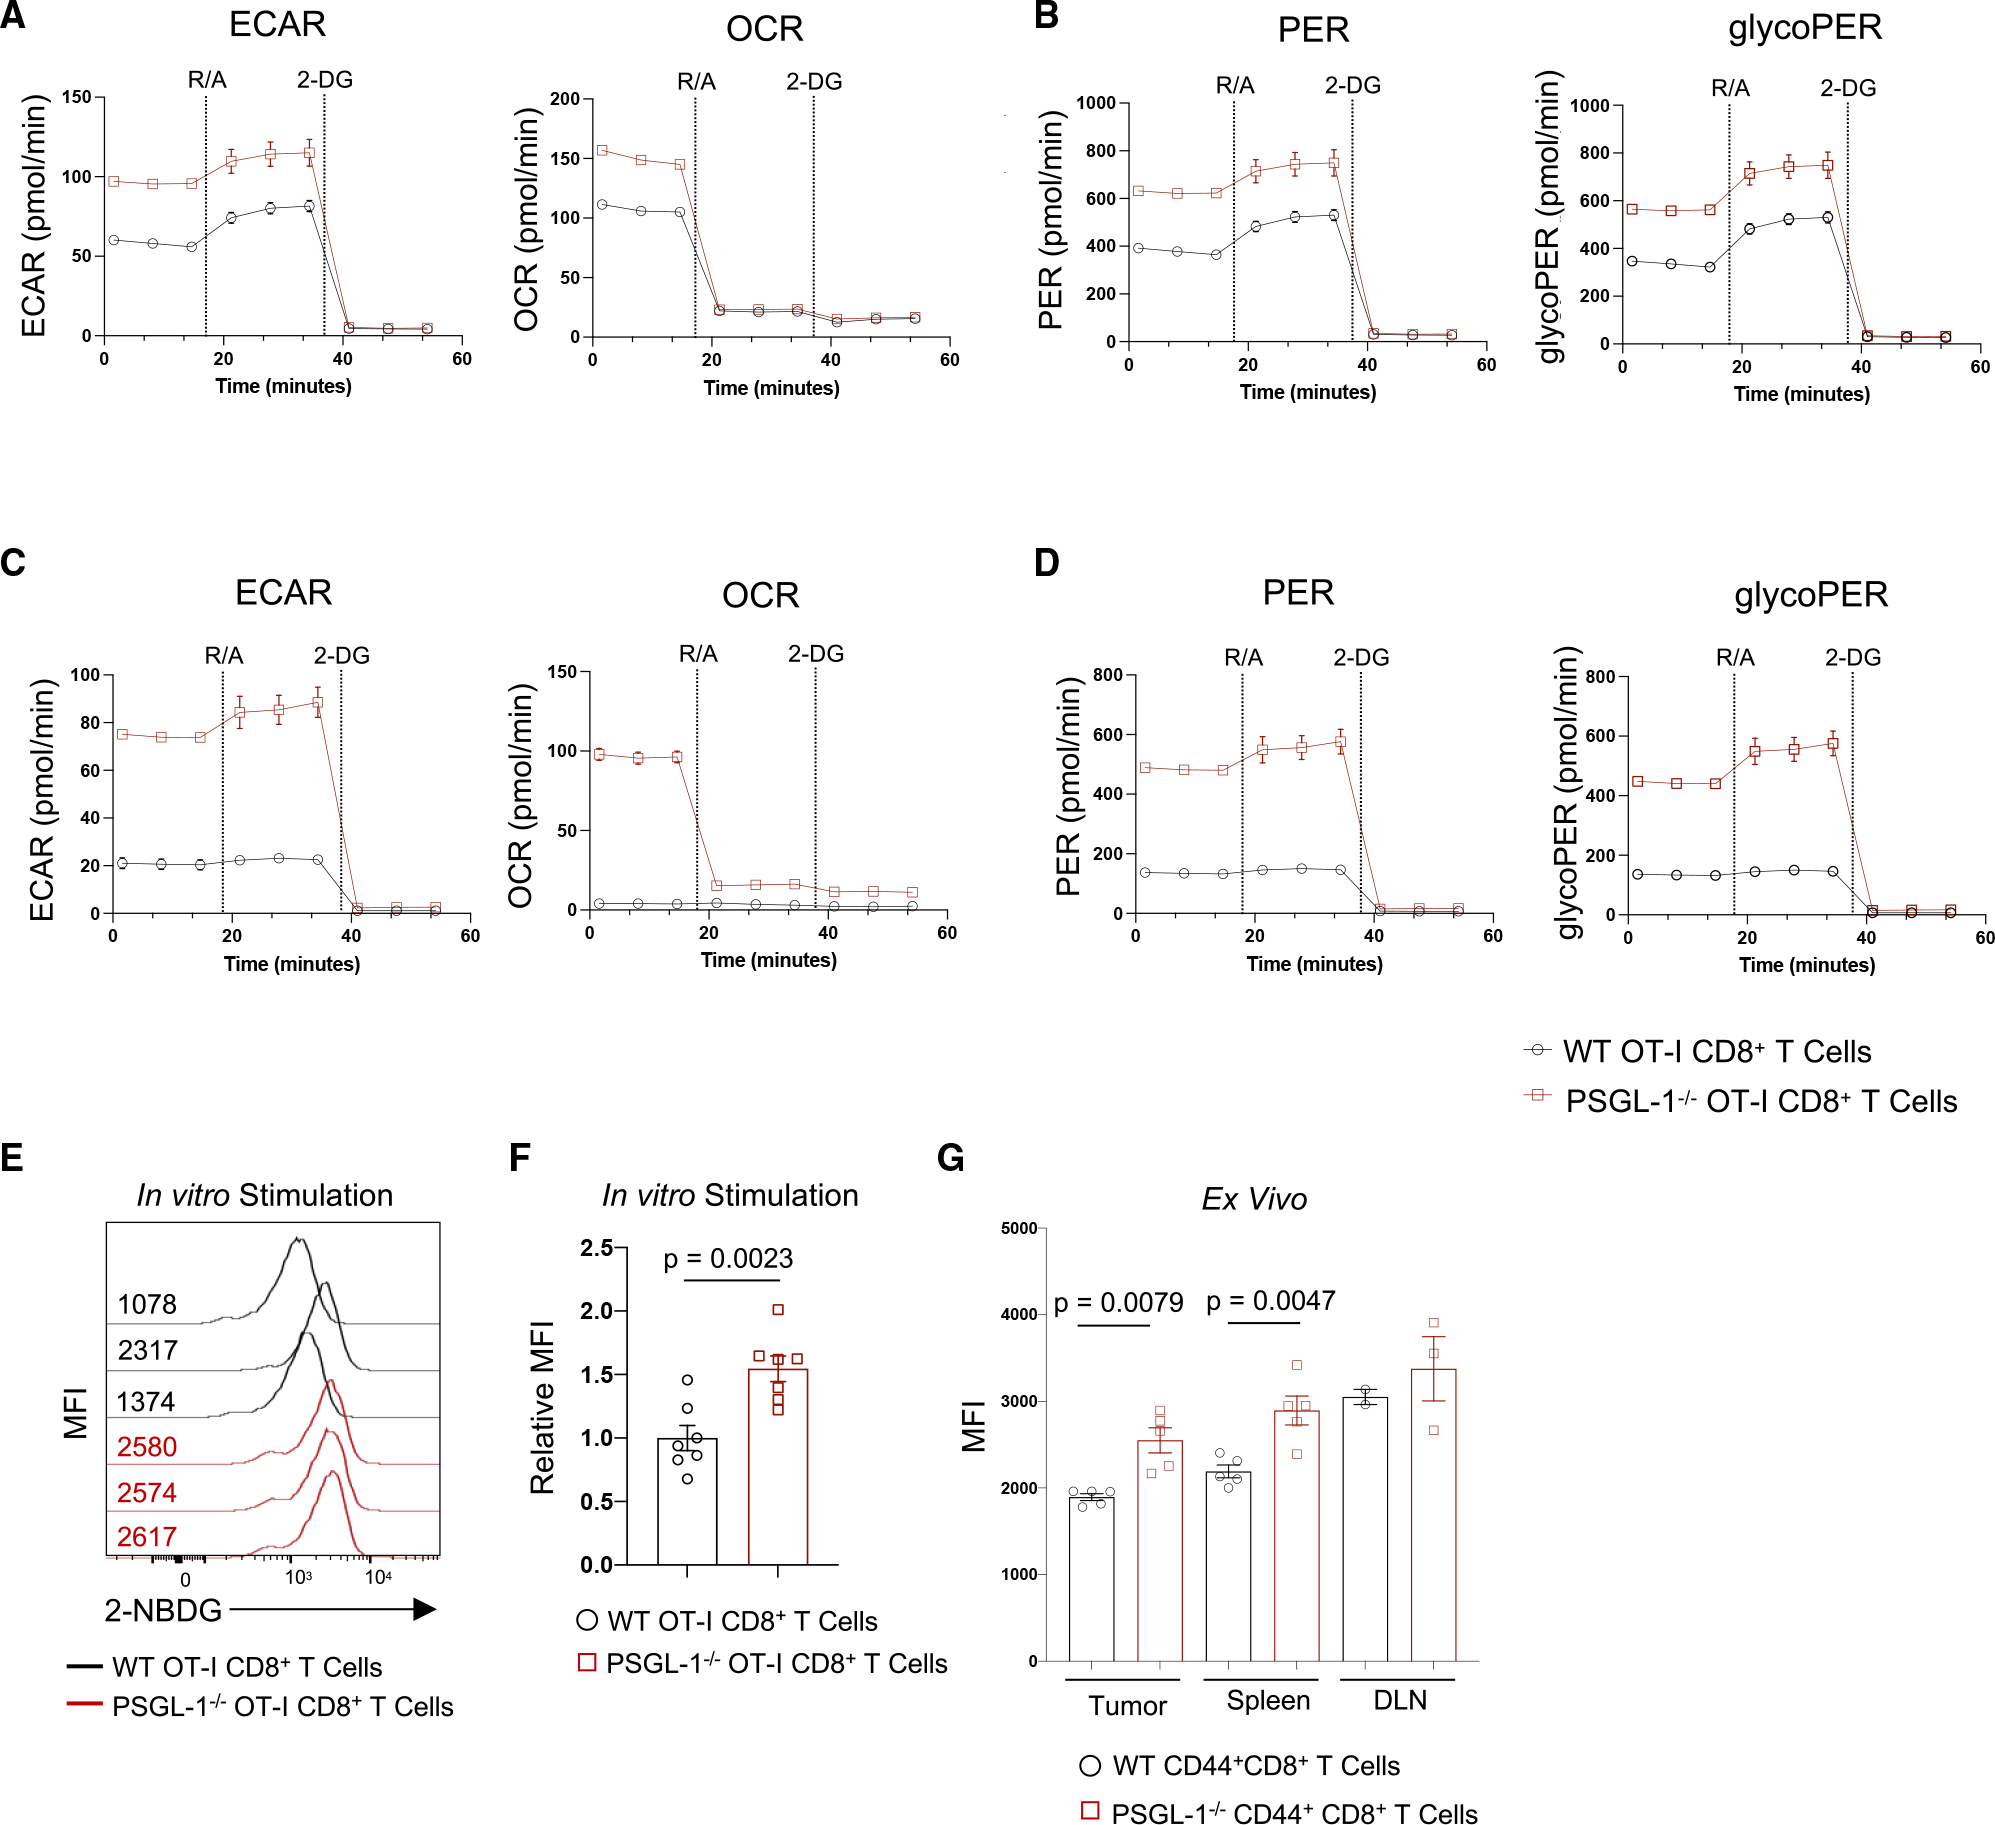
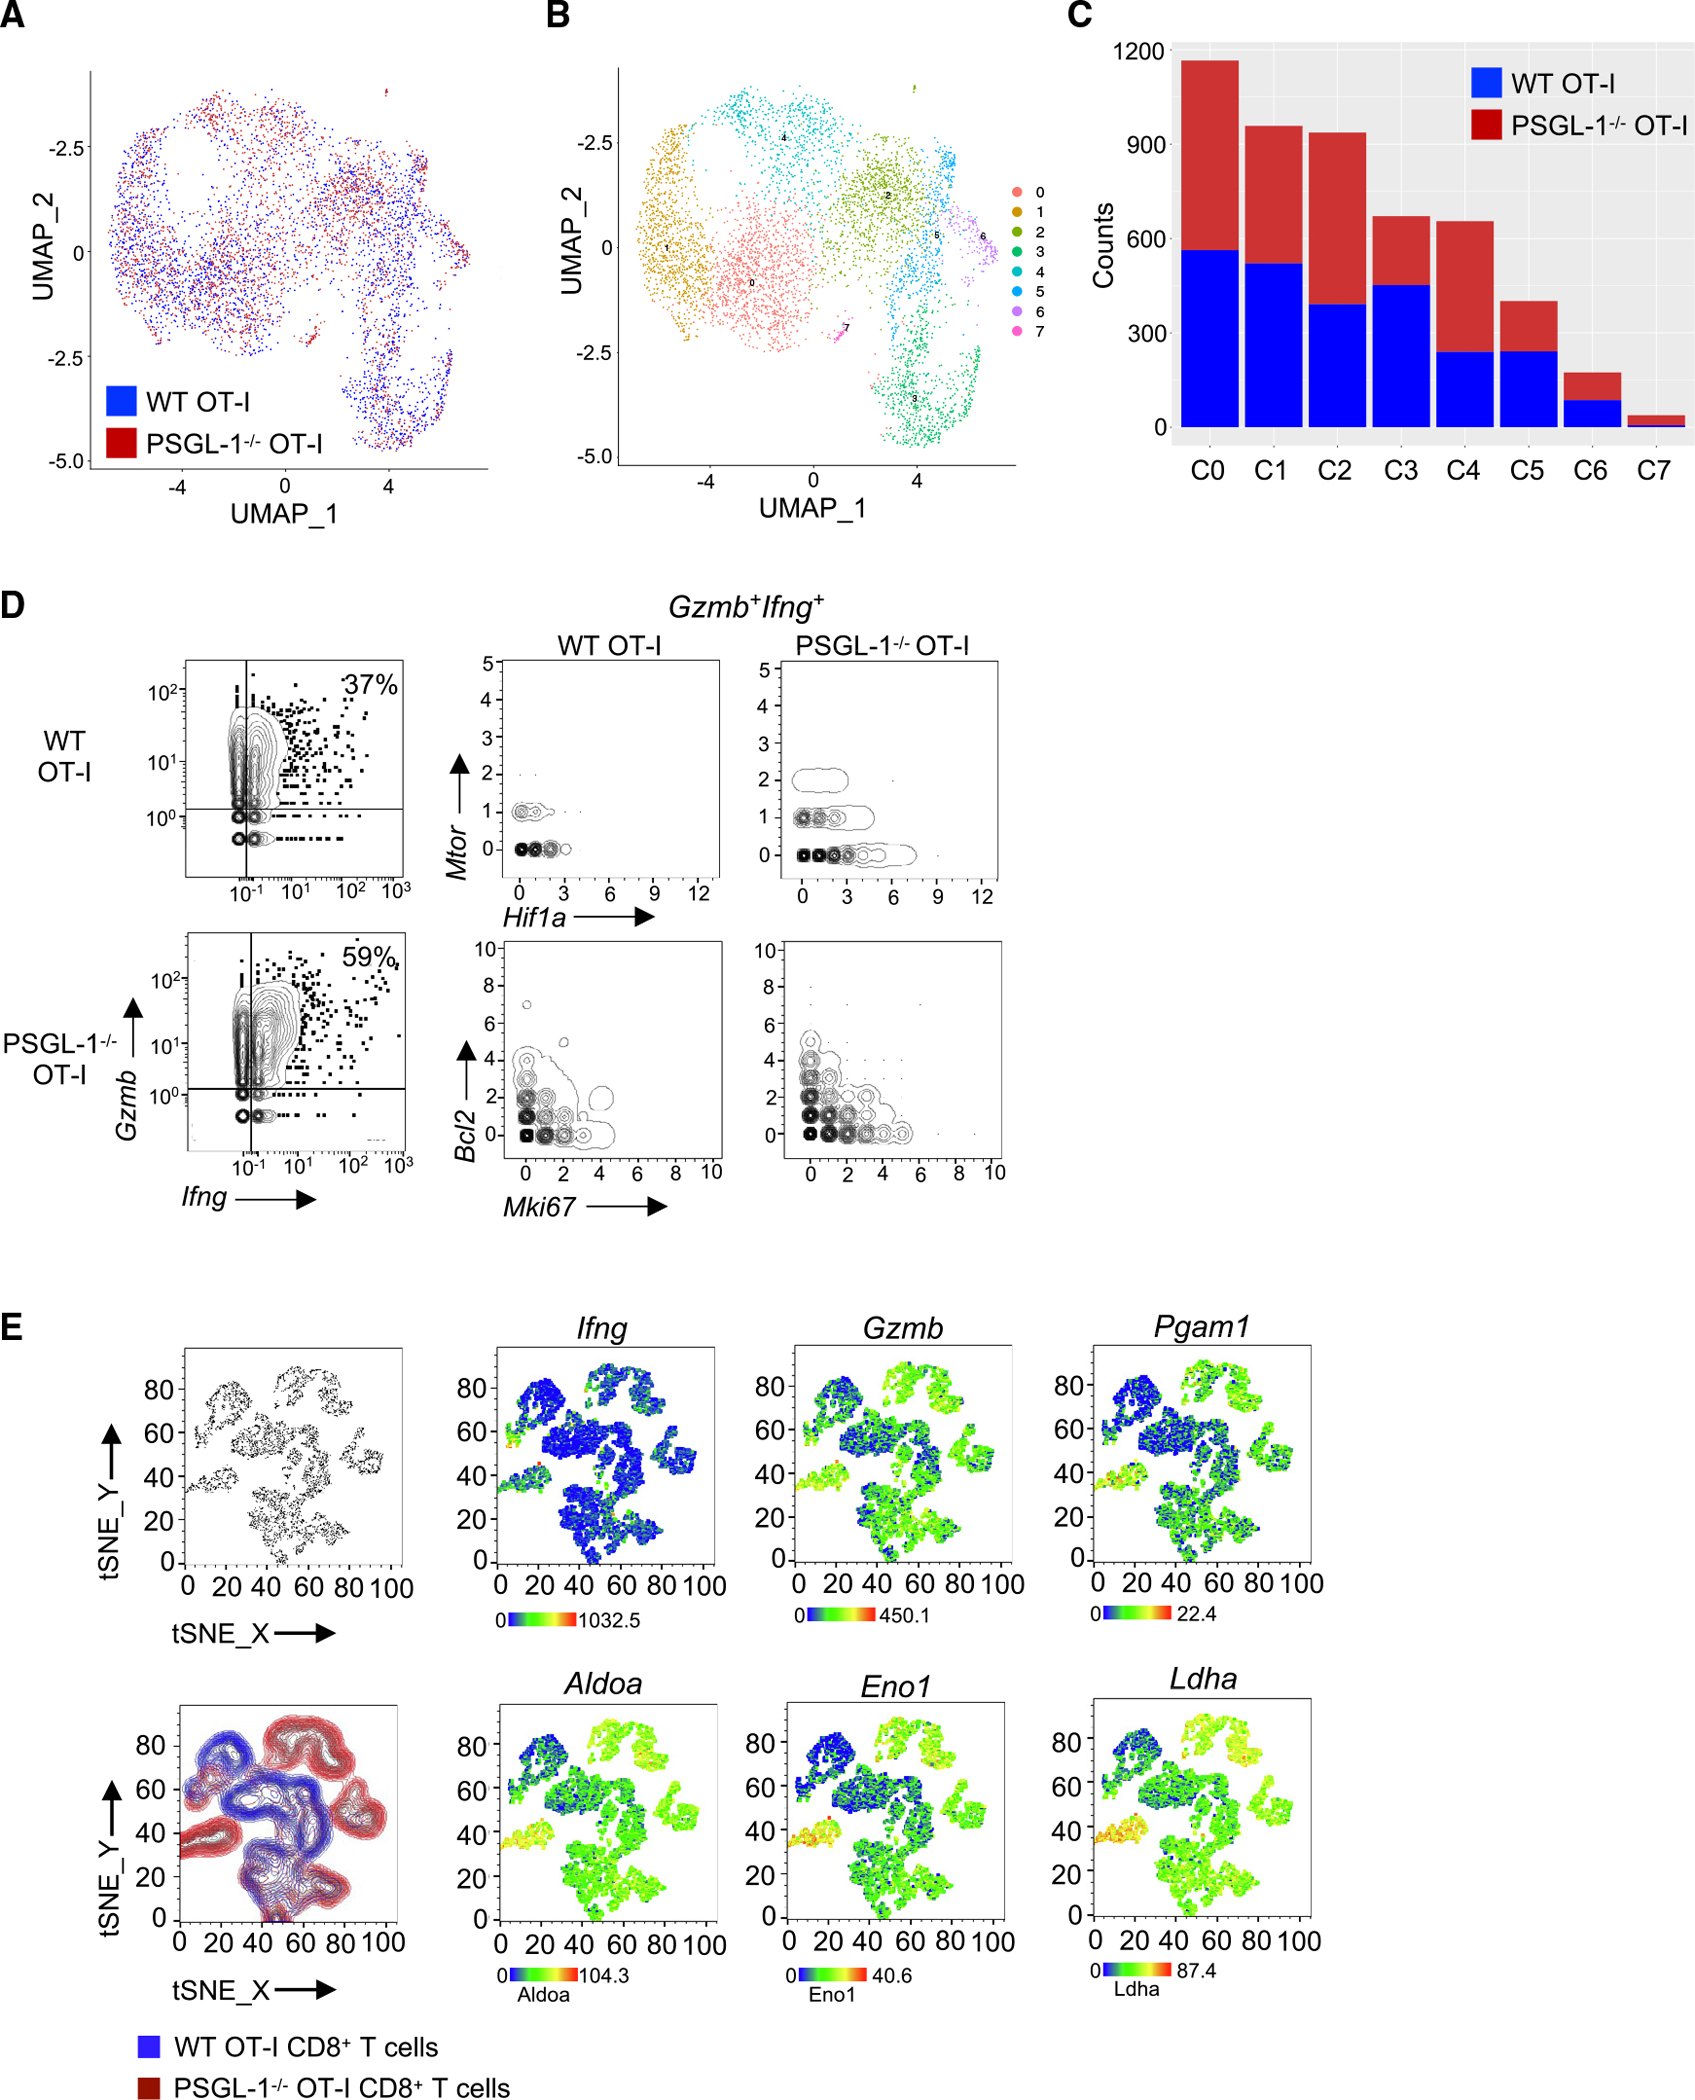
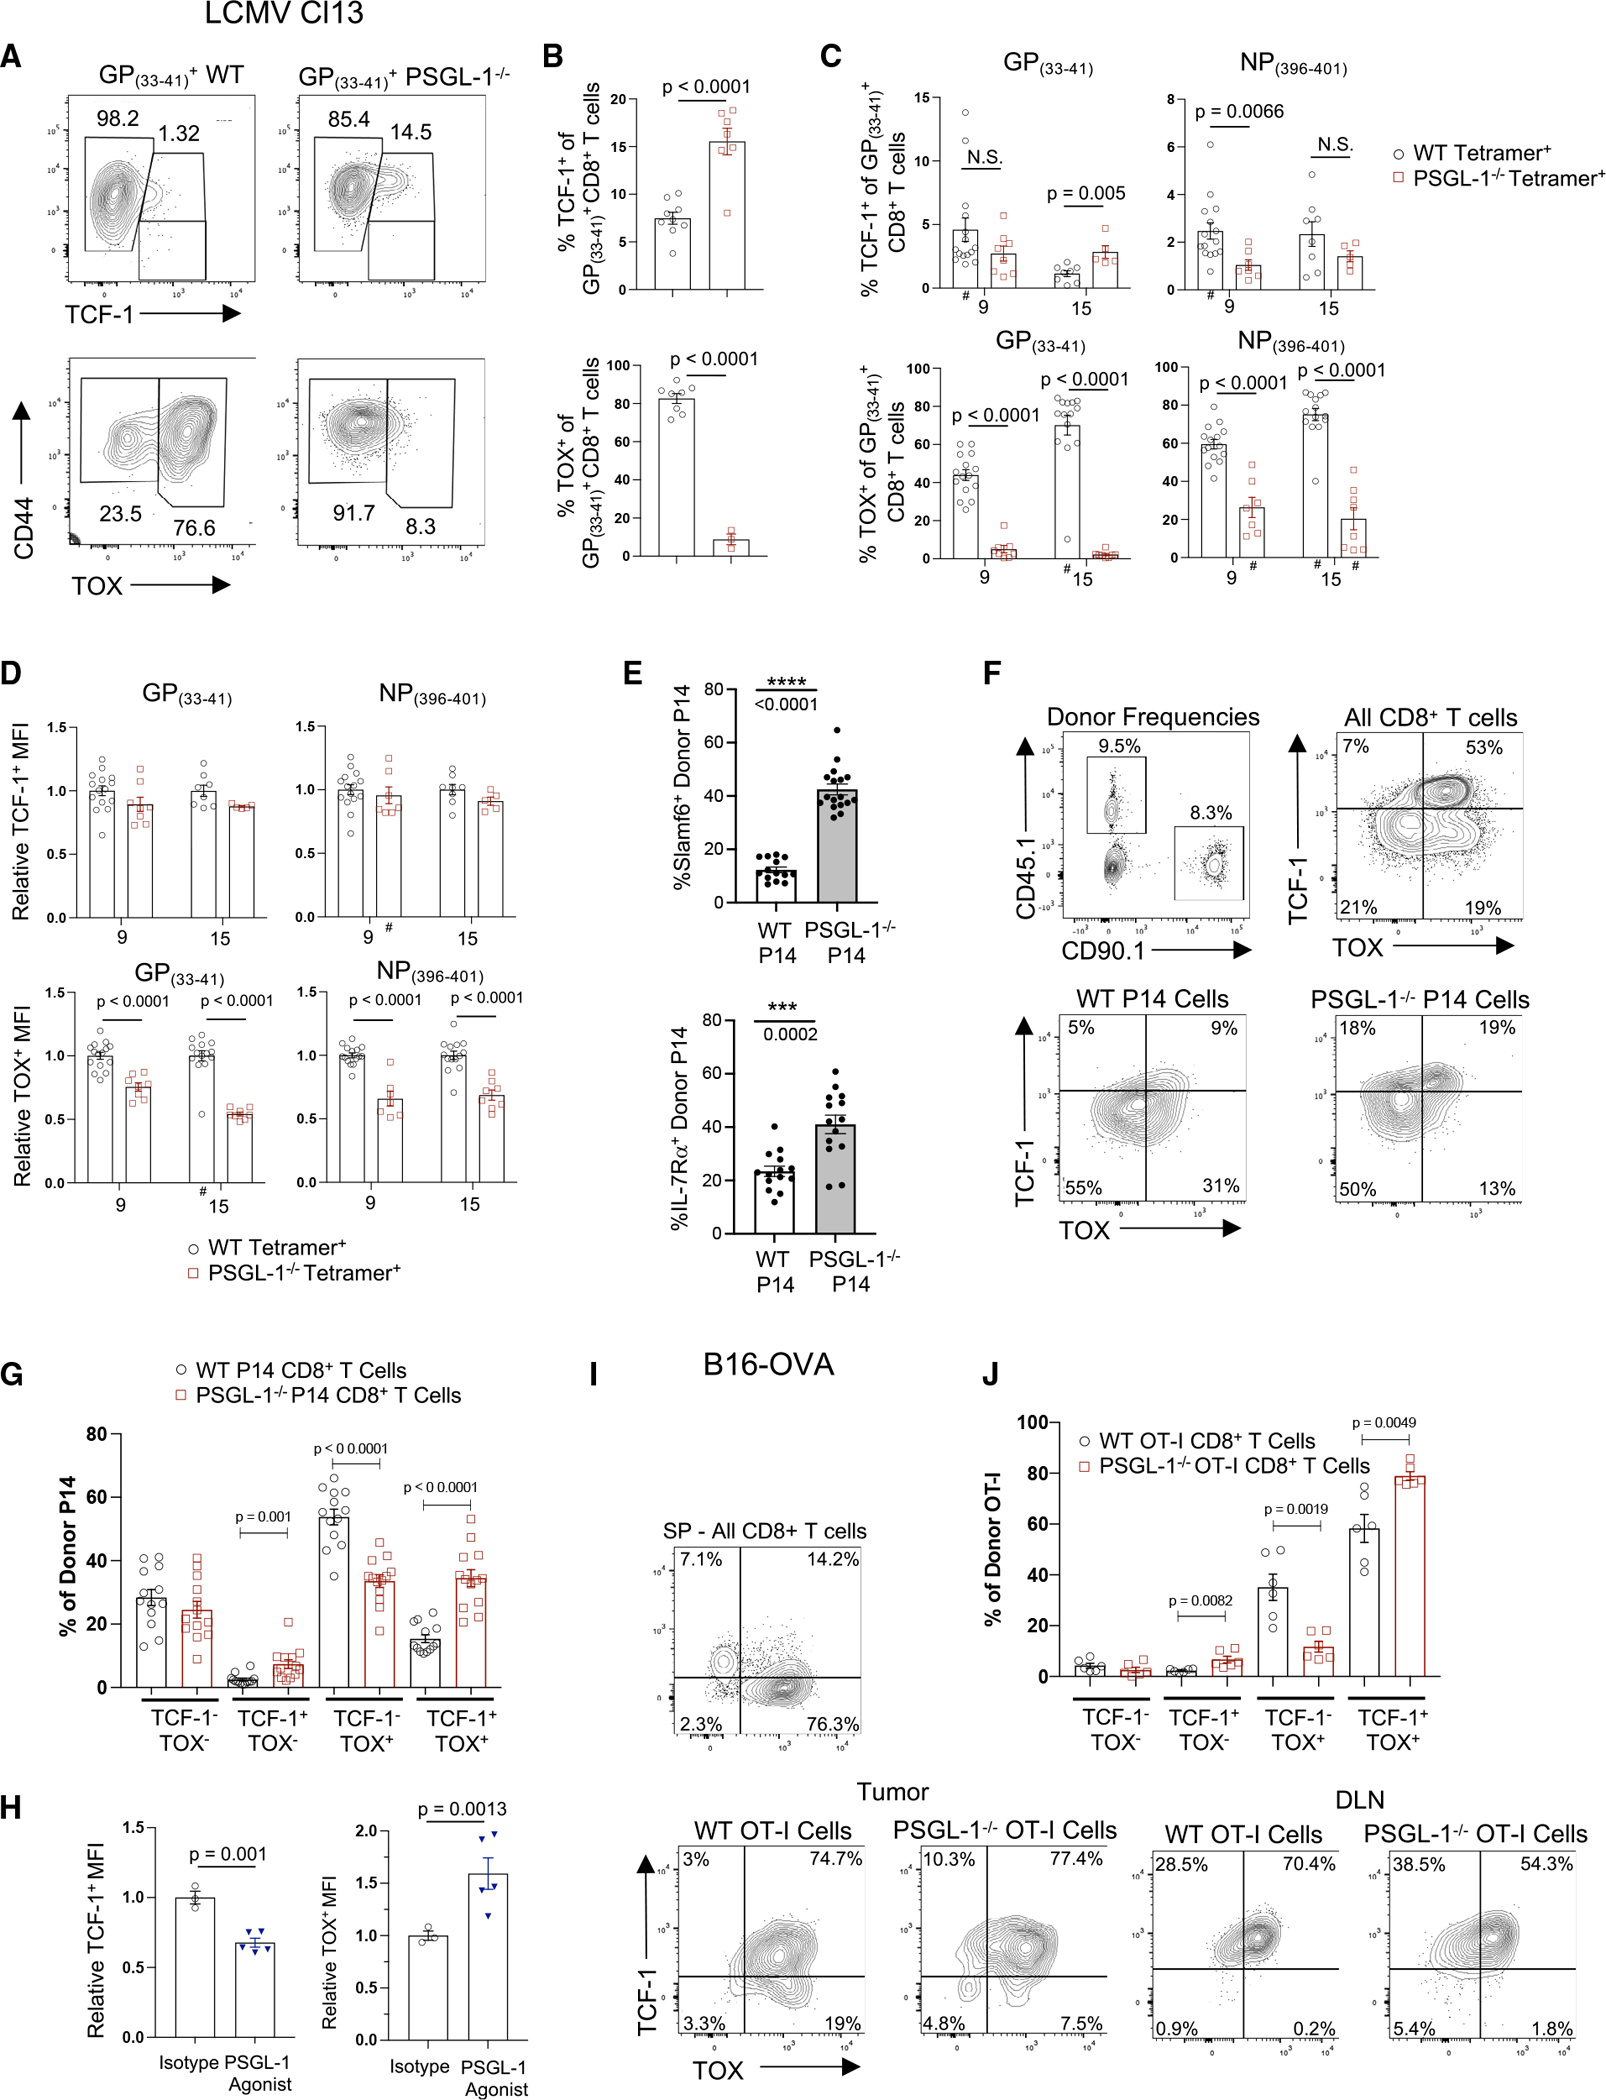
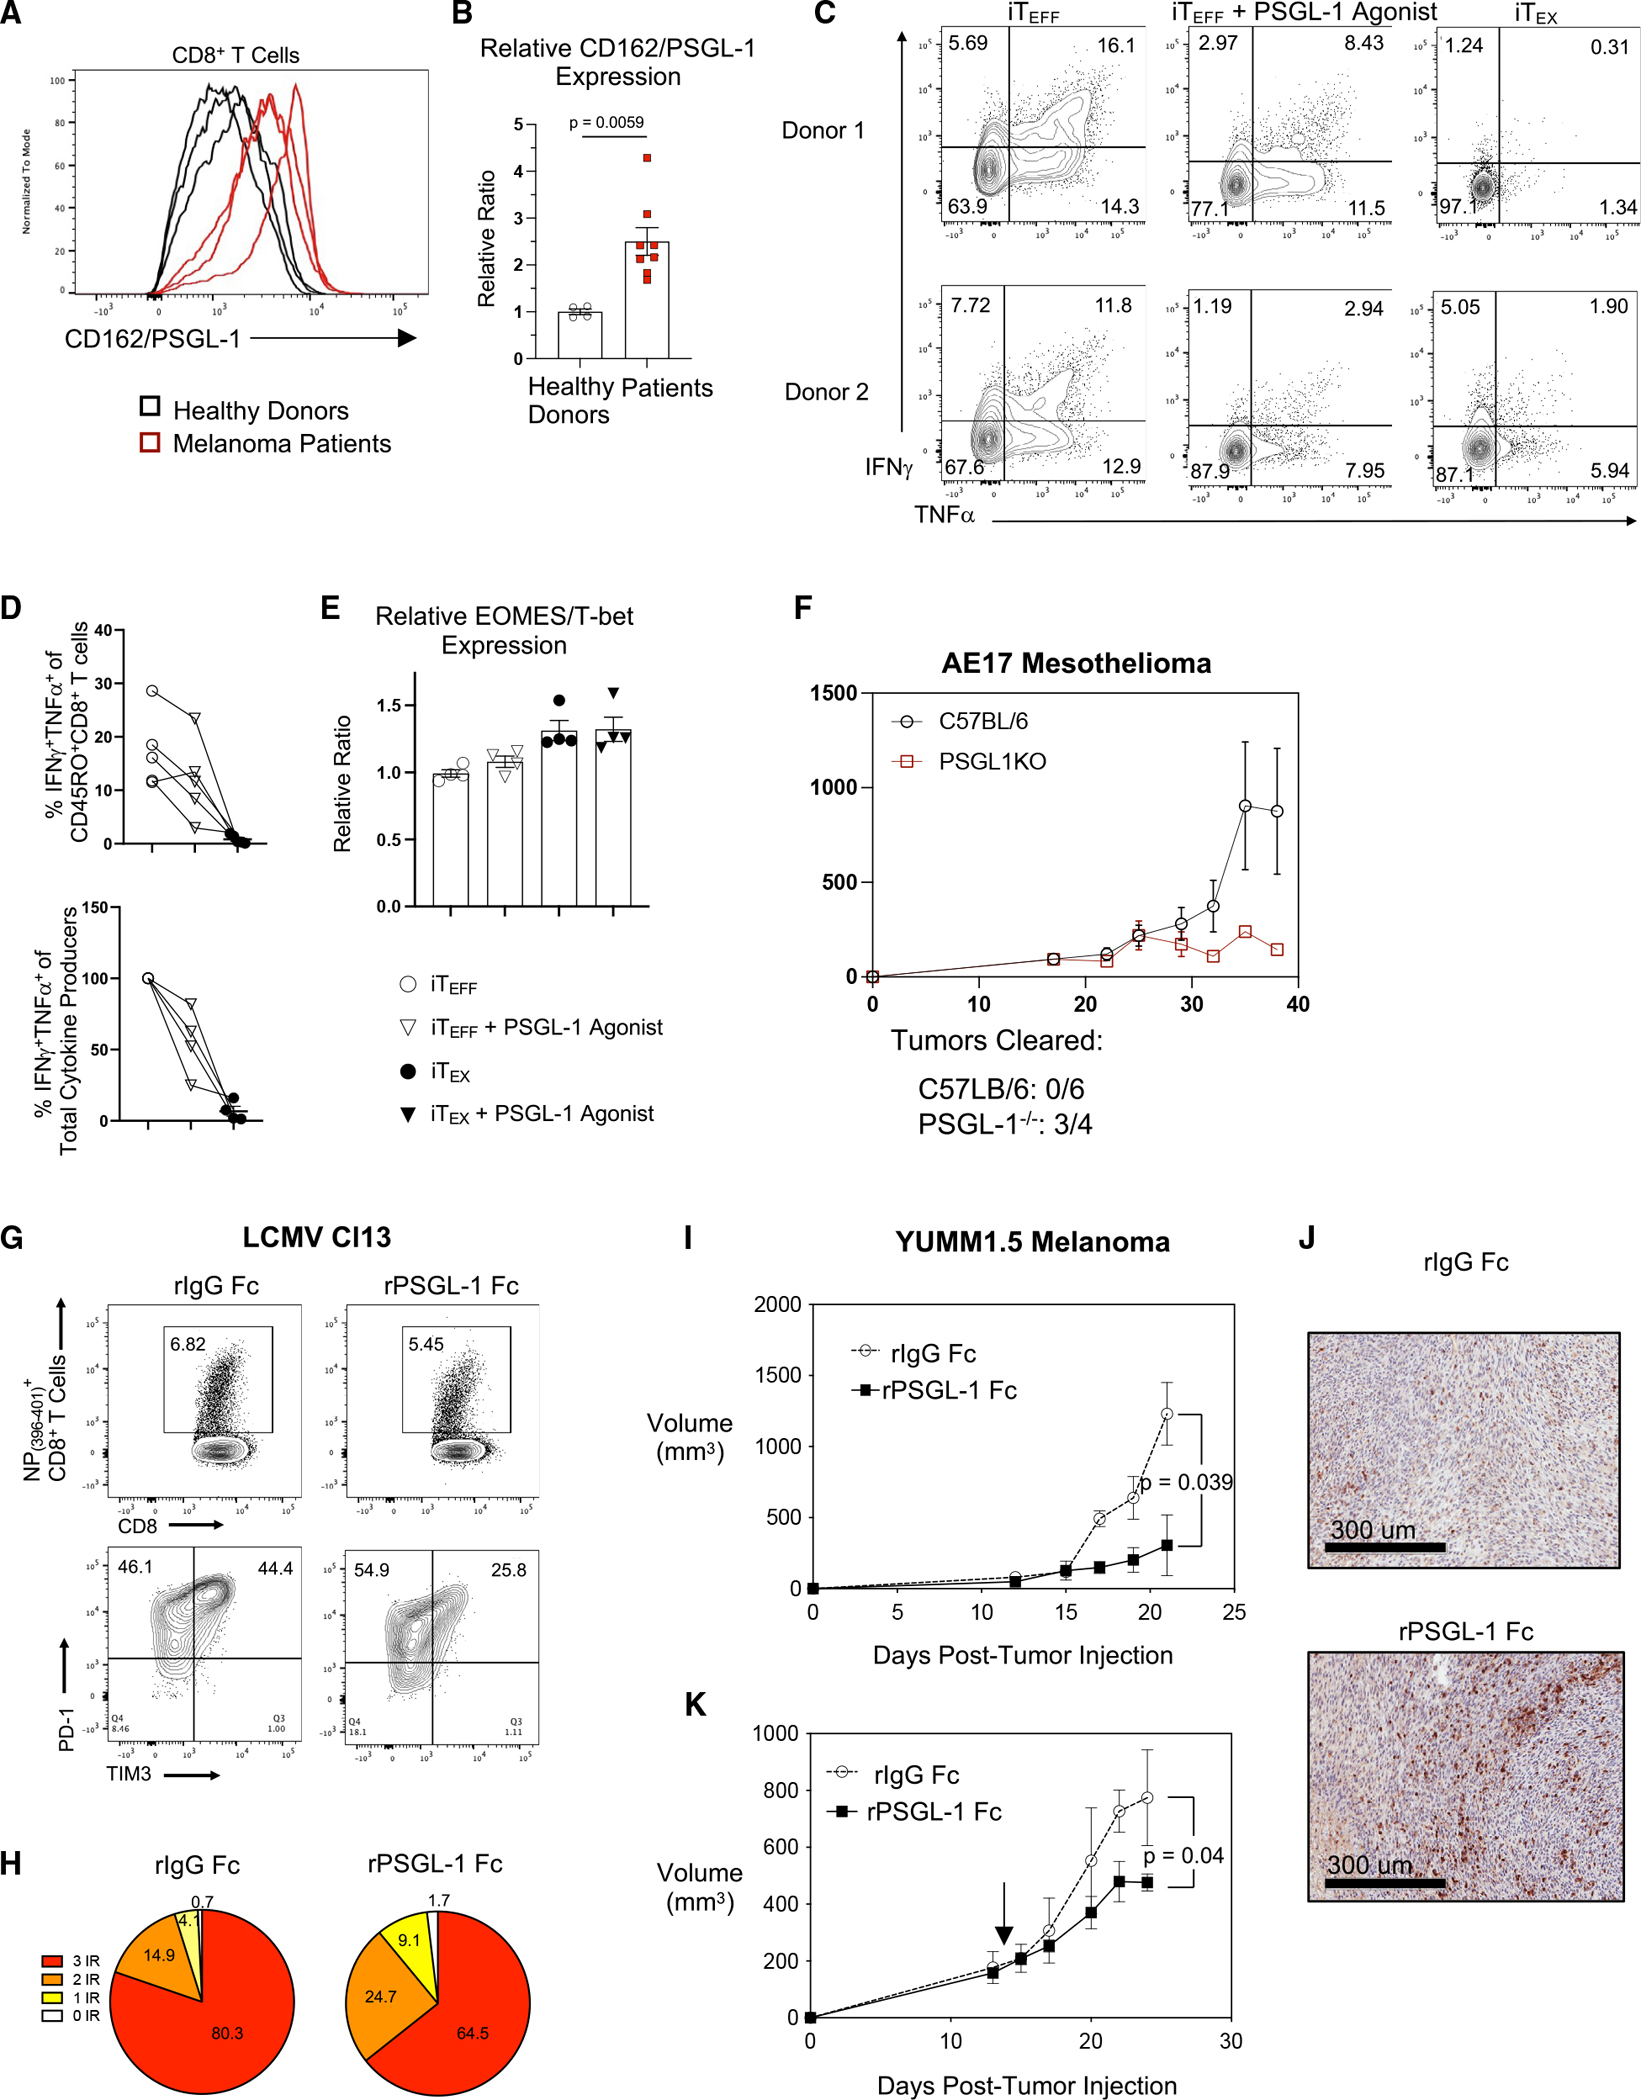
PSGL-1 (P-selectin glycoprotein-1) is a T cell-intrinsic checkpoint regulator of exhaustion with an unknown mechanism of action. Here, we show that PSGL-1 acts upstream of PD-1 and requires co-ligation with the T cell receptor (TCR) to attenuate activation of mouse and human CD8+ T cells and drive terminal T cell exhaustion. PSGL-1 directly restrains TCR signaling via Zap70 and maintains expression of the Zap70 inhibitor Sts-1. PSGL-1 deficiency empowers CD8+ T cells to respond to low-affinity TCR ligands and inhibit growth of PD-1-blockade-resistant melanoma by enabling tumor-infiltrating T cells to sustain an elevated metabolic gene signature supportive of increased glycolysis and glucose uptake to promote effector function. This outcome is coupled to an increased abundance of CD8+ T cell stem cell-like progenitors that maintain effector functions. Additionally, pharmacologic blockade of PSGL-1 curtails T cell exhaustion, indicating that PSGL-1 represents an immunotherapeutic target for PD-1-blockade-resistant tumors.

Keywords: CD8 T cells; CP: Immunology; T cell exhaustion; T cell metabolism; T cell signaling; chronic infection; melanoma; tumor immunity.


Conflict of interest statement

Declaration of interests L.M.B. and R.T. hold patents for PSGL-1 modulators and uses thereof (US10858436B2, WO2016007653A3). L.M.B. and J.L.H. hold patents for PSGL-1 antagonists and uses thereof (63/481570).

Figures

Figure 1.
Figure 1.. PSGL-1 restrains TCR signaling
(A) Frequencies of OT-I WT and PSGL-1−/− CD8+ T cells expressing activation markers at 18 h stimulation with anti-CD3ε antibody. Each dot represents an individual mouse. Experiments were performed 2×. (B) Western blot of phosphorylated and total levels of Zap70, Erk1/2, AKT, and GAPDH in WT and PSGL-1−/− OT-I cells stimulated for the indicated time with anti-CD3ε antibody. (C) Relative levels of phosphorylated Zap70, Erk1/2, and AKT, normalized to β-actin and relative to the specific protein of interest value in WT samples at 0 min for each blot. Experiments were performed 3×, 3 mice pooled/genotype, per experiment. (A–C) All data are parametric data except pAkt at 5 min. For parametric data, unpaired t tests were performed; Mann-Whitney test used for non-parametric data. Error bars are SEM. *p < 0.05, **p < 0.01, ***p < 0.005. See also Figure S1.
Figure 2.
Figure 2.. PSGL-1 deficiency promotes increased TCR signaling sensitivity
WT and PSGL-1−/− OT-I CD8+ T cells were stimulated with ovalbumin (OVA) peptide-pulsed activated splenocytes. (A–C) Expression of (A) CD69, (B) CD25, and (C) CD44 was assessed by flow cytometry. OVA peptides of varying TCR affinities were used for stimulation: N4 (SIINFEKL), Q4 (SIIQFEKL), T4 (SIITFEKL), or V4 (SIIVFEKL). (D–F) WT and PSGL-1−/− OT-I cells were cultured under effector (single stimulation; iTEFF) or exhaustion conditions (repeated stimulation; iTEX) with N4, Q4, T4, or V4 OVA peptides. (D) Flow cytometry plots of IFNγ and TNF-α production by cultured WT and PSGL-1−/− OT-I cells restimulated on day 5 with SIINFEKL for 5 h. (E) Frequency of double-positive IFNγ- and TNF-α-producing OT-I cells from WT (black circles) or PSGL-1−/− mice (red squares) following iTEX culture with either SIINFEKL or SIIQFEKL peptide. (F) Frequency of double-negative (non-IFNγ- or -TNF-α-producing) OT-I cells from WT or PSGL-1−/− mice following iTEFF (open symbols) or iTEX (closed symbols) culture with N4 peptide. (G) Frequency of double-negative (non-IFNγ- or TNFα-producing) OT-I cells from WT or PSGL-1−/− mice following iTEFF (open symbols) or iTEX (closed symbols) culture with Q4 peptide. (A–F) Each dot represents an individual experiment from a pooling of 1–2 mice/genotype/experiment, experiments were performed 3×. Data are parametric; unpaired t tests were performed. Error bars are SEM. *p < 0.05, **p < 0.01, ***p < 0.005.
Figure 3.
Figure 3.. PSGL-1 co-localizes with the TCR, Zap70, and the Zap70 inhibitor Sts-1
(A) Immunofluorescence staining (40× magnification, scale bar of 10 μm) of CD3 (green) and PSGL-1 (red) on CD8+ TK-1 cells before or after crosslinking with CD3 and/or PSGL-1 antibodies. Experiments were performed 2×. (B) Chromatin accessibility within the Ubash3b gene region in WT OT-I cells (black) or PSGL-1−/− OT-I cells (red). Biological replicates prepared from 2 separate experiments. (C) Western blot of Sts-1 and β-actin expression in naive (top) or 2 day activated (bottom) WT and PSGL-1−/− OT-I CD8+ T cells. Each band is a biologic replicate. Experiments were performed 2×. (D and E) Imaging flow cytometry analysis of Sts-1, PSGL-1, CD3, and Zap70 localization and co-localization in 10,000 naive and activated WT and PSGL-1−/− OT-I CD8+ T cells. (D) Similarity scores of Sts-1, Zap70, and PSGL-1 expression in naive (left) or 20 min activated (right) WT (gray/black) and PSGL-1−/− (light red, red) OT-I cells. Error bars are median absolute deviation (MAD). (E) Representative images from (D) in two WT OT-I CD8+ T cells. Experiment performed 2×. See also Figures S3 and S4.
Figure 4.
Figure 4.. PSGL-1 restrains glycolysis in CD8+ T cells
(A) Extracellular acidification rate (ECAR) and oxygen consumption rate (OCR) were assessed using the Seahorse Glycolytic Rate Assay in 3 day activated WT or PSGL-1−/− OT-I CD8+ T cells. (B) Proton efflux rates (PERs) and glycolytic PER (glycoPER) calculated based on (A). (C) ECAR and OCR were assessed for iTEX OT-I cells or PSGL-1−/− OT-I cells on day 5. (D) PER and glycoPER calculated based on (C). (A)–(D) are representative of >3 experiments. (E and F) Histograms (E) and graph (F) of 2-NBDG uptake in OT-I or PSGL-1−/− OT-I cells after 2 h stimulation with SIINFEKL peptide; each line/dot represents an individual mouse. Data are normally distributed. (G) Graph of ex vivo 2-NBDG MFI values in CD44+CD8+ T cells from tumors, spleens, or tumor draining lymph nodes (DLNs) of WT or PSGL-1−/− mice bearing YUMM1.5 tumors. Data in (D) and (G) are parametric except for WT tumors and DLN. For parametric data, unpaired t tests were performed; Mann-Whitney test used for non-parametric data. Error bars are SEM. Each dot in tumors and spleens represents an individual mouse; DLN represents a pool. Experiments were performed 2×.
Figure 5.
Figure 5.. Single-cell sequencing reveals enhanced metabolic state of intratumoral PSGL-1−/− CD8+ T cells
1 × 10⁶ activated WT OT-I (CD45.1+) or PSGL-1−/− OT-I (CD90.1+) T cells were injected into C57BL/6 mice 7 days after B16-OVA injection, and donor OT-I cells were sorted from tumors 6 days later for single-cell RNA sequencing. (A) UMAP analysis (Seurat) of TILs. (B and C) Composition analysis showing the breakdown of WT OT-I cells (pink) vs. PSGL-1−/− OT-I cells (green) overlaying the UMAP (B) and the number of counts of each per cluster (C). (D) SeqGeq analysis of Gzmb and Ifng expression in WT and PSGL-1−/− OT-I cells (left). Top right: gene expression of Mtor and Hif1a in Gzmb+Ifng+ WT and PSGL-1−/− OT-I cells. Bottom right: gene expression of Bcl2 and Mki67 in Gzmb+Ifng+ WT and PSGL-1−/− OT-I CD8+ T cells. (E) SeqGeq tSNE clustering of WT (blue) and PSGL-1−/− (red) OT-I cell libraries. Gene expression overlays of Ifng, Gzmb, Pgam1, Aldoa, Eno1, and Ldha in 1,000 single cells per condition from 6 mice per genotype. See also Figure S5.
Figure 6.
Figure 6.. PSGL-1 limits TCF-1 and promotes TOX expression in CD8+ T cells during chronic virus infection and cancer
(A) TCF-1 or TOX vs. CD44 expression in GP(33–41)-specific CD8+ T cells from spleens of WT or PSGL-1−/− mice 15 dpi with LCMV Cl13. (B) Frequencies of TCF-1+ (top) or TOX+ (bottom) GP(33–41)+ CD8+ T cells in spleens of WT or PSGL-1−/− mice 15 dpi. (C) Frequencies of TCF-1+ (top) or TOX+ (bottom) GP(33–41)+ or NP(396–404)+ CD8+ T cells in blood of WT or PSGL-1−/− mice on 9 and 15 dpi. (D) The relative per-cell expression (MFI) of TCF-1+ (top) or TOX+ (bottom) GP(33–41)+ or NP(396–404)+ CD8+ T cells in blood of WT or PSGL-1−/− mice on 9 and 15 dpi. (E) WT mice received a 1:1 mix of WT and PSGL-1−/− CD8+ P14 cells and infected with LCMV Cl13. Slamf6 and IL-7Rα expression on donor T cells in blood was assessed 60 dpi. (F) Frequency of donor WT P14 and PSGL-1−/− P14 T cells within CD8+ T cells in blood on 60 dpi (top left). TCF-1 and TOX staining in CD8+ T cells (top right), WT P14 cells (bottom left), and PSGL-1−/− P14 cells (bottom right). (G) Frequency of donor P14 cells expressing combinations of TCF-1 and TOX. (H) Relative per-cell expression (MFI) of TCF-1+ (top) or TOX+ (bottom) GP(33–41)+ or NP(396–404)+ CD8+ T cells in spleens 15 dpi with LCMV Cl13 following in vivo ligation of PSGL-1 or isotype control antibody. (I and J) TCF-1 and TOX expression in CD44hi donor OT-I cells in tumors and inguinal tumor DLNs of WT mice inoculated with B16-OVA melanoma cells. Donor cells were in vitro activated, transferred on day 14 of tumor growth, and analyzed 6 days later. (A–J) Each dot represents a biological replicate. Data are parametric except those noted by a hash symbol (#). For parametric data, unpaired t tests were performed; Mann-Whitney test used for non-parametric data. Error bars are SEM. The experiment was performed 1× (B, TOX; E–G), 2× (A and B, TCF-1; H–J), or 33 (C and D). See also Figure S6.
Figure 7.
Figure 7.. Pharmacological inhibition of PSGL-1 promotes decreased T cell exhaustion and functional T cell responses
(A) Histograms of CD162/PSGL-1 expression on activated CD8+ T cells from 3 healthy donors and 3 patients with melanoma. (B) Relative expression of PSGL-1 on CD8+ T cells from healthy donors and patients with melanoma. (C–E) PBMCs from healthy donors were assessed for transcription factor expression or restimulated to assess cytokine production. (C) Flow cytometry plots showing IFNγ and TNF-α production by CD8+ T cells from two different healthy donor PBMCs after iTEFF or iTEX culture and restimulated on day 9; pre-gated on live, CD8+CD45RO+ cells. (D) Top: frequencies of IFNγ and TNF-α double-producing CD8+CD45RO+ cells cultured under iTEFF, iTEFF + PSGL-1 agonist, or iTEX conditions. Lines are connecting data from the same donor under the different culture conditions. Bottom: relative reduction of IFNγ and TNF-α double-producing CD8+CD45RO+ cells upon PSGL-1 ligation under iTEFF conditions (4 out of 5 donors). (E) EOMES/T-bet expression ratio in CD8+CD45RO+ cells from donors in (D). (A–E) Each dot represents a unique donor. Experiments were performed 2× (A and B) or 3× (C–E). Data are parametric data; unpaired t tests were performed. Error bars are SEM. (F) Growth (volume) of AE17 mesothelioma tumors in C57BL/6 and PSGL-1−/− mice. (G) Top: splenic NP(396–404)-specific CD8+ T cells of control- and recombinant PSGL-1-human Fc protein (rPSGL-1 Fc)-treated LCMV Cl13-infected mice assessed on 8 dpi. Bottom: PD-1 and TIM-3 expression on NP(396–404)-specific CD8+ T cells. (H) Co-expression of PD-1, LAG3, and TIM-3 on NP(396–404) specific CD8+ T cells assessed via Boolean gating. (I) Growth of YUMM1.5 tumors in control C57BL/6 mice and mice treated with rPSGL-1 Fc beginning on day 0. (J) Representative H&E histology with anti-CD3 staining of YUMM1.5 tumor sections collected on day 21. (K) YUMM1.5 tumor volumes following therapeutic treatment with rPSGL-1 Fc beginning on day 14. (F–J) Experiments were performed 2× with >3 mice/group per experiment. See also Figure S7.

References

    1. McLane LM, Abdel-Hakeem MS, and Wherry EJ (2019). CD8 T cell exhaustion during chronic viral infection and cancer. Annu. Rev. Immunol. 37, 457–495. 10.1146/annurev-immunol-041015-055318. - DOI - PubMed
    1. Baumeister SH, Freeman GJ, Dranoff G, and Sharpe AH (2016). Coinhibitory pathways in immunotherapy for cancer. Annu. Rev. Immunol. 34, 539–573. 10.1146/annurev-immunol-032414-112049. - DOI - PubMed
    1. Zehn D, Thimme R, Lugli E, de Almeida GP, and Oxenius A (2022). Stem-like’ precursors are the fount to sustain persistent CD8(+) T cell responses. Nat. Immunol. 23, 836–847. 10.1038/s41590-022-01219-w. - DOI - PubMed
    1. Tinoco R, and Bradley LM (2017). Targeting the PSGL-1 pathway for immune modulation. Immunotherapy 9, 785–788. 10.2217/imt-2017-0078. - DOI - PMC - PubMed
    1. Tinoco R, Otero DC, Takahashi AA, and Bradley LM (2017). PSGL-1: a new player in the immune checkpoint landscape. Trends Immunol. 38, 323–335. 10.1016/j.it.2017.02.002. - DOI - PMC - PubMed

Publication types

MeSH terms

Substances