. 2023 Apr 28;8(82):eabn0484.
doi: 10.1126/sciimmunol.abn0484. Epub 2023 Apr 28.

Bcl11b sustains multipotency and restricts effector programs of intestinal-resident memory CD8+ T cells

Affiliations

Bcl11b sustains multipotency and restricts effector programs of intestinal-resident memory CD8+ T cells

Eric Y Helm et al. Sci Immunol. .

Abstract

The networks of transcription factors (TFs) that control intestinal-resident memory CD8+ T (TRM) cells, including multipotency and effector programs, are poorly understood. In this work, we investigated the role of the TF Bcl11b in TRM cells during infection with Listeria monocytogenes using mice with post-activation, conditional deletion of Bcl11b in CD8+ T cells. Conditional deletion of Bcl11b resulted in increased numbers of intestinal TRM cells and their precursors as well as decreased splenic effector and circulating memory cells and precursors. Loss of circulating memory cells was in part due to increased intestinal homing of Bcl11b-/- circulating precursors, with no major alterations in their programs. Bcl11b-/- TRM cells had altered transcriptional programs, with diminished expression of multipotent/multifunctional (MP/MF) program genes, including Tcf7, and up-regulation of the effector program genes, including Prdm1. Bcl11b also limits the expression of Ahr, another TF with a role in intestinal CD8+ TRM cell differentiation. Deregulation of TRM programs translated into a poor recall response despite TRM cell accumulation in the intestine. Reduced expression of MP/MF program genes in Bcl11b-/- TRM cells was linked to decreased chromatin accessibility and a reduction in activating histone marks at these loci. In contrast, the effector program genes displayed increased activating epigenetic status. These findings demonstrate that Bcl11b is a frontrunner in the tissue residency program of intestinal memory cells upstream of Tcf1 and Blimp1, promoting multipotency and restricting the effector program.


Conflict of interest statement

COMPETING INTERESTS

The authors declare no competing interests.

Figures
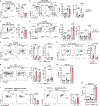
Figure 1.
Figure 1.. Bcl11b deletion post oral infection with Lm-Ova InlAM results in reduced circulating memory cells, but excessive SI TRM cells.
(A-H) Co-transfers. (A) Contour plots and quantification of splenic Bcl11b−/− (CD45.2) and WT (CD45.1/2) cells. (B) Contour plots and quantification of Klrg1 versus CD127 within Bcl11b−/− (CD45.2) and WT (CD45.1/2) CD8+CD44+ splenic population. (C) Bcl11b−/− and WT cells within the siIEL CD8+CD44+CD45.2+ population. (D) Contour plots and quantification of CD69 versus CD103 Bcl11b−/− (KO) and WT within the siIEL CD8+CD44+CD45.2+ population. (E) Contour plots and quantification of splenic Bcl11b−/− and WT cells 30 and 90 DPI. (F) Contour plots and quantification of Bcl11b−/− and WT cells within the splenic TCM (CD62L+) and TEM (CD62L) compartments at 30 DPI. (G) Contour plots and quantification of Bcl11b−/− and WT cells in the siIEL of co-transferred mice at 30 and 90 DPI. (H) Percentages of Bcl11b−/− and WT CD69+CD103+, CD69+CD103 and CD69CD103 subsets within the siIEL CD8+CD44+CD45.2+ cells at 30 DPI. (I-K) Separate transfers. (I-J) Contour plots and quantification of splenic (I) and siIEL (J) Bcl11b−/− and WT CD8+ T cells at 30 DPI. P values by Mann-Whitney-Wilcoxon test. (K) Percentages of Bcl11b−/− and WT CD69+CD103+, CD69+CD103 and CD69CD103 subsets within siIEL CD8+CD44+CD45.2+ cells at 30 DPI. In all graphs data are mean ± SEM with n=3–14. Each mouse is represented by an individual point. P values by two-tailed paired (co-transfer) or unpaired (separate transfer) Student’s t-test. Representative of 2–3 independent experiments.
Figure 2.
Figure 2.. Bcl11b−/− memory cells have an impaired recall response to oral Lm-Ova InlAM infection.
(A-F) Separate transfers. (A) Lm-Ova InlAM CFU on Day 3 post-reinfection in the liver. (B-C) Contour plots and quantification of transferred cells in spleen and siIEL post reinfection (Day 3). (D) Contour plots and quantification of Bcl11b−/− and WT CD8+CD44+ siIEL cells based on CD69 and CD103. (E) Ifnγ and Tnfα following reinfection. (F) Percentages and numbers of recipient CD45.1+CD45.2NK1.1+ in the siIEL following reinfection. (G) Contour plots and quantification of CD45.2 (KO) and CD45.1/2 (WT) cells in spleen and siIEL in co-transferred experiments post reinfection. (H) Liver Lm-Ova InlAM CFU on Day 3 post-reinfection in a sex mismatched transfer. (I) Contour plots and quantification of CD45.2+ (Bcl11b−/− or WT) in sex mismatched transfer. In all graphs data are mean ± SEM with n=4–16. Each individual point represents one mouse. P values by two-tailed paired (co-transfer) or unpaired (separate transfer) Student’s t-test. Representative of 2–3 independent experiments.
Figure 3.
Figure 3.. Loss of Bcl11b in the effector and memory phases of oral Lm-Ova InlAM infection has a major impact on TRM program.
(A) Histogram and quantification of Bcl11b Mean Fluorescence Intensity (MFI) in WT siIEL TRMPs, TEs and MPs 9 DPI. (B) PCA of RNA-seq data on all high fold-changed genes. (C) Hierarchical clustering on Euclidean distances of rlog normalized values of RNA-seq data derived from three independent samples. (D) Differentially expressed gene numbers in TEs, MPs and TRMPs. Genes increasing and decreasing in expression in Bcl11b−/− (KO) are indicated in red and blue, respectively. (E) Heatmap clustering of genes differentially expressed in TRMPs, TEs, MPs. Heatmap shows relative log2 fold change. Select genes of the multipotent/multifunctional (MP/MF) and effector TRM programs are indicated. (F) Gene set enrichment analysis (GSEA) of the MP/MF and effector TRM programs (31) in Bcl11b−/− (KO) and WT TRMPs. (G) GSEA of a Tcf1 gene signature of lung TRMs (63) in Bcl11b−/− and WT TRMPs. (H) GSEA of an Ahr gene signature in intestinal of ILC2s (64) in Bcl11b−/− (KO) and WT TRMPs. (I) Tcf1, Blimp1 and Ahr histograms and MFIs in siIEL TRMPs 9 DPI. Negative controls are endogenous splenic CD44CD8+ T cells or isotype controls. Each individual point represents one mouse. (J) GSEA of the MP/MF and effector TRM programs (31) in Bcl11b−/− and WT siIEL TRM cells at 30 DPI. (K) Volcano plot showing genes with upregulated (red) or downregulated (blue) expression in Bcl11b−/− versus WT siIEL TRM cells 30 DPI. Horizontal line represents P value level 0.05 as a threshold of significance. Eight outliers are not shown. Selected genes are indicated. (L) GSEA of the MP/MF and effector TRM programs (31) in siIEL recall Bcl11b−/− (KO) and WT cells 2 days after reinfection. (M) Volcano plot showing genes with upregulated (red) or downregulated (blue) expression in Bcl11b−/− versus WT siIEL recall CD8+ T cells 2 days after reinfection. Fifteen outliers are not shown. Selected genes are indicated. In A, I, data are mean ± SEM with n=4–8; P values by two-tailed paired Student’s t-test. In F and L “*” indicates moderately differentially expressed genes (p < 0.05) after batch correction. Representative of 2–3 independent experiments. In K and M, DESeq2 P values are shown.
Figure 4.
Figure 4.. Impact of Bcl11b deletion on chromatin accessibility, H3K27ac and H3K4me3 genome wide.
(A) Number of differentially accessible regions (P < 0.05) and H3K27ac ChIP-seq peaks with decreased (blue) or increased (red) signal in Bcl11b−/− TRMPs 9 DPI and TRM-like cells, respectively. (B) LEFT: Peaks with increased/decreased chromatin accessibility in Bcl11b−/− cells predominantly associated with peaks with increased/decreased (green/orange) H3K27ac signal. MIDDLE: Correlation of ATAC-seq and H3K27ac ChIP-seq peaks, differential in Bcl11b−/− cells versus WT. RIGHT: Peaks with increased/decreased chromatin accessibility and H3K27ac in Bcl11b−/− cells were predominantly associated with TSS of genes (±10 kb) with decreased/increased (green/orange) expression in Bcl11b−/− cells. Filtered peaks were used for the analysis (P < 0.05; |log2 fold change|>1). P values by the chi-square test of independence in R. (C) Correlation of differential ATAC-seq and H3K27ac ChIP-seq signal in relation to Bcl11b binding (shape) and changes in gene expression (color). (D) Proportion of ATAC-seq, H3K27ac- and Bcl11b ChIP-seq peaks annotated to different genomic elements. (E) Heat map for H3K4me3 CUT&RUN signal visualized for TSS (±3 kb) of genes with Bcl11b binding at their promoter (TSS −1000 bp to +200 bp). (F) Profile plot for data displayed in E. (G) Enrichment of motifs at differential ATAC-seq and H3K27ac peaks. Color gradient represents row-scaled relative enrichment (z-score) based on the motif ln(P) value calculated by Homer (73).
Figure 5.
Figure 5.. Bcl11b binds at Tcf7 to control its expression and siIEL TRMP cell distribution.
(A) Genomic tracks at Tcf7 locus from Bcl11b ChIP-seq analysis in WT murine TRM-like cells; Tcf1 CUT&RUN, H3K27ac ChIP-seq, H3K4me3 CUT&RUN in Bcl11b−/− and WT murine TRM-like cells and ATAC-seq in Bcl11b−/− and WT murine siIEL TRMPs. (B) BCL11B ChIP-seq in human memory CD3+CD8+CD45RA+CD57+CCR7 T cells at the TCF7 locus. Data are from two donors. For (A-B), the rectangles below Bcl11b tracks represent reproducible (based on IDR) ChIP-seq peaks. The rectangles below all other tracks represent significantly differential peaks between WT and Bcl11b−/− cells. (C) Heat map for Tcf1 CUT&RUN signal visualized for TSS (±3 kb) with or without Bcl11b binding at gene promoter (TSS −1000 bp to +200 bp); further categorized for genes with decreased or increased expression in Bcl11b−/− cells. (D) Heat map for Tcf1 CUT&RUN signal visualized for Bcl11b peaks (scaled to 1000 bp, ±3 kb), associated with regions with either significantly increased or decreased chromatin accessibility (P < 0.05). (E) Representative histograms (left) and quantification (right) of Tcf1 expression in the siIEL for indicated groups. (F-G) Quantification of EV or Tcf7-transduced (GFP+) Bcl11b−/− or WT CD44+ CD8+ T cells in siIEL (F) or spleen (G). P values by paired Student’s t-test. Data are mean ± SEM with n=5–7. Representative of 3 independent experiments.
Figure 6.
Figure 6.. Bcl11b binds at Prdm1 and Ahr loci to control their expression and siIEL TRMP and TRM cell distribution.
(A and C) Genomic tracks at Prdm1 and Ahr loci for Bcl11b ChIP-seq in WT murine TRM-like cells; H3K27ac ChIP-seq and H3K4me3 CUT&RUN in Bcl11b−/− and WT murine TRM-like cells and ATAC-seq in Bcl11b−/− and WT murine siIEL TRMPs. (B and D) BCL11B ChIP-seq in human memory CD3+CD8+CD45RA+CD57+CCR7 cells at the PRDM1 and AHR loci. Data is from two donors. For (A-D), the rectangles below Bcl11b tracks represent reproducible (based on IDR) ChIP-seq peaks. The rectangles below all other tracks represent significantly differential peaks between WT and Bcl11b−/− cells. (E) Heat map for Ahr ChIP-seq signal visualized for TSS (±3 kb) of genes with or without Bcl11b binding at their promoter (TSS −1000 bp to +200 bp); further categorized for genes with decreased or increased expression in Bcl11b−/− cells. (F) Heat map for Ahr ChIP-seq signal visualized for Bcl11b peaks (scaled to 1000 bp, ±3 kb), associated with regions with either significantly increased or decreased chromatin accessibility (P < 0.05). (G-H) Quantification of transferred Bcl11b−/−/WT ratios siIEL CD69+CD103+ cells (G) or splenic cells (H) in mice on regular diet (7912) or Ahr-ligand deficient diet (AIN76a). (I) Percentages and numbers of CD45.1+ CD8+ T cells of recipient mice in the indicated groups. (J) Ahr MFIs in transferred Bcl11b−/− and WT siIEL CD69+CD103+ cells in the indicated groups. (K) Percentages of CD69+CD103+ Bcl11b−/− and WT TRM-like CD8+ T cells transduced with CRISPR gAhr alone or gAhr+gPrdm1. Data are mean ± SEM with n=3–7. Representative of 2–3 independent experiments. P values by two-tailed unpaired Student’s t-test; in K adjusted for multiple comparisons by the FDR method.
Figure 7.
Figure 7.. Bcl11b represses genes of the NK and myeloid programs across memory and effector CD8+ T cells.
(A) Heat map of NK receptor and effector genes, and myeloid genes upregulated in Bcl11b−/− Day 9 TEs, MPs and siIEL TRMPs, Day 30 siIEL TRMs and recall siIEL CD8+ T cells 2 days post-infection. Heatmap shows relative log2 expression fold change. (B-D) Genomic tracks at NK cell receptor, Itgam, Itgax and Fcer1g loci from Bcl11b ChIP-seq analysis in WT murine TRM-like cells, H3K27ac ChIP-seq and H3K4me3 CUT&RUN in Bcl11b−/− and WT TRM-like cells and ATAC-seq in Bcl11b−/− and WT siIEL TRMPs. H3K27ac ChIP-seq for the NK receptor locus from (69). (E, F) BCL11B ChIP-seq in human memory CD3+CD8+CD45RA+CD57+CCR7 T cells at the NK cell receptor and ITGAM and ITGAX loci. Data is from two donors.
Figure 8.
Figure 8.. Depletion of BCL11B in human memory CD8+ T cells or TRM-like cells causes changes in expression of markers of the TRM and NK program.
(A) Quantification of Bcl11b knockout efficiency and representative histograms. (B-C) Flow cytometry plots and quantification of molecules associated with residency program (B) and NK receptors (C) in WT and BCL11B−/− TRM-like cells following CRISPR/Cas9 mediated knockout with the indicated guides. Points represent individual donors. P values by two-way ANOVA followed by Tukey’s test.

References

    1. Joshi NS, Cui W, Chandele A, Lee HK, Urso DR, Hagman J, Gapin L, Kaech SM, Inflammation directs memory precursor and short-lived effector CD8(+) T cell fates via the graded expression of T-bet transcription factor. Immunity 27, 281–295 (2007). - PMC - PubMed
    1. Masopust D, Vezys V, Marzo AL, Lefrancois L, Preferential localization of effector memory cells in nonlymphoid tissue. Science 291, 2413–2417 (2001). - PubMed
    1. Wherry EJ, Teichgraber V, Becker TC, Masopust D, Kaech SM, Antia R, von Andrian UH, Ahmed R, Lineage relationship and protective immunity of memory CD8 T cell subsets. Nat Immunol 4, 225–234 (2003). - PubMed
    1. Sallusto F, Lenig D, Forster R, Lipp M, Lanzavecchia A, Two subsets of memory T lymphocytes with distinct homing potentials and effector functions. Nature 401, 708–712 (1999). - PubMed
    1. Jameson SC, Masopust D, Understanding Subset Diversity in T Cell Memory. Immunity 48, 214–226 (2018). - PMC - PubMed

Publication types