. 2023 Apr 28;9(17):eade8184.
doi: 10.1126/sciadv.ade8184. Epub 2023 Apr 28.

TWIST2-mediated chromatin remodeling promotes fusion-negative rhabdomyosarcoma

Affiliations

TWIST2-mediated chromatin remodeling promotes fusion-negative rhabdomyosarcoma

Akansha M Shah et al. Sci Adv. .

Abstract

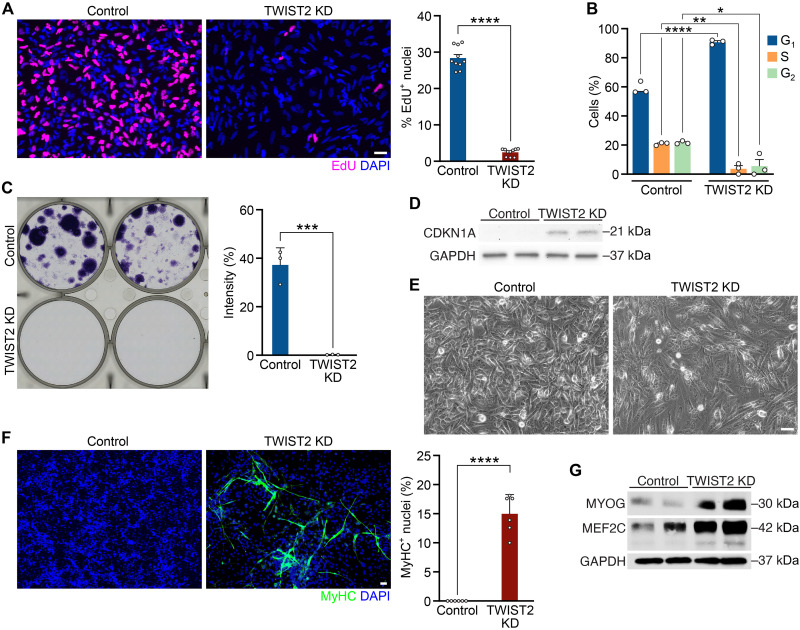
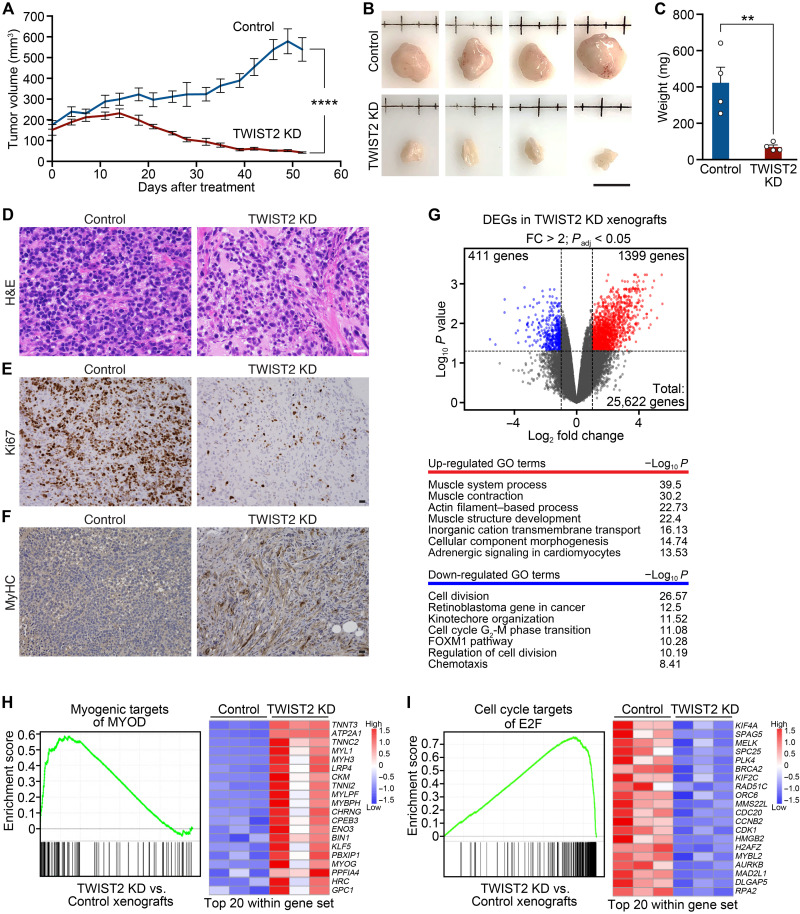
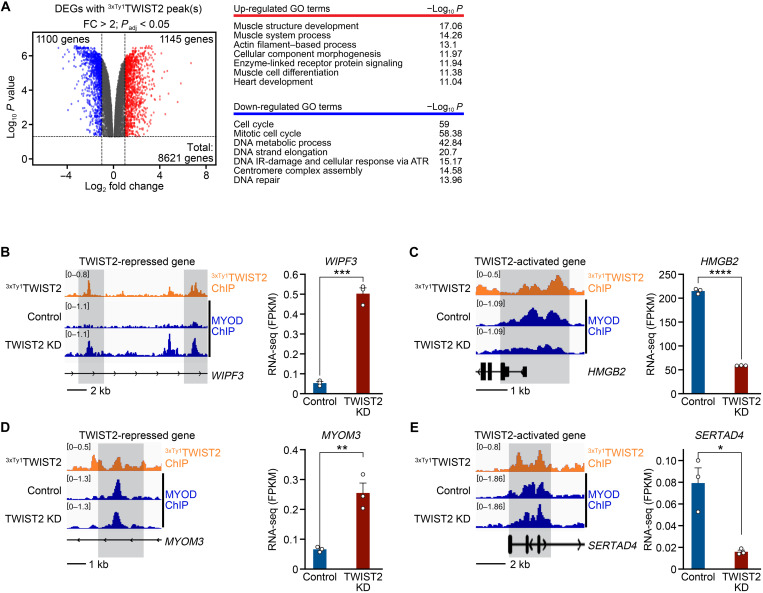
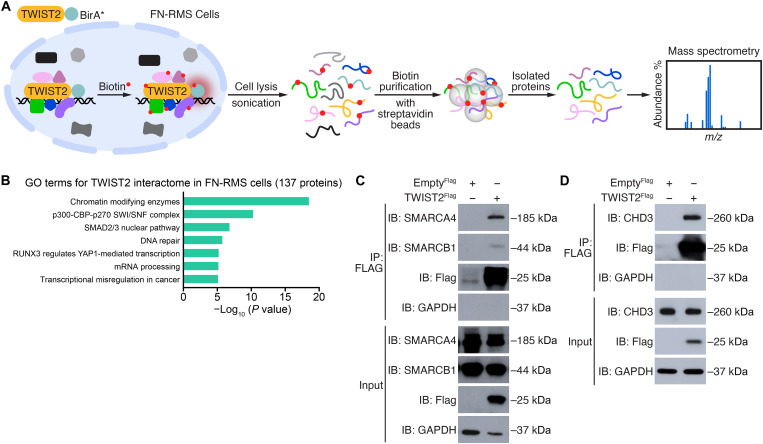
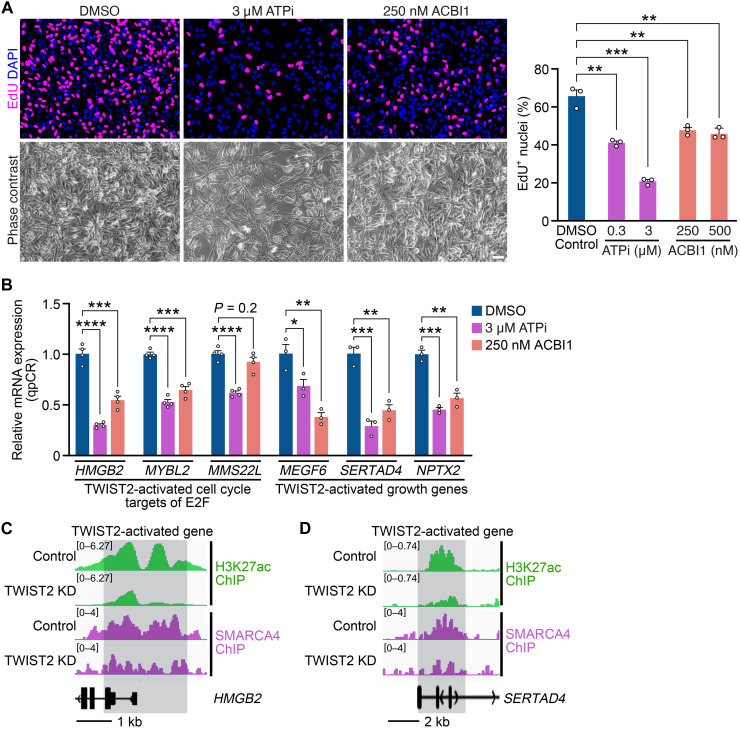
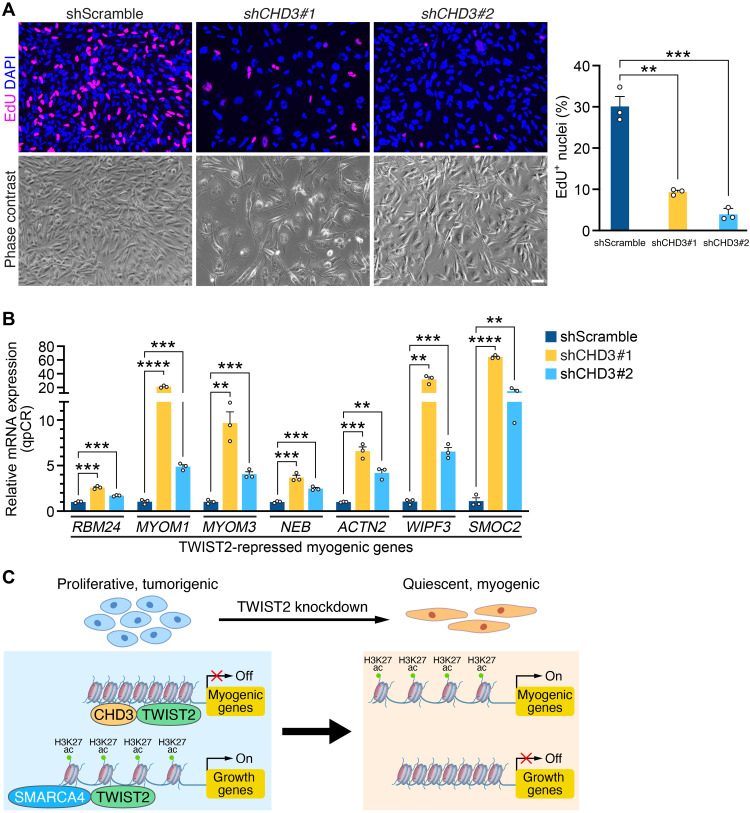
Rhabdomyosarcoma (RMS) is a common soft tissue sarcoma in children that resembles developing skeletal muscle. Unlike normal muscle cells, RMS cells fail to differentiate despite expression of the myogenic determination protein MYOD. The TWIST2 transcription factor is frequently overexpressed in fusion-negative RMS (FN-RMS). TWIST2 blocks differentiation by inhibiting MYOD activity in myoblasts, but its role in FN-RMS pathogenesis is incompletely understood. Here, we show that knockdown of TWIST2 enables FN-RMS cells to exit the cell cycle and undergo terminal myogenesis. TWIST2 knockdown also substantially reduces tumor growth in a mouse xenograft model of FN-RMS. Mechanistically, TWIST2 controls H3K27 acetylation at distal enhancers by interacting with the chromatin remodelers SMARCA4 and CHD3 to activate growth-related target genes and repress myogenesis-related target genes. These findings provide insights into the role of TWIST2 in maintaining an undifferentiated and tumorigenic state of FN-RMS and highlight the potential of suppressing TWIST2-regulated pathways to treat FN-RMS.


Figures

Fig. 1.
Fig. 1.. TWIST2 KD inhibits growth and promotes myogenic differentiation of FN-RMS cells.
(A) Left: EdU (magenta) immunocytochemistry of Control (untreated) and TWIST2 KD (treated with Dox) RD cells 4 days after ±‌ Dox treatment. Nuclei were stained with 4′,6-diamidino-2-phenylindole (DAPI) (blue). Right: Quantification of the percentage of EdU+ nuclei. Scale bar, 50 μm. n = 10 biologically independent samples. (B) Quantification of the percentage of Control and TWIST2 KD RD cells in the G1, S, or G2 stages. n = 3 biologically independent samples. (C) Left: Single-cell colony formation assay for Control and TWIST2 KD RD cells 15 days after ±‌ Dox treatment. Right: Quantification of the percent intensity of weighted colony area. n = 3 biologically independent samples. (D) Western blot showing an increase of CDKN1A protein level in TWIST2 KD RD cells compared to Control cells 4 days after ±‌ Dox treatment. Glyceraldehyde-3-phosphate dehydrogenase (GAPDH) was used as the loading control. (E) Phase contrast images of Control and TWIST2 KD RD cells 4 days after ±‌ Dox treatment. Scale bar, 50 μm. (F) Left: Anti–myosin heavy chain (MyHC) (green) immunocytochemistry of Control and TWIST2 KD RD cells cultured for 5 days in differentiation media ±‌ Dox. Nuclei were stained with DAPI (blue). Right: Quantification of percent of MyHC+ nuclei. Scale bar, 50 μm. n = 6 biologically independent samples. (G) Western blot showing increased protein levels of myogenin (MYOG) and myocyte enhancer factor 2C (MEF2C) in TWIST2 KD RD cells compared to Control cells 4 days after ±‌ Dox treatment. GAPDH was used as the loading control. All statistical comparisons between groups were evaluated by unpaired Student’s t test, ****P < 0.0001, ***P < 0.001, **P < 0.01, and *P < 0.05. Data are presented as the mean ± SEM.
Fig. 2.
Fig. 2.. TWIST2 KD reduces FN-RMS tumor xenograft growth and induces terminal differentiation in vivo.
(A) Growth curve of RD mouse tumor xenograft volume (mm3) plotted following the initiation of Dox treatment (Day 0) to TWIST2 KD. Control tumors were not treated with Dox. n = 8 mice for Control, 8 mice for TWIST2 KD. (B) Images of Control and TWIST2 KD tumors harvested 52 days after initiation of Dox treatment (the end point). Scale bar, 1 cm. (C) Weights (mg) of Control and TWIST2 KD tumors harvested at end point. n = 4 mice for Control, 4 mice for TWIST2 KD. (D) H&E of Control and TWIST2 KD tumors harvested at end point. Scale bar, 50 μm. (E) Immunohistochemistry for Ki67 on Control and TWIST2 KD tumors harvested at end point. Scale bar, 50 μm. (F) Immunohistochemistry of anti-MyHC (using the MF20 antibody) on Control and TWIST2 KD tumors harvested at end point. Scale bar, 50 μm. (G) Top: Volcano plot of the up-regulated genes (red) and down-regulated genes (blue) in TWIST2 KD RD tumor xenografts relative to the Control tumors identified by RNA-seq. A cutoff of fold change (FC) > 2 and Padj < 0.05 was used to identify differentially expressed genes (DEGs) by RNA-seq. Bottom: Top enriched Gene Ontology (GO) terms are shown. (H) Left: Gene set enrichment analysis (GSEA) plot showing positive enrichment for genes that are myogenic targets of MYOD in TWIST2 KD relative to Control tumors. Right: Heatmap plotting the gene expression of top 20 mRNA targets of MYOD. (I) Left: GSEA plot showing negative enrichment for genes that are cell cycle targets of E2 factor (E2F) in TWIST2 KD relative to Control tumors. Right: Heatmap plotting the gene expression of top 20 mRNA targets of E2F. All statistical comparisons between groups were evaluated by unpaired Student’s t test, ****P < 0.0001 and **P < 0.01. Data are presented as the mean ± SEM.
Fig. 3.
Fig. 3.. TWIST2 is a direct transcriptional activator of growth and inhibitor of myogenesis in FN-RMS.
(A) Left: Volcano plot of direct transcriptional TWIST2 target genes as identified by 3xTy1TWIST2 ChIP-seq and RNA-seq intersection in TWIST2 KD relative to Control RD cells. TWIST2 peaks whose nearest gene is up-regulated are shown in red, and TWIST2 peaks whose nearest gene is down-regulated are shown in blue. A cutoff of FC > 2 and false discovery rate (FDR) P value < 0.05 was used to identify DEGs by RNA-seq. Right: Top enriched GO terms are shown. (B to E) Left: ChIP-seq tracks where MYOD peaks in Control and TWIST2 KD RD cells are shown in blue, and 3xTy1TWIST2 peaks in RD cells are shown in orange. Right: Bar graph plotting FPKM (fragments per kilobase of exon per million mapped fragments) expression values from RNA-seq in Control and TWIST2 KD RD cells. (B) Left: Both TWIST2 and MYOD bound to the WIPF3 locus. In TWIST2 KD cells, MYOD binding was increased. Right: WIPF3 mRNA expression is increased in TWIST2 KD cells. (C) Left: Both TWIST2 and MYOD bound to the HMGB2 locus. In TWIST2 KD cells, MYOD binding was decreased. Right: HMGB2 mRNA expression is decreased in TWIST2 KD cells. (D) Left: Both TWIST2 and MYOD bound the MYOM3 locus. In TWIST2 KD cells, MYOD binding was not changed. Right: MYOM3 mRNA expression is increased in TWIST2 KD cells. (E) Left: Both TWIST2 and MYOD bound to the SERTAD4 locus. In TWIST2 KD cells, MYOD binding was not changed. Right: SERTAD4 mRNA expression is decreased in TWIST2 KD cells. All statistical comparisons between groups were evaluated by unpaired Student’s t test, ****P < 0.0001, ***P < 0.001, **P < 0.01, and *P < 0.05. Data are presented as the mean ± SEM.
Fig. 4.
Fig. 4.. TWIST2 controls enhancer activity and chromatin state in FN-RMS.
(A) Heatmap of differentially enriched (DE) H3K27ac peaks in TWIST2 KD relative to Control RD cells and 3xTy1TWIST2 peaks at the same genomic loci. Only H3K27ac peaks whose nearest gene is similarly regulated by RNA-seq were plotted. Genomic regions ±10 kb from the peak center were plotted. A significance of FDR P value < 0.05 was used to identify DEGs and DE H3K27ac peaks, only DE peaks with a FC > 2 were plotted. IP, immunoprecipitation. (B) Top enriched Genomic Regions Enrichment of Annotations Tool (GREAT) terms are shown for the (top) 2321 TWIST2-bound H3K27ac-gained peaks in TWIST2 KD cells and the (bottom) 1845 TWIST2-bound H3K27ac lost peaks in TWIST2 KD cells. MAPK, mitogen-activated protein kinase; ERK, extracellular signal–regulated kinase. (C and D) Heatmaps showing transcription factor binding motifs uniquely enriched in enhancers that are (C) gained and (D) lost in TWIST2 KD RD cells. (E) Bar graph plotting FPKM expression values of E2F1, E2F2, and TFDP1 transcripts from RNA-seq in Control and TWIST2 KD RD cells. E2F1, E2F2, and TFDP1 mRNA expression is decreased in TWIST2 KD cells. n = 3 biologically independent samples. (F) qRT-PCR analysis of indicated genes in Control and TWIST2 KD RD cells infected with Empty3xFlag or a combination of E2F13xFlag, E2F23xFlag, and TFDP13xFlag for 3 days (relative to Empty3xFlag-infected Control cells, normalized to 18S rRNA). n = 3 biologically independent samples. All statistical comparisons between groups were evaluated by unpaired Student’s t test, ****P < 0.0001, ***P < 0.001, **P < 0.01, and *P < 0.05. Data are presented as the mean ± SEM.
Fig. 5.
Fig. 5.. BioID and mass spectrometry reveal that TWIST2 interacts with chromatin remodeling enzymes in FN-RMS cells.
(A) Schematic of BioID performed in both RD and SMS-CTR cells independently to identify TWIST2-interacting proteins. A BirA* biotin ligase fused to TWIST2 (TWIST2-BirA*) labeled any proteins within 10 nm. After cell lysis and sonication, the biotin-labeled proteins were captured using streptavidin beads and identified by mass spectrometry. m/z, mass/charge ratio. (B) GO analysis of 137 high confidence TWIST2-interacting proteins that are common in RD and SMS-CTR cells. (C and D) Endogenous (C) SMARCA4 and SMARCB1 proteins and (D) CHD3 were pulled down after immunoprecipitation of Flag from lysates of RD cells infected with a lentivirus for Empty3xFlag or TWIST23xFlag. GAPDH was used as the loading control. IP, immunoprecipitate; IB, immunoblot.
Fig. 6.
Fig. 6.. Inhibition of SMARCA4 activity in FN-RMS cells represses TWIST2-activated growth genes.
(A) Left: EdU (magenta) immunocytochemistry of RD cells treated with DMSO, 3 μM ATPi, or 250 nM ACBI1 for 2 days followed by EdU incorporation for 4 hours. Nuclei were stained with DAPI (blue). Phase contrast images are shown below. Right: Quantification of the percentage of EdU+ nuclei using data from (A) and fig. S6A. Scale bar, 50 μm. n = 3 biologically independent samples. (B) qRT-PCR analysis of indicated genes in RD cells treated with DMSO, 3 μM ATPi, or 250 nM ACBI1 for 2 days (relative to DMSO, normalized to 18S rRNA). n = 3 biologically independent samples. (C and D) ChIP-seq tracks where H3K27ac peaks are shown in green, and SMARCA4 peaks are shown in purple. (C) ChIP-seq tracks of the MYOD-dependent HMGB2 locus in Control and TWIST2 KD RD cells. HMGB2 is a direct TWIST2-activated gene that showed decreases in SMARCA4 binding and H3K27ac deposition at its locus in TWIST2 KD cells. (D) ChIP-seq tracks of the MYOD-independent SERTAD4 locus in Control and TWIST2 KD RD cells. SERTAD4 is a direct TWIST2-activated gene that showed decreases in SMARCA4 binding and H3K27ac deposition at its locus in TWIST2 KD cells. All statistical comparisons between groups were evaluated by unpaired Student’s t test, ****P < 0.0001, ***P < 0.001, **P < 0.01, and *P < 0.05. Data are presented as the mean ± SEM.
Fig. 7.
Fig. 7.. CHD3 KD activates TWIST2-repressed myogenic genes in FN-RMS cells.
(A) Left: EdU (magenta) immunocytochemistry of RD cells infected with a shScramble control or shRNAs to knockdown CHD3 (shCHD3#1 or shCHD3#2) for 3 days followed by EdU incorporation for 4 hours. Nuclei were stained with DAPI (blue). Phase contrast images are shown below. Right: Quantification of the percentage of EdU+ nuclei. Scale bar, 50 μm. n = 3 biologically independent samples. (B) qRT-PCR analysis of indicated genes in RD cells infected with shScramble, shCHD3#1, or shCHD3#2 for 3 days (relative to shScramble, normalized to 18S rRNA). n = 3 biologically independent samples. (C) Model describing the mechanism of TWIST2 function in FN-RMS cells. In cycling cells, TWIST2 interacts with CHD3 at loci in myogenic genes to restrict H3K27ac deposition and turn off gene expression. TWIST2 also interacts with SMARCA4, and at growth gene loci, these proteins together enable H3K27ac deposition and activate gene expression. This is reversed in TWIST2 KD FN-RMS cells, where myogenic genes are activated fand growth genes are repressed, leading to cell cycle exit and terminal myogenic differentiation. All statistical comparisons between groups were evaluated by unpaired Student’s t test, ****P < 0.0001, ***P < 0.001, and **P < 0.01. Data are presented as the mean ± SEM.

References

    1. M. Buckingham, P. W. J. Rigby, Gene regulatory networks and transcriptional mechanisms that control myogenesis. Dev. Cell 28, 225–238 (2014). - PubMed
    1. C. F. Bentzinger, Y. X. Wang, M. A. Rudnicki, Building muscle: Molecular regulation of myogenesis. Cold Spring Harb. Perspect. Biol. 4, a008342 (2012). - PMC - PubMed
    1. S. X. Skapek, A. Ferrari, A. A. Gupta, P. J. Lupo, E. Butler, J. Shipley, F. G. Barr, D. S. Hawkins, Rhabdomyosarcoma. Nat. Rev. Dis. Primers 5, 1 (2019). - PMC - PubMed
    1. R. Saab, S. L. Spunt, S. X. Skapek, Myogenesis and rhabdomyosarcoma the Jekyll and Hyde of skeletal muscle. Curr. Top. Dev. Biol. 94, 197–234 (2011). - PubMed
    1. S. J. Tapscott, M. J. Thayer, H. Weintraub, Deficiency in rhabdomyosarcomas of a factor required for MyoD activity and myogenesis. Science 259, 1450–1453 (1993). - PubMed

MeSH terms