. 2023 May 8;41(5):933-949.e11.
doi: 10.1016/j.ccell.2023.04.003. Epub 2023 Apr 27.

Systematic elucidation and pharmacological targeting of tumor-infiltrating regulatory T cell master regulators

Affiliations

Systematic elucidation and pharmacological targeting of tumor-infiltrating regulatory T cell master regulators

Aleksandar Obradovic et al. Cancer Cell. .

Abstract

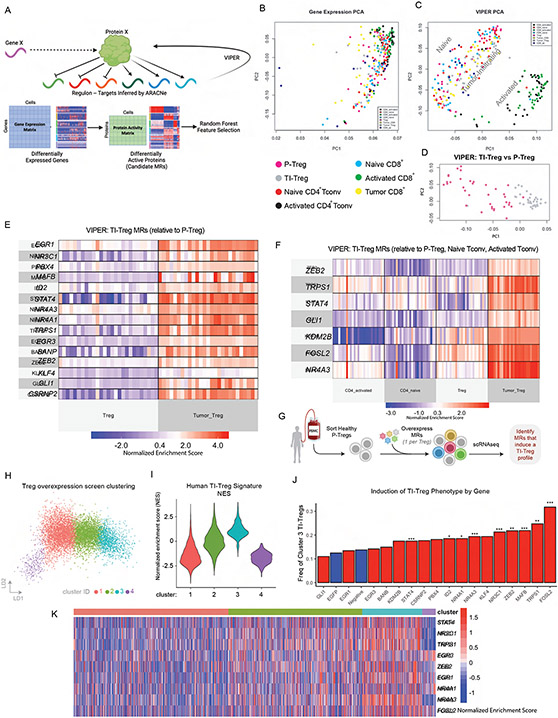
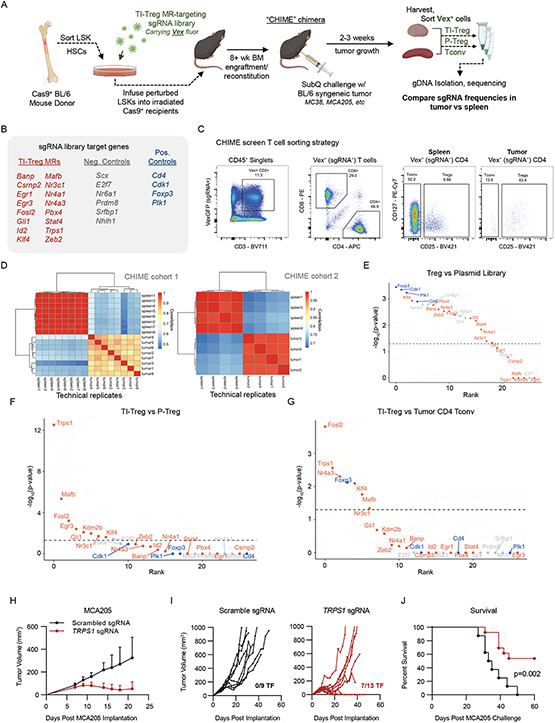
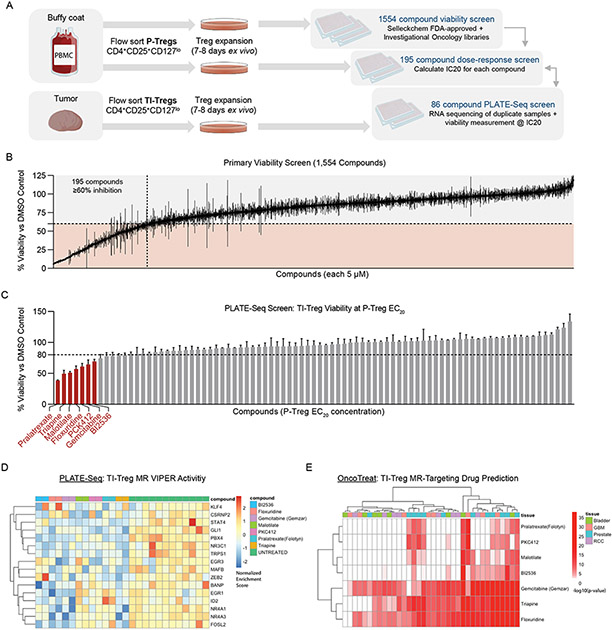
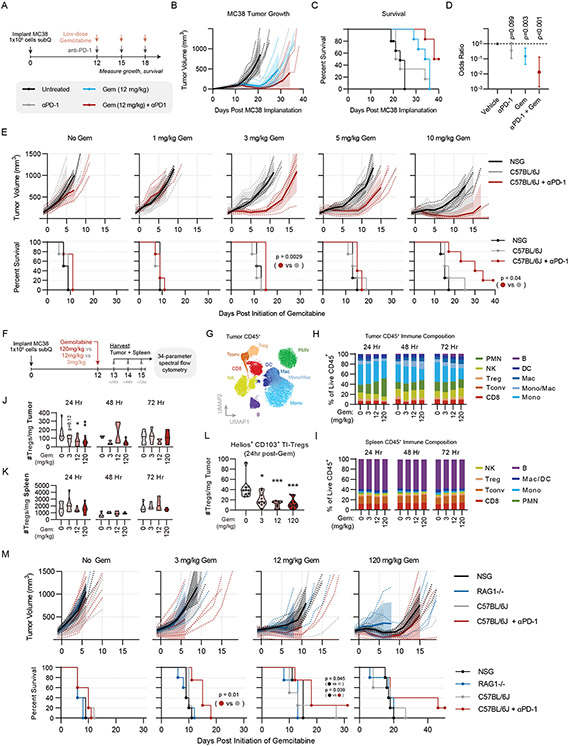
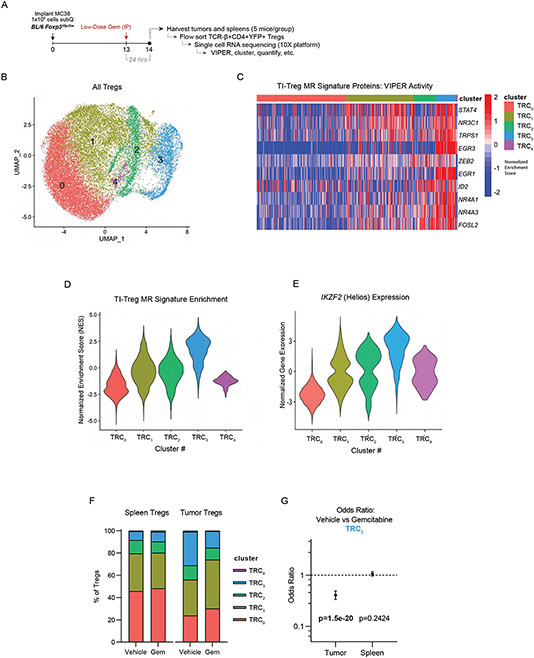
Due to their immunosuppressive role, tumor-infiltrating regulatory T cells (TI-Tregs) represent attractive immuno-oncology targets. Analysis of TI vs. peripheral Tregs (P-Tregs) from 36 patients, across four malignancies, identified 17 candidate master regulators (MRs) as mechanistic determinants of TI-Treg transcriptional state. Pooled CRISPR-Cas9 screening in vivo, using a chimeric hematopoietic stem cell transplant model, confirmed the essentiality of eight MRs in TI-Treg recruitment and/or retention without affecting other T cell subtypes, and targeting one of the most significant MRs (Trps1) by CRISPR KO significantly reduced ectopic tumor growth. Analysis of drugs capable of inverting TI-Treg MR activity identified low-dose gemcitabine as the top prediction. Indeed, gemcitabine treatment inhibited tumor growth in immunocompetent but not immunocompromised allografts, increased anti-PD-1 efficacy, and depleted MR-expressing TI-Tregs in vivo. This study provides key insight into Treg signaling, specifically in the context of cancer, and a generalizable strategy to systematically elucidate and target MR proteins in immunosuppressive subpopulations.

Keywords: TRPS1; cancer systems biology; gemcitabine; master regulator analysis; regulatory T cells; tumor immunology.


Conflict of interest statement

Declaration of interests C.G.D. is a co-inventor on patents licensed from JHU to BMS and Janssen; has served as a paid consultant to AZ Medimmune, BMS, Pfizer, Roche, Sanofi Aventis, Genentech, Merck, and Janssen; and has received sponsored research funding to his institution from BMS IioN and Janssen. A.C. is founder, equity holder, consultant, and director of DarwinHealth, Inc., which has licensed IP related to these algorithms from Columbia University. Columbia University is an equity holder in DarwinHealth, Inc. S.Y. has received sponsored research support to his institution from Celgene/BMS, Janssen, and Cepheid/Danaher and has served as a paid consultant to Cepheid/Danaher. A.O., C.A., C.G.D., and A.C. are co-inventors on US provisional patent no. 63/188,970, “Therapeutic modulation of regulatory T cells through master regulatory protein targeting,” which relates to the work described here.

Figures

Figure 1:
Figure 1:. VIPER Enables Definition of Tumor vs Peripheral Treg Master Regulator Signature:
(A) Conceptual plot of ARACNe/VIPER protein activity inference process. (B) Principal Component Analysis (PCA) plot of Gene Expression colored by T cell , as indicated. P-Treg: peripheral Treg, TI-Treg: tumor-infiltrating Treg. (C) PCA plot of VIPER-inferred protein activity, colored as in B, showing spatial separation of T-cell sub-types. (D) PCA plot of VIPER-inferred protein activity separating TI-Tregs and P-Tregs only, colored as in B,C. (E) Heatmap of VIPER Protein Activity for Master Regulators Identified by Random Forest Feature Selection as best distinguishing TI-Tregs vs P-Tregs. (F) Heatmap of VIPER Protein Activity for Master Regulators Identified by Random Forest Feature Selection as best distinguishing TI-Tregs vs all peripheral controls (P-Tregs, Naïve Tconv, Activated Tconv). (G) Experimental design of over-expression screen, where the predicted TI-Treg MR ORFs (17 in total) are individually overexpressed in sorted P-Tregs and then 7 days later profiled by scRNA-seq. (H) LDA Plot showing unsupervised clustering of Treg phenotypes by scRNA-seq from experiment described in E. (I) Violinplot of cell-by-cell Gene Set Enrichment (GSEA) of 27 TI-Treg MRs for cells shown in F, such that cluster 3 cells are significantly enriched for TI-Treg signature. (J) Barplot of cluster 3 frequencies grouped by over-expressed gene, where negative controls (no gene overexpressed and EGFP overexpressed) are colored blue, and candidate MRs are colored red. *** indicates p<0.001 relative to negative control, ** indicates p<0.01, * indicates p<0.05, by Bonferroni-Adjusted Fisher’s Exact Test. (K) Heatmap of protein activity for inferred TI-Treg MR proteins at single-cell level, in the experiment described in G-J. Grouped by cluster as in H,I. Shows Co-upregulation of entire MR module in every cell from cluster 3, regardless of which individual MR was over-expressed. See also Figures S1 and S2.
Figure 2:
Figure 2:. Chimeric Immune Editing Mouse Model Enables Validation of Treg Tumor-Infiltration Master Regulators:
(A) Experimental design for in vivo CRISPR KO Validation of TI-Treg MRs (B) List of sgRNAs targeting 17 TI-Treg MRs, 6 negative control genes, and 4 positive control genes. (C) Representative flow cytometry gating for Vex+ CRISPR-transduced Tregs, CD4nonTregs, and CD8+ T cells in spleen and tumor. (D) Correlation of sgDNA frequency distribution between replicates of spleen and tumor Tregs in experimental cohorts 1 (top) and 2 (bottom). Within each cohort, samples of spleen and tumor represent technical replicates of pooled tissue, while the two cohorts are themselves independent biological replicate experiments. (E) Plot of -log10(Bonferroni-corrected p-value) versus p-value rank for gene depletion in P-Tregs versus input plasmid library, where blue indicates positive control genes, red indicates candidate TI-Treg MRs, and grey indicates negative controls. Horizontal dashed line indicates p=0.05 (F) Plot of -log10(Bonferroni-corrected p-value) versus p-value rank for gene depletion in TI-Tregs versus P-Tregs, with color-coding and dashed line as in E. (G) Plot of −log10(Bonferroni-corrected p-value) versus p-value rank for gene depletion in TI-Tregs versus Tumor-Infiltrating CD4nonTregs, with color-coding and dashed line as in E. (H) Tumor growth curves of MCA205 (8x10⁵ implanted subcutaneously) in mice bearing single gene Trps1 sgRNAs (red) versus scrambled sgRNAs (black) in the hematopoietic lineage. Data shown as average across mice (I) Individual growth curves of mice in H, with numbers of mice tumor free (TF) noted. (J) Kaplan-Meier plot for overall survival time of mice in I, showing significant difference in tumor growth (p=0.002 by logrank test). See also Figure S2.
Figure 3:
Figure 3:. High-Throughput Drug Screening Platform Identifies Potential Drug Candidates with Tumor-Treg-Directed Toxicity:
(A) Experimental design of High-Throughput Treg-Directed Drug Toxicity Screen. (B) Results from initial set of 1,554 FDA-approved and investigational oncology compounds screened at single-dose for peripheral Treg growth inhibition, with 195 compounds showing >60% inhibition at 5μM. (C) Viability results of the PLATE-Seq screen, where human tumor Tregs were assessed for growth inhibition on sorted Tumor Tregs at peripheral-Treg EC20 dose, resulting in 7 drugs with higher toxicity in TI-Tregs relative to P-Tregs. Data shown as % viability for each drug vs. DMSO control (D) Heatmap of VIPER protein activity for Tumor vs Peripheral Treg MRs defined in 1E, 1F comparing transcriptional effect of drugs in (C) vs untreated control, with downregulation of nearly all identified Master Regulators by these drugs. (E) Patient-by-Patient Drug predictions according to inversion of patient Tumor Treg vs Peripheral Treg protein activity signature by drug-treatment protein activity signature. Each drug predicted to invert Tumor Treg signature with - log10(Bonferroni-Corrected p-value) < 0.01 in a particular patient is colored red. Patients are grouped by tumor type. Subset to drugs identified by tumor Treg growth screen in (C), with columns colored by tumor type and clustered by unsupervised hierarchical clustering. See also Figures S3 and S4.
Figure 4:
Figure 4:. Low-Dose Gemcitabine is Immunogenic and Potentiates anti-PD-1 Therapy:
(A) Schematic of in vivo validation studies. Experiment consists of 6 mice per group. (B) Tumor growth curves for each treatment group, (C) Kaplan-Meier survival curves, and (D) forest-plot showing the result of multiple cox regression assessing treatment effect on time-to-death for each of the treatments described in (A). Hazard ratios are shown with 95% confidence interval and p-value. Results are representative of two independent experiments. (E) Tumor growth and Kaplan Meier survival curves of NSG mice, C57BL/6J mice, and C57BL/6J mice exposed to anti-PD-1 therapy receiving the indicated dose of gemcitabine between 1-10 mg/kg. Statistical significance for survival was calculated by Mantel-cox log rank test. (F) Experimental design of flow cytometry experiment. (G) Overall flow cytometry clustering of tumor immune cells. (H) Stacked barplot of frequencies for clusters shown in G, split by timepoint and gemcitabine dose. (I) Stacked barplot of frequencies for clusters shown in G, split by timepoint and gemcitabine dose. (J) Violinplot of Treg absolute numbers per mg of tumor, split by timepoint and gemcitabine treatment dose, where * indicates p<0.05 and * indicates p<0.01 by two-way ANOVA with multiple testing correction. (K) Violinplot of Treg absolute numbers per mg of spleen, split by timepoint and gemcitabine treatment dose. (L) Violinplot of Helios+CD103+ TI-Treg cluster absolute numbers per mg tumor 24 hours post-treatment, split by gemcitabine dose. (M) Tumor growth and Kaplan Meier survival curves of NSG mice, RAG1-KO mice, C57BL/6J mice, and C57BL/6J mice exposed to anti-PD-1 therapy receiving the indicated dose of gemcitabine between 0-120 mg/kg. Statistical significance for survival was calculated by Wilcoxon test. All significant pairwise comparisons (p < 0.05) are shown. See also Figures S4 and S5.
Figure 5:
Figure 5:. Single-Cell RNA-Sequencing Suggests Low-Dose Gemcitabine Depletes TI-Tregs
Exhibiting high TI-Treg Master-Regulator Activity: (A) Schematic of experimental workflow. (B) UMAP plot and unsupervised clustering by VIPER-inferred protein activity of Tregs from untreated and gemcitabine-treated tumor and spleen. (C) Heatmap of cell-by-cell protein activity for each Tumor-Treg MR identified by scRNA-seq, grouped by cluster. (D) Distribution of the 17-gene TI-Treg MR signature normalized enrichment score by Gene Set Enrichment Analysis (GSEA), grouped by cluster, such that cluster TRC3 is most enriched for the TI-Treg MR signature. (E) Distribution of IKZF2 (Helios) Normalized Gene Expression, grouped by cluster, such that the cluster TRC3 has highest expression. (F) Barplot of cluster frequencies in each sample, such that cluster TRC3 has a baseline frequency of 7.8% in spleen of vehicle-control sample and 30.1% in tumor (p = 1.78e-84), with frequency of only 14.9% in tumor of gemcitabine-treated sample (p = 1.51e-20). (G) Cox proportional hazard ratios of cluster TRC3 frequencies in vehicle vs gemcitabine treated mice in tumor (OR = 0.407 [95% CI: 0.334-0.494]) and spleen (p = 0.242, OR = 1.063 [95% CI: 0.958-1.17]). See also Figure S6.

References

    1. Schreiber RD, Old LJ, and Smyth MJ (2011). Cancer Immunoediting: Integrating Immunity’s Roles in Cancer Suppression and Promotion. Science 331, 1565–1570. - PubMed
    1. Chao JL, and Savage PA (2018). Unlocking the Complexities of Tumor-Associated Regulatory T Cells. J Immunol 200, 415–421. - PMC - PubMed
    1. Flammiger A, Weisbach L, Huland H, Tennstedt P, Simon R, Minner S, Bokemeyer C, Sauter G, Schlomm T, and Trepel M (2013). High tissue density of FOXP3+ T cells is associated with clinical outcome in prostate cancer. European Journal of Cancer 49, 1273–1279. - PubMed
    1. Muroyama Y, Nirschl TR, Kochel CM, Lopez-Bujanda Z, Theodros D, Mao W, Carrera-Haro MA, Ghasemzadeh A, Marciscano AE, Velarde E, et al. (2017). Stereotactic Radiotherapy Increases Functionally Suppressive Regulatory T Cells in the Tumor Microenvironment. Cancer immunology research 5, 992–1004. - PMC - PubMed
    1. Obradovic AZ, Dallos MC, Zahurak ML, Partin AW, Schaeffer EM, Ross AE, Allaf ME, Nirschl TR, Liu D, Chapman CG, et al. (2020). T-Cell Infiltration and Adaptive Treg Resistance in Response to Androgen Deprivation With or Wthout Vaccination in Localized Prostate Cancer. Clinical cancer research : an official journal of the American Association for Cancer Research 26, 3182–3192. - PMC - PubMed

Publication types

MeSH terms