. 2023 May 31;43(22):4075-4092.
doi: 10.1523/JNEUROSCI.1913-22.2023. Epub 2023 Apr 28.

Structure and Function of Neuronal Circuits Linking Ventrolateral Preoptic Nucleus and Lateral Hypothalamic Area

Affiliations

Structure and Function of Neuronal Circuits Linking Ventrolateral Preoptic Nucleus and Lateral Hypothalamic Area

Kseniia Prokofeva et al. J Neurosci. .

Abstract

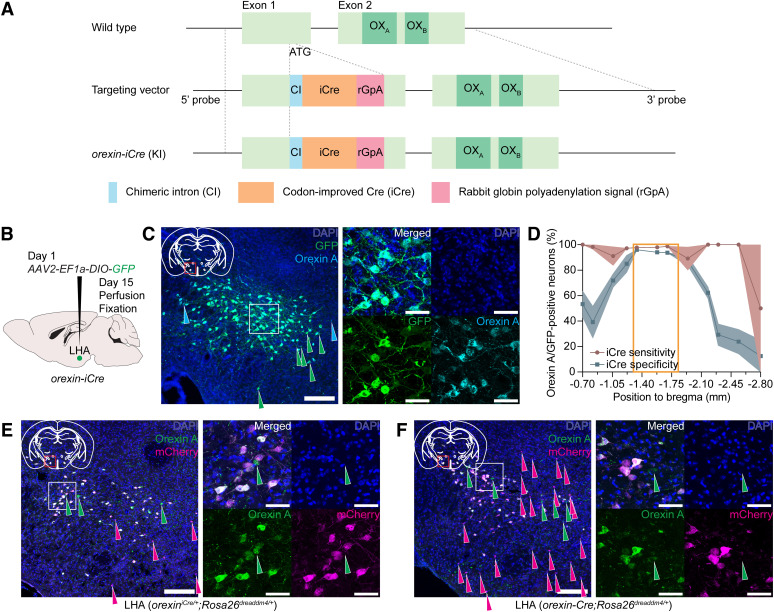
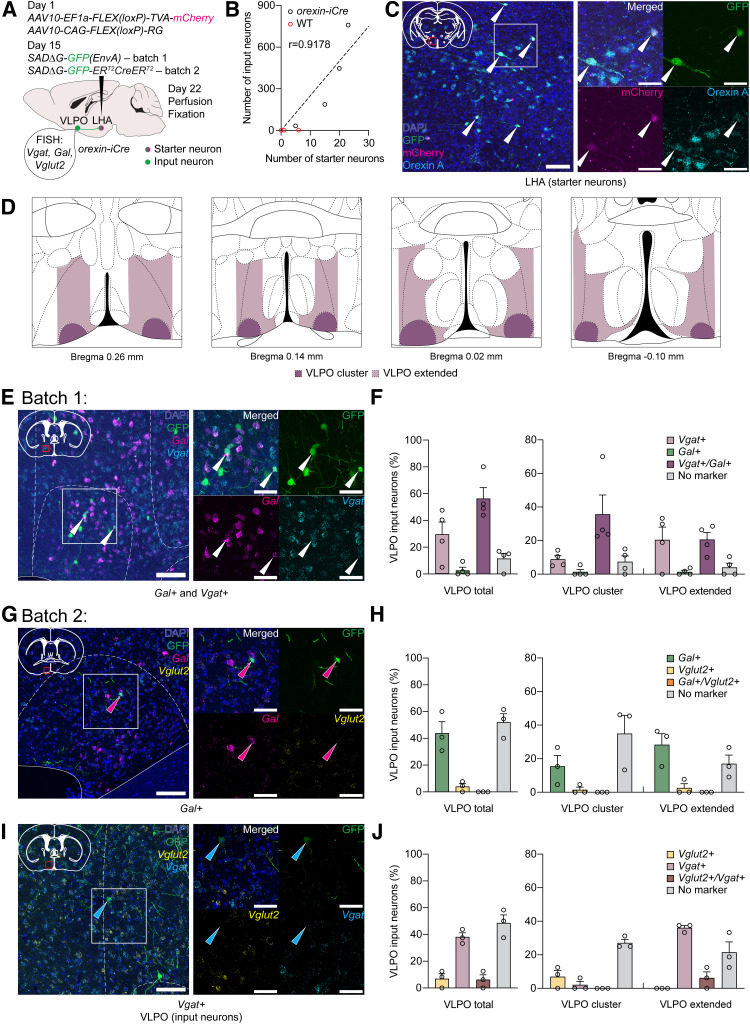
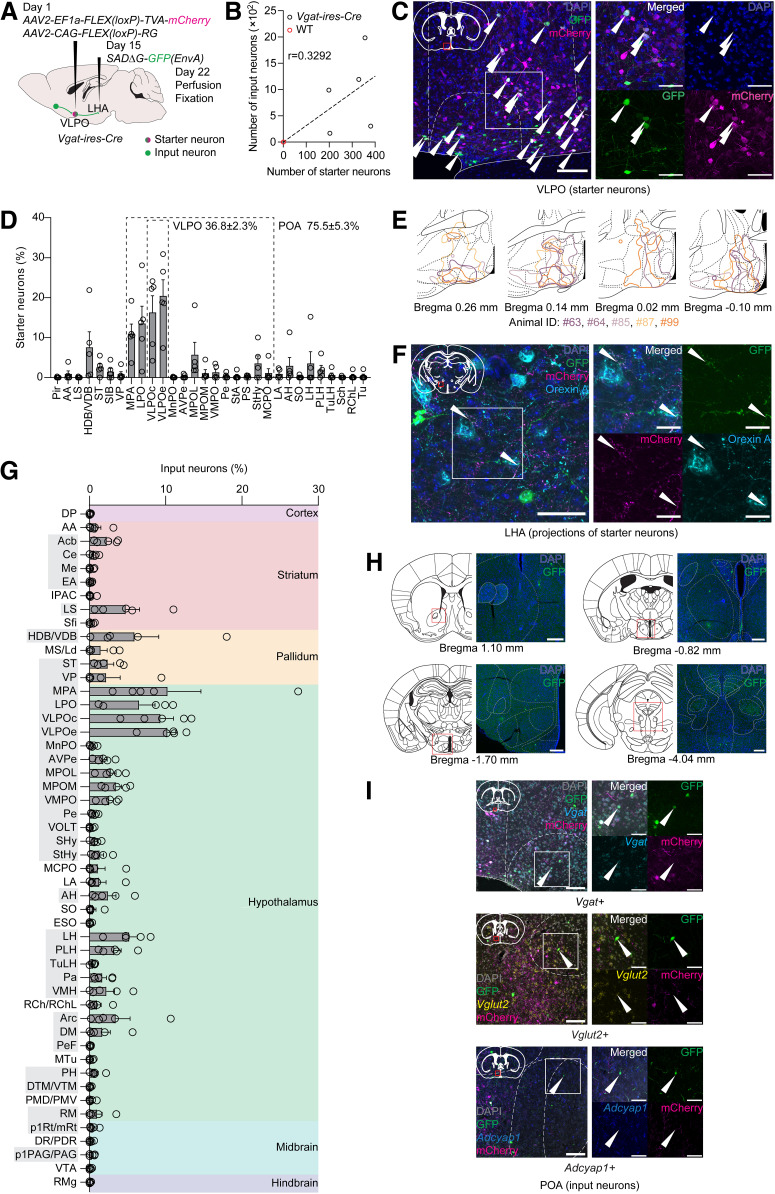
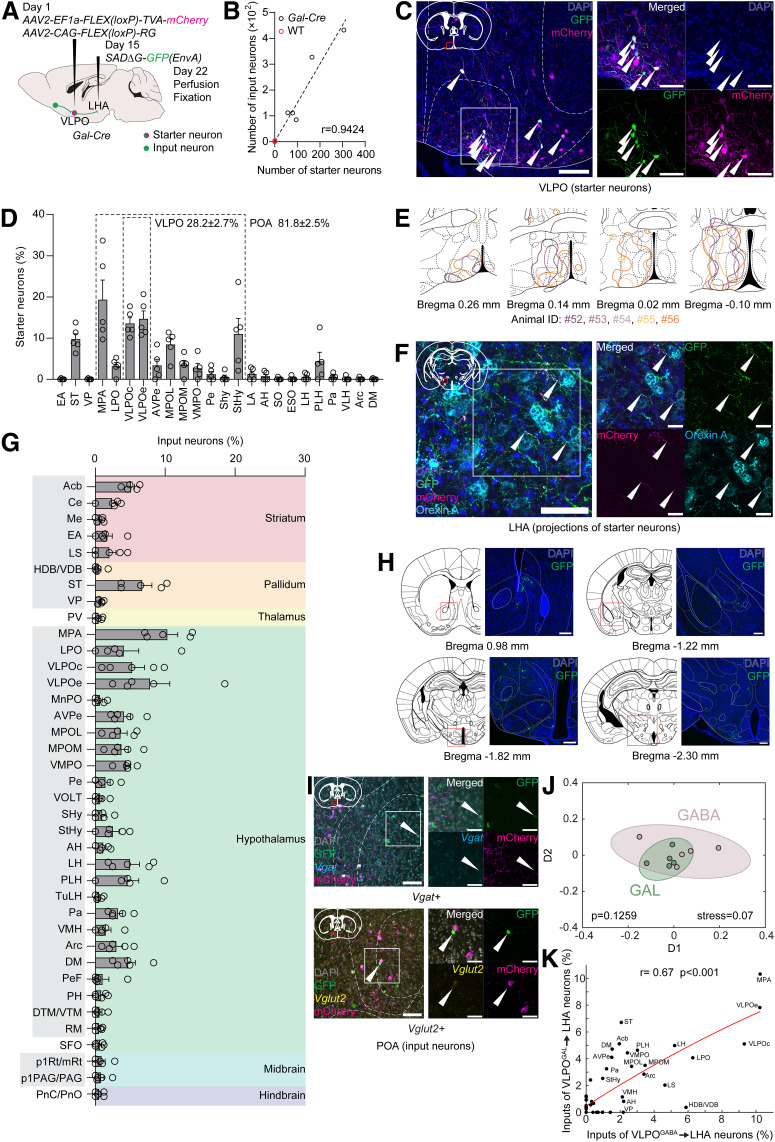
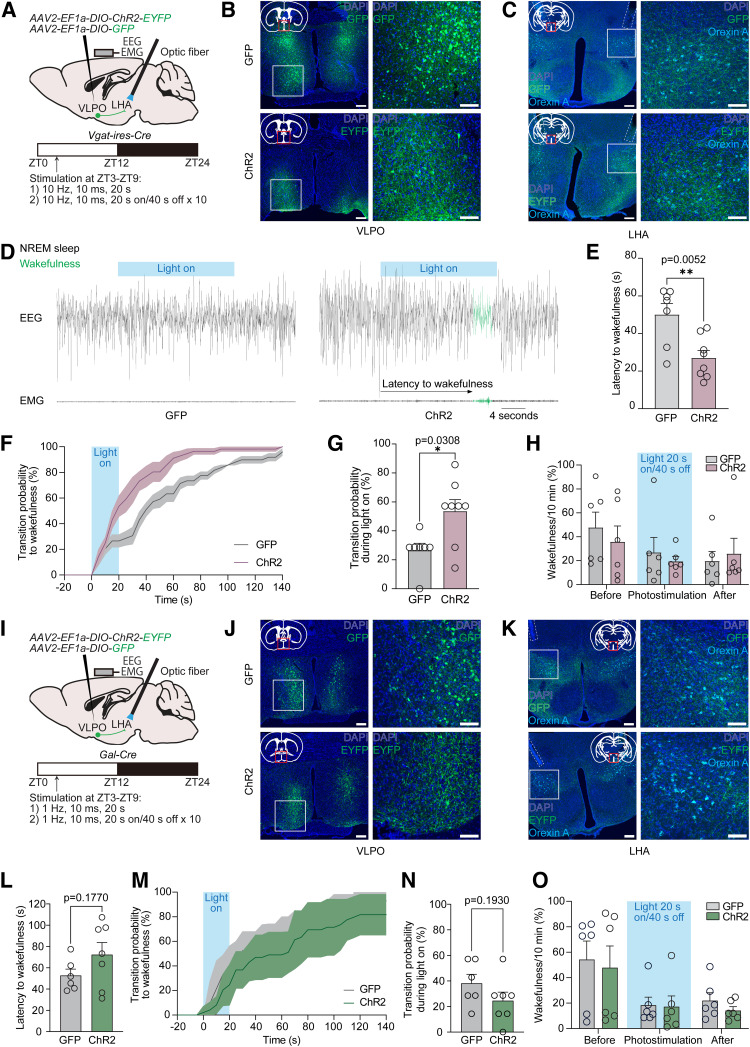
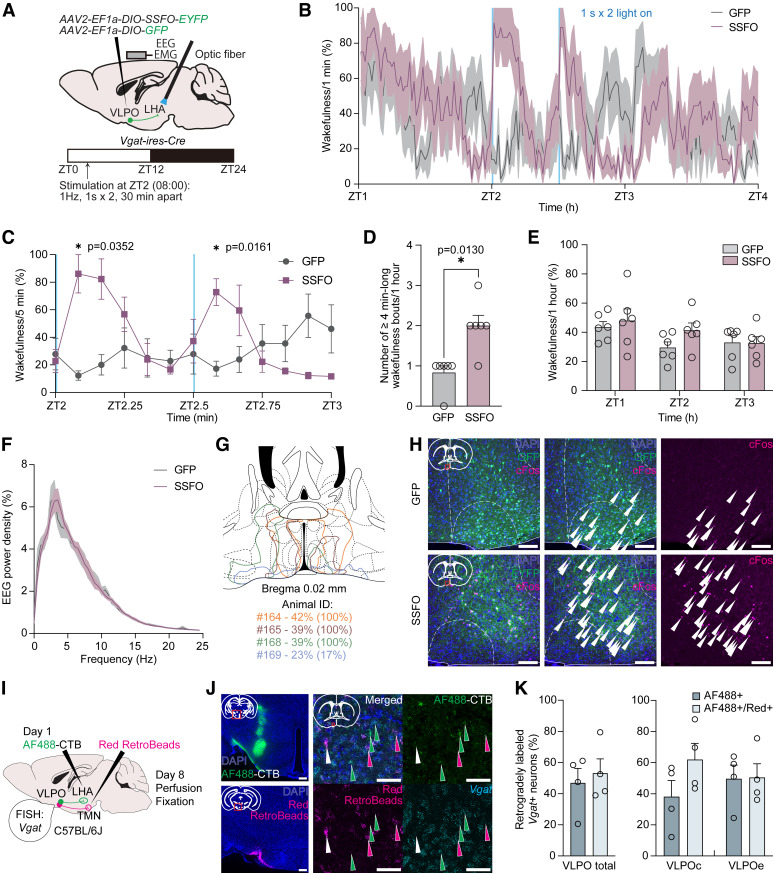
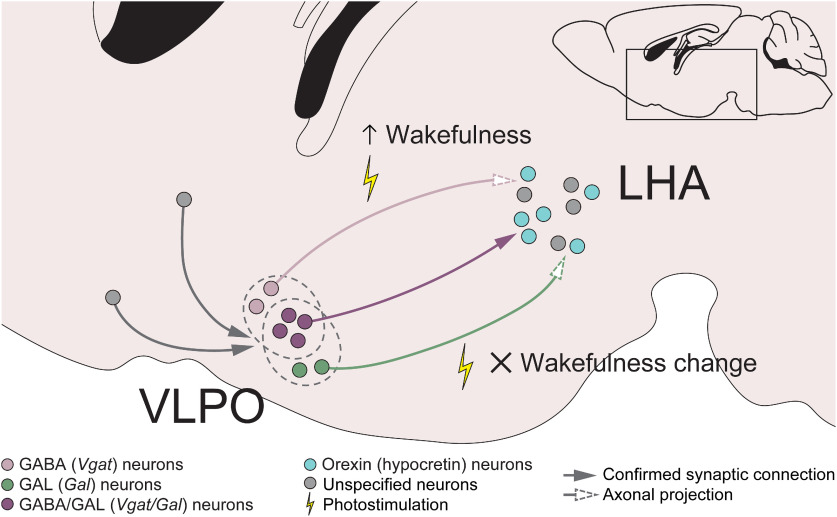
To understand how sleep-wakefulness cycles are regulated, it is essential to disentangle structural and functional relationships between the preoptic area (POA) and lateral hypothalamic area (LHA), since these regions play important yet opposing roles in the sleep-wakefulness regulation. GABA- and galanin (GAL)-producing neurons in the ventrolateral preoptic nucleus (VLPO) of the POA (VLPOGABA and VLPOGAL neurons) are responsible for the maintenance of sleep, while the LHA contains orexin-producing neurons (orexin neurons) that are crucial for maintenance of wakefulness. Through the use of rabies virus-mediated neural tracing combined with in situ hybridization (ISH) in male and female orexin-iCre mice, we revealed that the vesicular GABA transporter (Vgat, Slc32a1)- and galanin (Gal)-expressing neurons in the VLPO directly synapse with orexin neurons in the LHA. A majority (56.3 ± 8.1%) of all VLPO input neurons connecting to orexin neurons were double-positive for Vgat and Gal Using projection-specific rabies virus-mediated tracing in male and female Vgat-ires-Cre and Gal-Cre mice, we discovered that VLPOGABA and VLPOGAL neurons that send projections to the LHA received innervations from similarly distributed input neurons in many brain regions, with the POA and LHA being among the main upstream areas. Additionally, we found that acute optogenetic excitation of axons of VLPOGABA neurons, but not VLPOGAL neurons, in the LHA of male Vgat-ires-Cre mice induced wakefulness. This study deciphers the connectivity between the VLPO and LHA, provides a large-scale map of upstream neuronal populations of VLPO→LHA neurons, and reveals a previously uncovered function of the VLPOGABA→LHA pathway in the regulation of sleep and wakefulness.SIGNIFICANCE STATEMENT We identified neurons in the ventrolateral preoptic nucleus (VLPO) that are positive for vesicular GABA transporter (Vgat) and/or galanin (Gal) and serve as presynaptic partners of orexin-producing neurons in the lateral hypothalamic area (LHA). We depicted monosynaptic input neurons of GABA- and galanin-producing neurons in the VLPO that send projections to the LHA throughout the entire brain. Their input neurons largely overlap, suggesting that they comprise a common neuronal population. However, acute excitatory optogenetic manipulation of the VLPOGABA→LHA pathway, but not the VLPOGAL→LHA pathway, evoked wakefulness. This study shows the connectivity of major components of the sleep/wake circuitry in the hypothalamus and unveils a previously unrecognized function of the VLPOGABA→LHA pathway in sleep-wakefulness regulation. Furthermore, we suggest the existence of subpopulations of VLPOGABA neurons that innervate LHA.

Keywords: circuit; hypothalamus; preoptic area; sleep; wakefulness.


Figures

Figure 1.
Figure 1.
Generation of orexin-iCre knock-in mice. A, Structures of the targeting vector and targeting allele of orexin-iCre (orexiniCre/+) mice. B, Scheme of the validation experiment of orexin-iCre knock-in mice. AAV2-EF1a-DIO-GFP was injected bilaterally into the LHA. Two weeks later, mice were killed, and mouse brains were examined by immunohistochemical study. C, Representative images demonstrating colocalization of GFP and orexin A in the LHA that were immunostained with anti-GFP and anti-orexin A antibodies, respectively, in orexiniCre/+ mice. Right, Magnified image of the boxed area in the left image. Green and cyan arrowheads indicate GFP- and orexin A-single-positive neurons, respectively. Scale bars: left, 200 μm; right, 50 μm. D, Graph represents sensitivity and specificity of iCre activity in the craniocaudal axis in orexiniCre/+ mice. Orange rectangle represents an area with densely located orexin A-positive neurons in a mouse brain. Data are mean ± SEM; n = 3. E, F, Representative images demonstrating colocalization of hM4Di (dreaddm4)-mCherry and orexin A in LHA immunostained with anti-mCherry and anti-orexin A antibodies in orexiniCre/+;Rosa26dreaddm4/+ mice (E) and orexin-Cre;Rosa26dreaddm4/+ mice (F). Right images, Magnified images of the boxed areas in the left images. Green and magenta arrowheads indicate orexin A- and mCherry-single positive neurons, respectively. Scale bars: left images, 200 μm; right images, 50 μm.
Figure 2.
Figure 2.
Monosynaptic retrograde rabies virus-mediated tracing from orexin neurons. A, Scheme of trans-synaptic retrograde tracing experiment. Two weeks after injection of AAV10-EF1a-FLEX(loxP)-TVA-mCherry and AAV10-CAG-FLEX(loxP)-RG into LHA, SADΔG-GFP(EnvA) or SADΔG-GFP-ERT2CreERT2 were injected into the same sites in orexiniCre/+ mice. Mouse brains were examined by immunohistochemical study and FISH. Starter neurons were identified by expression of both mCherry and GFP, while input neurons expressed only GFP. B, Number of starter neurons positively correlates with number of produced input neurons in orexiniCre/+ mice (Pearson correlation, r = 0.9178, p = 0.0822; n = 4), while almost no cells were positive for mCherry and GFP in WT mice (n = 3). Linear regression: F(1,3) = 27.43, p = 0.0135, R2 = 0.8424. Several starter neurons were observed at the injection sites in WT mice despite extremely low number of input neurons. C, Representative images of starter neurons in LHA in orexiniCre/+ mice. Starter neurons were immunostained with anti-mCherry and anti-orexin A antibodies. Right, Magnified image of the boxed area in the left image. Arrowheads indicate starter neurons. Scale bars: left, 100 μm; right, 50 μm. D, Scheme depicting established borders of VLPO region. Brain outlines were taken from the Franklin and Paxinos (2007) mouse brain atlas. E, Representative images of Vgat- and Gal-double-positive input neurons in VLPO in orexiniCre/+ mice visualized by FISH. Right, Magnified image of the boxed area in the left image. Arrowheads indicate Vgat/Gal-double-positive input neurons. Scale bars: left, 100 μm; right, 50 μm. F, Percentages of input neurons in VLPO of orexin neurons categorized as Vgat+/Gal+, Vgat+, Gal+ or cells without expression of these markers (38±10 input neurons, n = 4). G, Representative images of input neurons in VLPO in orexiniCre/+ mice visualized by FISH using Gal and Vglut2 probes. Right, Magnified image of the boxed area in the left image. Magenta arrowhead indicates a Gal-positive, but Vglut2-negative, input neuron. Scale bars: left, 100 μm; right, 50 μm. H, Percentages of input neurons in VLPO of orexin neurons categorized as Gal+/Vglut2+, Gal+, Vglut2+ or cells without expression of these markers (17 ± 3 input neurons, n = 3). I, Representative images of input neurons in VLPO in orexiniCre/+ mice visualized by FISH using Vgat and Vglut2 probes. Right, Magnified image of the boxed area in the left image. Cyan arrowhead indicates a Vgat-positive, but Vglut2-negative, input neuron. Scale bars: left, 100 μm; right, 50 μm. J, Percentages of input neurons in VLPO of orexin neurons categorized as Vglut2+/Vgat+, Vglut2+, Vgat+ or cells without expression of these markers (12 ± 2 input neurons, n = 3). Circles represent data from individual animals. Data are mean ± SEM.
Figure 3.
Figure 3.
Monosynaptic retrograde projection-specific rabies virus-mediated tracing from VLPOGABA neurons sending projections to LHA. A, Scheme of projection-specific tracing experiment. Two weeks after injection of AAV2-EF1a-FLEX(loxP)-TVA-mCherry and AAV2-CAG-FLEX(loxP)-RG into VLPO of Vgat-ires-Cre mice, SADΔG-GFP(EnvA) was injected into LHA. Mouse brains were examined by immunohistochemical study. B, Number of starter neurons has positive correlation with number of input neurons in Vgat-ires-Cre mice (Pearson correlation, r = 0.3292, p = 0.5885; n = 5). Linear regression: F(1,4) = 9.413, p = 0.0374, R2 = 0.1084. In WT mice, several starter and input neurons were observed close to VLPO only in 1 animal (n = 3). C, Representative images of starter neurons in VLPO of Vgat-ires-Cre mice. Starter neurons were immunostained with anti-GFP and anti-mCherry antibodies. Right, Magnified image of the boxed area in the left image. Arrowheads indicate starter neurons. Scale bars: left, 100 μm; right, 50 μm. D, Distribution of starter VLPOGABA→LHA neurons in POA and adjacent regions. Highlighted areas are POA and VLPO. Areas with starter neurons in all examined animals without cut-off are shown. E, Scheme depicting outlines of distribution of starter neurons in cross-sections containing VLPO. Brain outlines were taken from the Franklin and Paxinos (2007) mouse brain atlas. Colors represent individual animals. If there were no matching brain sections to the presented schemes in some animals, outlines were not shown. F, Representative images of axonal terminals of VLPOGABA→LHA neurons making close appositions to bodies of orexin A-expressing neurons in LHA. Immunostaining with anti-GFP, anti-mCherry, and anti-orexin A antibodies. Right, Magnified image of the boxed area in the left image. Arrowheads indicate GFP- and mCherry-double-positive neural fibers. Scale bars: left, 50 μm; right, 20 μm. G, Whole-brain distribution of monosynaptic input neurons of VLPOGABA→LHA neurons in Vgat-ires-Cre mice. Only brain areas with input neurons detected in at least 3 of 5 animals are shown. Colored areas represent major brain divisions. Abbreviations of input brain areas that are shared with VLPOGAL→LHA neurons (Fig. 4G) are highlighted by gray background. Circles represent data from individual animals. Nomenclature of brain regions was taken from the Franklin and Paxinos (2007) mouse brain atlas. Data are mean ± SEM; n = 5. H, Representative images of input neurons of VLPOGABA→LHA neurons. Scale bars, 200 μm. I, Representative images of monosynaptic input neurons in POA of VLPOGABA→LHA neurons analyzed by FISH using Vgat, Vglut2, and Adcyap1 probes. For each molecular marker: right, magnified image of the boxed area in the left image. Arrowheads indicate GFP-positive neuronal bodies coexpressing examined molecular signatures. Scale bars: left, 100 μm; right, 50 μm.
Figure 4.
Figure 4.
Monosynaptic retrograde projection-specific rabies virus-mediated tracing from VLPOGAL→LHA neurons and examination of traced connections of two neuronal populations. A, Scheme of projection-specific tracing experiment. B, Number of starter neurons has strong positive correlation with number of input neurons in Gal-Cre mice (Pearson correlation, r = 0.9424, p = 0.0164; n = 5). Linear regression: F(1,4) = 114.0, p = 0.0004, R2 = 0.8882. In WT mice, several input neurons were observed only in 1 animal (n = 3). C, Representative images of VLPO starter neurons in Gal-Cre mice. Starter neurons were immunostained with anti-GFP and anti-mCherry antibodies. Right, Magnified image of the boxed area in the left image. Arrowheads indicate starter neurons. Scale bars: left, 100 μm; right, 50 μm. D, Distribution of starter VLPOGAL→LHA neurons in POA and neighboring regions. Highlighted areas represent POA and VLPO. Areas with starter neurons detected in all examined animals without cut-off are shown. E, Scheme depicting outlines of distribution of starter neurons in cross-sections containing VLPO. Colors represent individual animals. If there were no matching brain sections to the presented schemes in some animals, outlines were not shown. F, Representative images of axonal terminals of VLPOGAL→LHA neurons making close appositions to bodies of orexin A-expressing neurons in LHA. Immunostaining was performed using anti-GFP, anti-mCherry, and anti-orexin A antibodies. Right, Magnified image of the boxed area in the left image. Arrowhead indicates GFP- and mCherry-double positive neural fibers. Scale bars: left, 50 μm; right, 20 μm. G, Whole-brain distribution of monosynaptic inputs of VLPOGAL→LHA neurons in Gal-Cre mice. Only brain areas with input neurons in at least 3 of 5 animals are shown. Colored areas represent major brain divisions. Abbreviations of input brain areas that are shared with VLPOGABA→LHA neurons (Fig. 3G) are highlighted by gray background. Circles represent data from individual animals. Data are mean ± SEM (n = 5). H, Representative images of presynaptic partners of VLPOGAL→LHA neurons. Scale bars, 200 μm. I, Representative images of presynaptic partners of VLPOGAL→LHA neurons in POA. FISH with Vgat, Vglut2, and Adcyap1 probes. For each molecular marker: right, magnified image of the boxed area in the left image. Arrowheads indicate GFP-positive neuronal bodies expressing examined molecular signatures. Scale bars: left, 100 μm; right, 50 μm. J, Multidimensional scaling plot of monosynaptic input neurons of VLPOGABA→LHA (shown as GABA) and of VLPOGAL→LHA (shown as GAL) neurons (n = 5 for each group). Colored circles represent individual animals. Semitransparent circles represent closely located clusters formed of individual animals in each neuronal population, suggesting high similarity of presynaptic partners between them (F score = 1.5117, p = 0.1259, stress = 0.07). K, Spearman correlation plot comparing distribution of input neurons of VLPOGABA→LHA and VLPOGAL→LHA neurons. Distribution of presynaptic partners significantly correlates between neuronal groups (r = 0.67, p < 0.001).
Figure 5.
Figure 5.
Acute optogenetic stimulation of VLPOGABA→LHA and VLPOGAL→LHA pathways. A, Scheme of pathway-specific optogenetic experiment in Vgat-ires-Cre mice. AAV2-EF1a-DIO-ChR2-EYFP or AAV2-EF1a-DIO-GFP was injected bilaterally into VLPO, and optical fibers were implanted bilaterally into LHA of Vgat-ires-Cre mice for manipulation of axons of GABA-producing VLPO neurons. At the same time, an EEG- and EMG-recording electrode was secured onto the skull. Mice were maintained under a 12:12 h light/dark cycle (06:00 lights on, 18:00 lights off), and photoactivation was conducted for 2 d within the ZT3-ZT9 time frame with at least 40 min interstimulation periods. B, J, Representative images of VLPO neurons expressing GFP (top) or ChR2 (bottom), visualized by immunostaining with anti-GFP antibody, in Vgat-ires-Cre (B) and Gal-Cre (J) mice. Right images, Magnified images of the boxed areas in the left images. Scale bars: left images, 200 μm; right images, 100 μm. C, K, Representative images of GFP- (top) or ChR2-expressing (bottom) axons of VLPO neurons in LHA located close to orexin A-positive neurons in Vgat-ires-Cre (C) and Gal-Cre (K) mice. Immunostaining was performed using anti-GFP and anti-orexin A antibodies. Right images, Magnified images of the boxed areas in the left images. Scale bars: left images, 200 μm; right images, 100 μm. D, Representative EEG and EMG wave traces measuring 40 s (10 s before, 20 s during, and 10 s after optogenetic stimulation) from 2 animals injected with AAV2-EF1a-DIO-GFP (GFP, left) or AAV2-EF1a-DIO-ChR2-EYFP (ChR2, right). Blue line indicates laser stimulation (10 Hz, 10 ms, 20 s). Black represents NREM sleep. Green represents wakefulness. Latency to wakefulness was calculated as time in seconds from the start of each photostimulation to the onset of wakefulness. E, Latency to wakefulness after photostimulation. Significant difference was observed between GFP (n = 7) and ChR2 (n = 8) animals (first 7 stimulations per animal; p = 0.0052, unpaired two-tailed t test). F, Probability of transition to wakefulness in GFP and ChR2 mice within 140 s after start of photoactivation. Blue field represents optogenetic stimulation. G, Probability of transition to wakefulness during 20 s of photostimulation. Significant difference was observed between GFP and ChR2 animals (p = 0.0308, Mann–Whitney test). H, Amount of wakefulness in 10 min time bins in percentages before, during, and after 10 min optogenetic stimulation. No significant difference between GFP (n = 6) and ChR2 (n = 6) mice was observed (two-way repeated-measures ANOVA with Geisser–Greenhouse correction followed by Sidak multiple comparisons test). I, Scheme of pathway-specific optogenetic experiment in Gal-Cre mice. L, Latency to wakefulness after photostimulation. No significant difference was observed between GFP- (n = 6) and ChR2-expressing (n = 7) animals (first 7 stimulations per animal; p = 0.1770, unpaired two-tailed t test). M, Probability of transition to wakefulness in GFP and ChR2 mice within 140 s after start of photoactivation. Blue field represents optogenetic stimulation. N, Probability of transition to wakefulness during 20 s of photostimulation. No significant difference was observed between GFP and ChR2 animals (p = 0.1930, unpaired two-tailed t test). O, Amount of wakefulness in 10 min time bins in percentages before, during, and after 10 min optogenetic stimulation. No significant difference between GFP (n = 6) and ChR2 (n = 6) mice was observed (two-way repeated-measures ANOVA with Geisser–Greenhouse correction followed by Sidak multiple comparisons test). Circles represent data from individual animals. Data are mean ± SEM. *p < 0.05. **p < 0.01.
Figure 6.
Figure 6.
Long-term SSFO-mediated optogenetic stimulation of VLPOGABA→LHA pathway. A, Scheme of the pathway-specific optogenetic experiment. AAV2-DIO-SSFO-EYFP or AAV2-EF1a-DIO-GFP were injected bilaterally into VLPO, and optical fibers were implanted bilaterally into LHA of Vgat-ires-Cre mice. An EEG- and EMG-recording electrode was secured onto the skull. Mice were maintained under a 12:12 h light/dark cycle (06:00 lights on, 18:00 lights off), and photoactivation was applied 2 h after the onset of light phase (at ZT2 or 08:00; 1 s light pulse × 2, with 30 min interstimulation period). B, Time course of the amount of wakefulness during 1 h before the first 1 s light pulse (ZT1-ZT2; 07:00-08:00), 1 h after the first light pulse (ZT2-ZT3; 08:00-09:00), and 1 h following them (ZT3-ZT4; 09:00-10:00). Shown is the amount of wakefulness in 1 min time bins in percentages. Two blue lines indicate photostimulation. C, Time course of the amounts of wakefulness in 5 min bin during 1 h after the first light pulse. Significant differences were observed in the amount of wakefulness during the first 5 min after the light pulses between GFP- (n = 6) and SSFO-expressing (n = 6) mice (p = 0.0352 after the first light pulse and p = 0.0161 after the second light pulse, two-way repeated-measures ANOVA with Geisser–Greenhouse correction followed by Sidak multiple comparisons test). D, Number of ≥4-min-long (240 s-long) wakefulness bouts, observed during 1 h from the first light pulse. Significant difference was observed between GFP and SSFO mice (p = 0.0130, Mann–Whitney test). E, Total amount of wakefulness in percentages during 1 h before the first 1 s light pulse (ZT1; 07:00), 1 h after the first light pulse (ZT2; 08:00), and 1 h following them (ZT3; 09:00). No significant difference was observed (two-way repeated-measures ANOVA with Geisser–Greenhouse correction followed by Sidak multiple comparisons test). F, Relative amplitude of average EEG power density of NREM sleep during the last quarter (ZT2.75-ZT3; 08:45-09:00) of 1 h starting from the first light pulse (ZT2; 08:00). No significant difference was observed between GFP control and SSFO mice (ordinary two-way ANOVA followed by Sidak multiple comparisons test). G, Scheme depicting outlines of distribution of SSFO-expressing neurons in a cross-section containing VLPO. Brain outlines were taken from the Franklin and Paxinos (2007) mouse brain atlas. Colors represent individual animals. Four animals with the most distinct vector expression patterns are shown. Percentage following animal ID shows the amount of wakefulness during an hour since the first light pulse. Percentage in parentheses shows the amount of wakefulness during the first 5 min after the first light pulse. H, Representative images of cFos-positive VLPO neurons expressing GFP (top) or SSFO (bottom), visualized by immunostaining with anti-GFP and anti-cFos antibodies. Right images, Single-channel images showing cFos signal in cell nuclei. Scale bars, 100 μm. I, Scheme of dual-color retrograde tracing experiment. Recombinant cholera toxin subunit B conjugated with AlexaFluor-488 (AF488-CTB) was delivered into LHA, and Red RetroBeads was delivered into TMN of WT C57BL/6J mice. Retrogradely labeled neurons in VLPO were visualized for Vgat using FISH, and Vgat-expressing neurons solely labeled with AF488-CTB or colabeled with Red RetroBeads were counted. J, Representative images of injection sites of retrograde traces (left images) and neurons in VLPO containing the tracers (right). Green arrowheads indicate AF488-CTB single-positive neurons in the VLPO. Magenta arrowheads indicate Red RetroBeads single-positive neurons. White arrowhead indicates an AF488-CTB and Red RetroBeads double-positive neuron. Scale bars: left images, 200 μm; right, 50 μm. K, Percentages of Vgat-expressing VLPO neurons categorized as AF488-CTB+ (AF488+) and AF488-CTB/Red RetroBeads-double positive (AF488+/Red+) (n = 4). Circles represent data from individual animals. Data are mean ± SEM. *p < 0.05.
Figure 7.
Figure 7.
Regulation of wakefulness by VLPOGABA→LHA and VLPOGAL→LHA pathways. GABA (Vgat)- and GAL (Gal)-expressing neurons in the VLPO make monosynaptic inputs to orexin neurons in the LHA, with approximately half of the VLPO inputs being double positive for these markers. VLPOGABA→LHA and VLPOGAL→LHA neurons receive innervations from similarly distributed input neurons in many brain regions, suggesting that at least some of the GABA- and GAL-producing VLPO neurons projecting to the LHA compose a common neuronal population. Optogenetic excitation of the VLPOGABA→LHA pathway results in induction of short-lasting wakefulness episodes and in increase in wakefulness, while photostimulation of the VLPOGAL→LHA pathway does not significantly affect wakefulness, suggesting distinct physiological roles of the VLPOGABA→LHA and VLPOGAL→LHA pathways.

Similar articles

Cited by

References

    1. Alam MA, Kumar S, McGinty D, Alam MN, Szymusiak R (2014) Neuronal activity in the preoptic hypothalamus during sleep deprivation and recovery sleep. J Neurophysiol 111:287–299. 10.1152/jn.00504.2013 - DOI - PMC - PubMed
    1. Arrigoni E, Fuller PM (2022) The sleep-promoting ventrolateral preoptic nucleus: what have we learned over the past 25 years? Int J Mol Sci 23:2905. 10.3390/ijms23062905 - DOI - PMC - PubMed
    1. Branch AF, Navidi W, Tabuchi S, Terao A, Yamanaka A, Scammell TE, Behn CD (2016) Progressive loss of the orexin neurons reveals dual effects on wakefulness. Sleep 39:369–377. 10.5665/sleep.5446 - DOI - PMC - PubMed
    1. Carter ME, Adamantidis A, Ohtsu H, Deisseroth K, de Lecea L (2009) Sleep homeostasis modulates hypocretin-mediated sleep-to-wake transitions. J Neurosci 29:10939–10949. 10.1523/JNEUROSCI.1205-09.2009 - DOI - PMC - PubMed
    1. Chen KS, Xu M, Zhang Z, Chang WC, Gaj T, Schaffer DV, Dan Y (2018) A hypothalamic switch for REM and non-REM sleep. Neuron 97:1168–1176.e4. 10.1016/j.neuron.2018.02.005 - DOI - PubMed

Publication types

LinkOut - more resources