. 2023 Apr 28;14(1):2445.
doi: 10.1038/s41467-023-38134-z.

An interactive murine single-cell atlas of the lung responses to radiation injury

Affiliations

An interactive murine single-cell atlas of the lung responses to radiation injury

Sandra Curras-Alonso et al. Nat Commun. .

Abstract

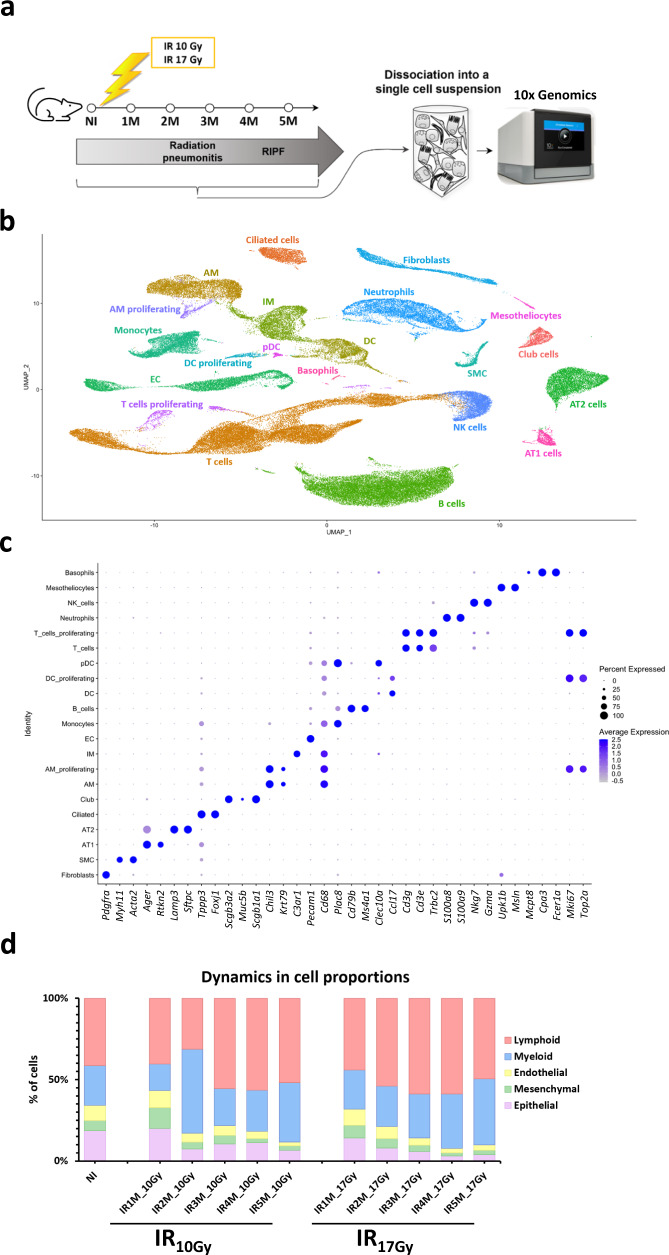
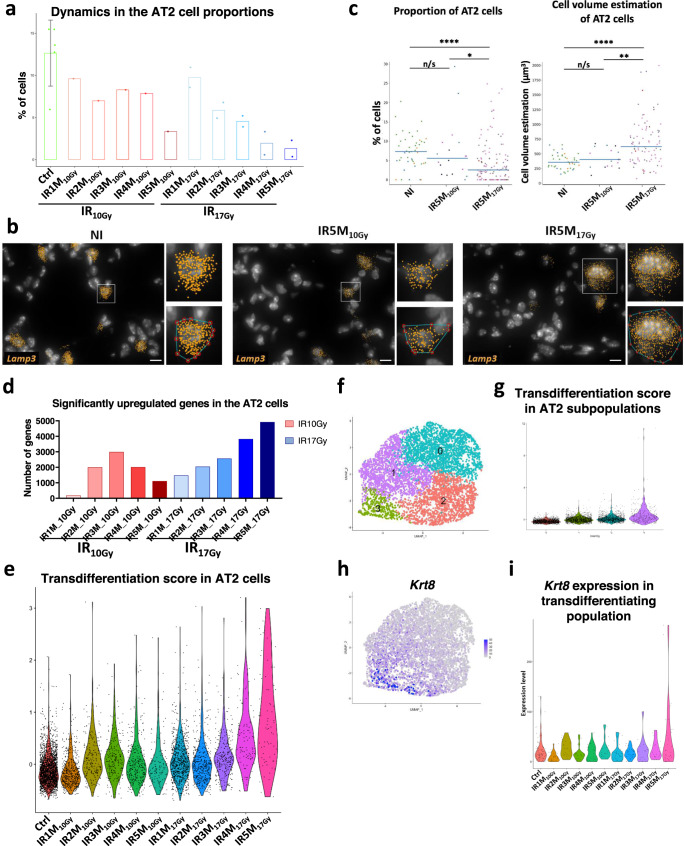
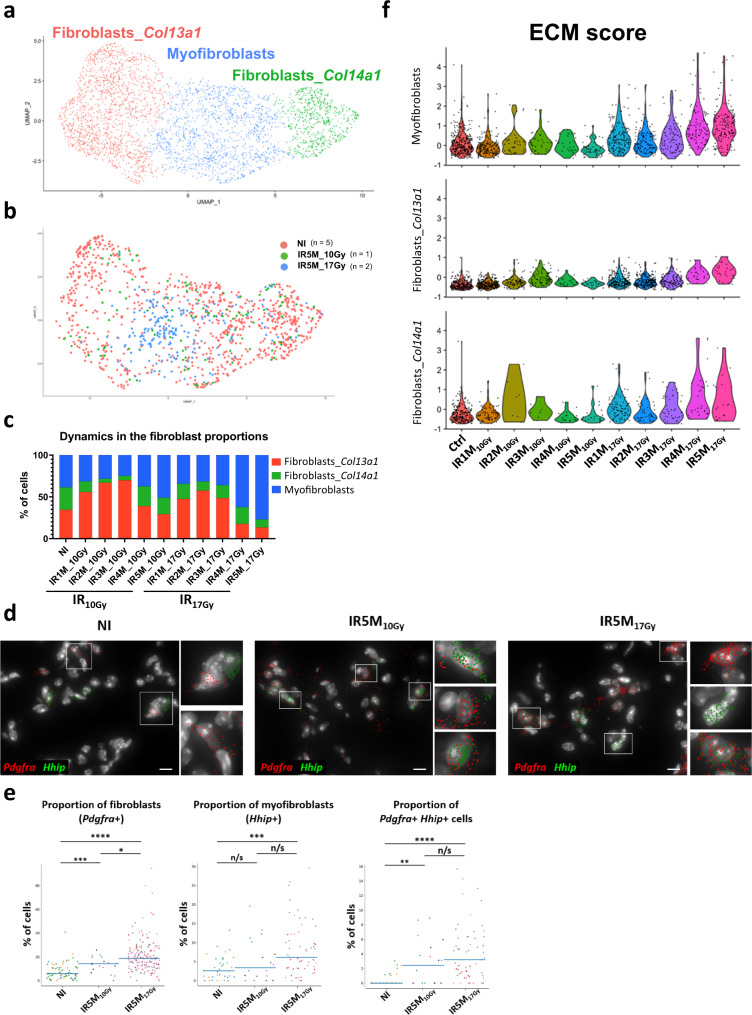
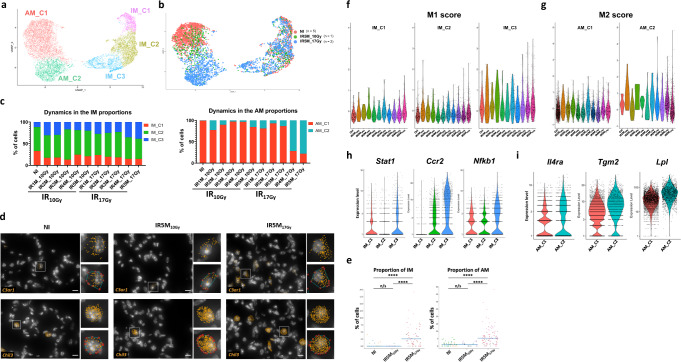
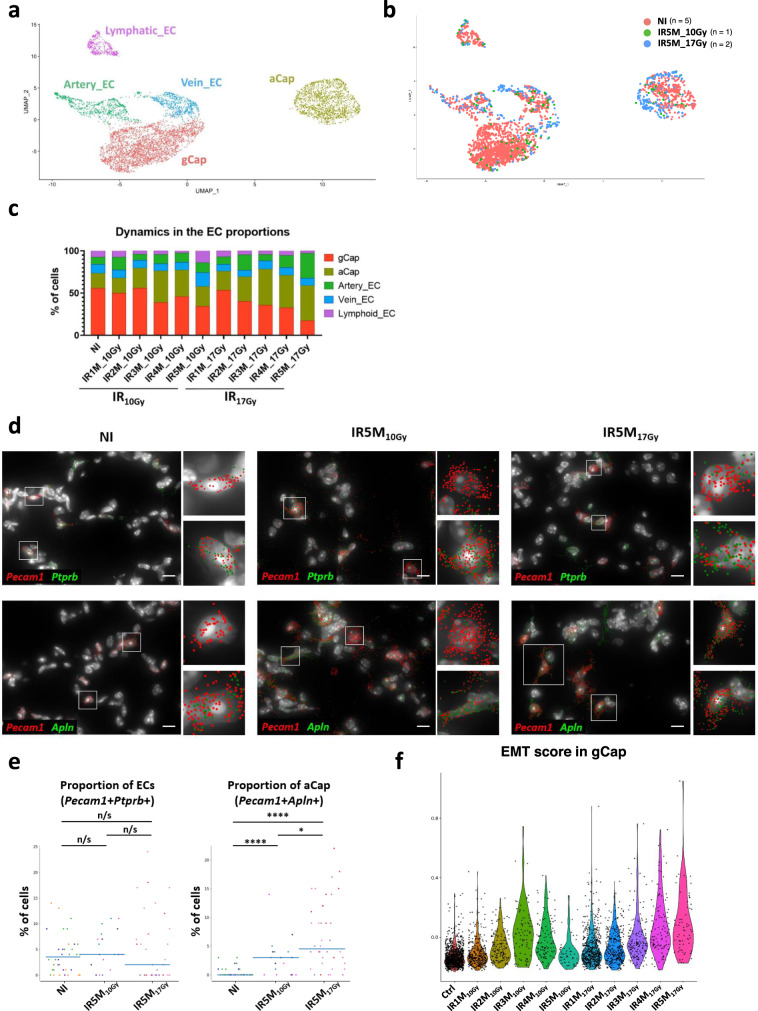
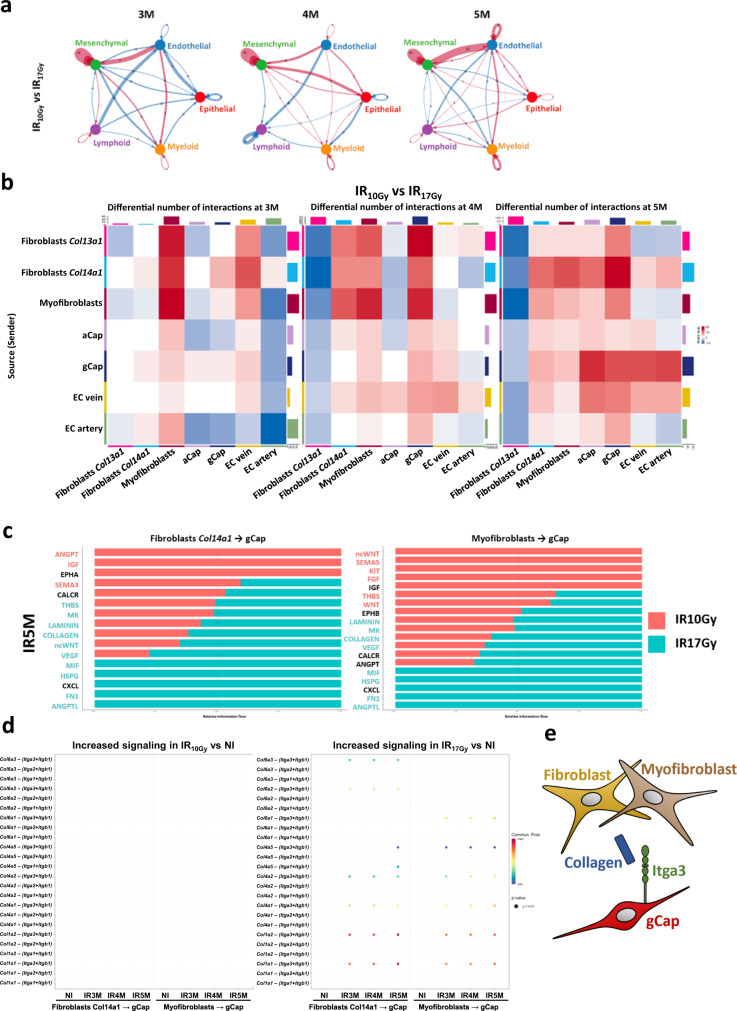
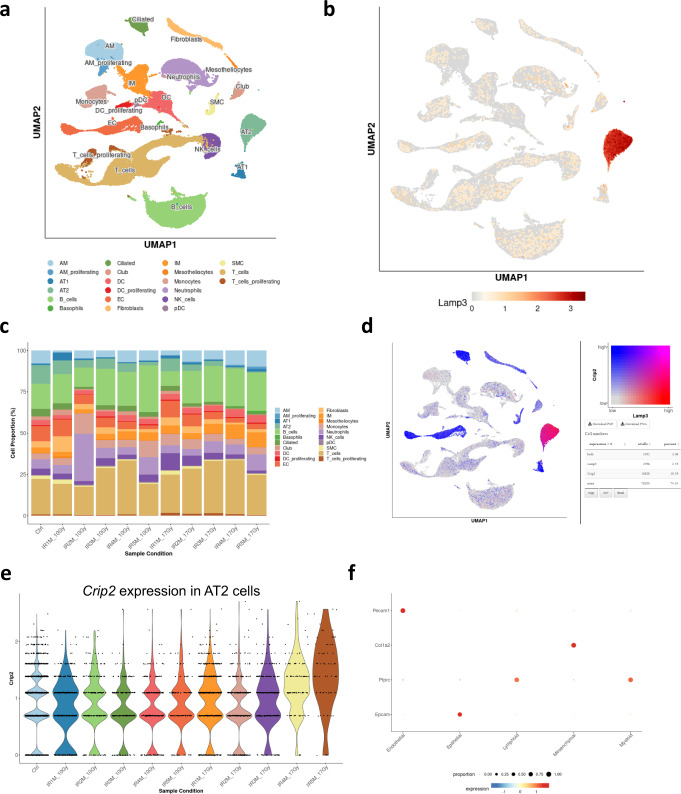
Radiation Induced Lung Injury (RILI) is one of the main limiting factors of thorax irradiation, which can induce acute pneumonitis as well as pulmonary fibrosis, the latter being a life-threatening condition. The order of cellular and molecular events in the progression towards fibrosis is key to the physiopathogenesis of the disease, yet their coordination in space and time remains largely unexplored. Here, we present an interactive murine single cell atlas of the lung response to irradiation, generated from C57BL6/J female mice. This tool opens the door for exploration of the spatio-temporal dynamics of the mechanisms that lead to radiation-induced pulmonary fibrosis. It depicts with unprecedented detail cell type-specific radiation-induced responses associated with either lung regeneration or the failure thereof. A better understanding of the mechanisms leading to lung fibrosis will help finding new therapeutic options that could improve patients' quality of life.


Conflict of interest statement

The authors declare no competing interests.

Figures

Fig. 1
Fig. 1. Radiation-induced lung injury cell atlas.
a Scheme of the experimental set up. Mice are irradiated with a dose of 10 Gy or 17 Gy and monitored by CT-scan to follow the development of pulmonary fibrosis. Mice are sacrificed at 1, 2, 3, 4, and 5 months after IR, and lungs are enzymatically and mechanically dissociated into a single cell suspension before being loaded in the 10x Chromium Controller System (image provided by 10x Genomics). b UMAP visualization of 102,869 cells from 20 different samples (5 NI; 5 IR10Gy, one per time point; 10 IR17Gy, two per time point) annotated by cell type. c Dot plot of the expression of the markers used for cell type identification. d Dynamics in cell proportions of the endothelial, mesenchymal, epithelial, lymphoid, and myeloid cells across the NI and IR conditions at the different time points and doses.
Fig. 2
Fig. 2. Cellular and molecular changes in the AT2 cells during RILI reveal a transdifferentiation profile after fibrogenic doses of IR.
a Dynamics in the proportion of the AT2 cells in the NI (n = 5) and at the different time points after IR10Gy (n = 1) and IR17Gy (n = 2). Error bar refers to the standard deviation of the data. b Automatic Lamp3 mRNA (orange) detection with Big-FISH in NI, IR5M10Gy, and IR5M17Gy lung tissue sections. Inset top panel shows an AT2 cell; inset bottom panel shows the convex hull of a cluster of mRNA spots. Scale bars, 10 µm. c Quantification and cell volume estimation of the Lamp3+ cells in NI, IR5M10Gy, and IR5M17Gy lung tissue sections. To compare two groups, the P value was computed with the Mann–Whitney–Wilcoxon test (two-sided test) from scipy (n/s, adjusted p value >0.05; *, adjusted p value <0.05; **, adjusted p value <0.01; ***, adjusted p value <0.001; ****, adjusted p value <0.0001). Each dot represents one analyzed image. Each color per time point represents a different biological replicate (NI n = 3; IR5M10Gy n = 3; IR5M17Gy n = 5). d Dynamics in the significantly upregulated genes in the AT2 cells compared to the NI samples at the different time points after IR10Gy and IR17Gy. e Violin plot showing the single cell score calculated based on the transdifferentiation expressed genes in the AT2 cells. f UMAP visualization of the different AT2 cell subpopulations. g Violin plot showing the single cell score calculated based on the transdifferentiation expressed genes in the different AT2 cell subpopulations. h UMAP visualization of the expression of Krt8. i Violin plot of Krt8 expression in the AT2 cells cluster three in the NI samples and at the different time points after IR10Gy and IR17Gy.
Fig. 3
Fig. 3. Myofibroblasts contribute to the ECM deposition after IR17Gy.
a UMAP visualization of 3488 cells from the different fibroblast subpopulations annotated by cell type. b UMAP visualization of NI (n = 5), IR5M10Gy (n = 1) and IR5M17Gy (n = 2) fibroblasts annotated by time point. c Dynamics in the proportion of the fibroblast subpopulations at the different time points after IR10Gy and IR17Gy. d Automatic Pdgfra (red) and Hhip (green) mRNA detection with Big-FISH in NI, IR5M10Gy, and IR5M17Gy lung tissue sections. Scale bars, 10 µm. e Quantification of the Pdgfra+, Hhip+ and Pdgfra+ Hhip+ cells in the NI, IR5M10Gy and IR5M17Gy lung tissue sections. To compare two groups, the P value was computed with the Mann–Whitney–Wilcoxon test (two-sided test) from scipy (n/s, adjusted p value >0.05; *, adjusted p value <0.05; **, adjusted p value <0.01; ***, adjusted p value <0.001; ****, adjusted p value <0.0001). Each dot represents one analyzed image. Each color per time point represents a different biological replicate (NI n = 3; IR5M10Gy n = 3; IR5M17Gy n = 5). f Violin plot showing the single cell score calculated based on the ECM expressed genes in the myofibroblasts, fibroblasts Col13a1, and fibroblasts Col14a1.
Fig. 4
Fig. 4. Proinflammatory and profibrotic profile of alveolar and interstitial macrophages after fibrogenic doses of IR.
a UMAP visualization of 11,678 cells from the different IM and AM subpopulations annotated by cell type. b UMAP visualization of NI (n = 5), IR5M10Gy (n = 1) and IR5M17Gy (n = 2) IM and AM annotated by time point. c Dynamics in the proportion of the IM and AM subpopulations at the different time points after IR10Gy and IR17Gy. d Automatic C3ar1 (orange) and Chil3 (orange) mRNA detection with Big-FISH in NI, IR5M10Gy and IR5M17Gy lung tissue sections. Scale bars, 10 µm. e Quantification of the C3ar1+ and Chil3+ cells in the NI, IR5M10Gy, and IR5M17Gy lung tissue sections. To compare two groups, the P value was computed with the Mann–Whitney–Wilcoxon test (two-sided test) from scipy (n/s, adjusted p value >0.05; *, adjusted p value <0.05; **, adjusted p value <0.01; ***, adjusted p value <0.001; ****, adjusted p value <0.0001). Each dot represents one analyzed image. Each color per time point represents a different biological replicate (NI n = 3; IR5M10Gy n = 3; IR5M17Gy n = 5). f Violin plot showing the single cell score calculated based on the M1 signature in the different IM subpopulations. g Violin plot showing the single cell score calculated based on the M2 signature in the different AM subpopulations. h Violin plots of M1 genes expression in the different IM subpopulations. i Violin plots of M2 genes expression in the different AM subpopulations.
Fig. 5
Fig. 5. Characterization of the ECs after radiation injury.
a UMAP visualization of 6482 cells from the different EC subpopulations annotated by cell type. b UMAP visualization of NI (n = 5), IR5M10Gy (n = 1) and IR5M17Gy (n = 2) ECs annotated by time point. c Dynamics in the proportion of the EC subpopulations at the different time points after IR10Gy and IR17Gy. d Automatic Pecam1 (red), Ptprb (green), and Apln (green) mRNA detection with Big-FISH in NI, IR5M10Gy, and IR5M17Gy lung tissue sections. Scale bars, 10 µm. e Quantification of the Pecam1 + Ptprb + and Pecam1 + Apln + cells in the NI, IR5M10Gy and IR5M17Gy lung tissue sections. To compare two groups, the P value was computed with the Mann–Whitney–Wilcoxon test (two-sided test) from scipy (n/s, adjusted p value >0.05; *, adjusted p value <0.05; **, adjusted p value <0.01; ***, adjusted p value <0.001; ****, adjusted p value <0.0001). Each dot represents one analyzed image. Each color per time point represents a different biological replicate (NI n = 3; IR5M10Gy n = 3; IR5M17Gy n = 3). f Violin plot showing the single cell score calculated based on the EMT signature from the GSEA in the gCap at the different time points after IR10Gy and IR17Gy.
Fig. 6
Fig. 6. Cell-cell interaction analysis between the different lung cell populations after different time points and doses of IR.
a Circle plot showing the differential number of interactions between IR10Gy and IR17Gy in the main cellular compartments at 3 M, 4 M, and 5 M post-IR: mesenchymal, endothelial, epithelia, myeloid and lymphoid. Red (or blue) colored edges represent increased (or decreased) signaling in the IR17Gy compared to the IR10Gy. b Heatmap showing the differential number of interactions between IR10Gy and IR17Gy in the endothelial and mesenchymal subpopulations at 3 M, 4 M, and 5 M post-IR. Red (or blue) represents increased (or decreased) signaling in the IR17Gy compared to the IR10Gy. The top-colored bar plot represents the sum of column of values displayed in the heatmap (incoming signaling). The right-colored bar plot represents the sum of row of values (outgoing signaling). c Bar graph showing significant signaling pathways ranked based on differences in the overall information flow within the inferred networks between IR5M10Gy and IR5M17Gy from the Fibroblasts Col14a1 and Myofibroblasts (sources) to the gCap (targets). The top signaling pathways colored red are enriched after IR5M10Gy, and the ones colored green were enriched after IR5M17Gy. d Increased signaling ligand-receptor pairs of the Collagen pathway in IR10Gy and IR17Gy compared to NI at 3 M, 4 M, and 5 M after IR. e Schematic drawing of the intercellular communication between fibroblasts and myofibroblasts with the gCap through the collagen pathway.
Fig. 7
Fig. 7. Web-based interface for the murine single-cell atlas of the lung response to radiation injury.
a UMAP visualization of 102,869 cells from 20 different samples (5 NI; 5 IR10Gy, one per time point; 10 IR17Gy, two per time point) annotated by cell type. b UMAP visualization of the expression of Lamp3. c Dynamics in cell proportions of the main cell types across the NI and IR conditions at the different time points and doses. d UMAP visualization of the expression of Lamp3 (red), Crip2 (blue), and the co-expression of both (pink). e Violin plot of Crip2 expression in the AT2 cells in the NI samples and at the different time points after IR10Gy and IR17Gy. f DotPlot of the expression of the marker genes used to identify the main 5 cell compartments.

References

    1. Coggle JE, Lambert BE, Moores SR. Radiation effects in the lung. Environ. Health Perspect. 1986;70:261–291. doi: 10.1289/ehp.8670261. - DOI - PMC - PubMed
    1. Morgan GW, Pharm B, Breit SN. Radiation and the lung: a reevaluation of the mechanisms mediating pulmonary injury. Int. J. Radiat. Oncol. Biol. Phys. 1995;31:361–369. doi: 10.1016/0360-3016(94)00477-3. - DOI - PubMed
    1. Wynn TA. Integrating mechanisms of pulmonary fibrosis. J. Exp. Med. 2011;208:1339–1350. doi: 10.1084/jem.20110551. - DOI - PMC - PubMed
    1. Chen Z, Wu Z, Ning W. Advances in molecular mechanisms and treatment of radiation-induced pulmonary fibrosis. Transl. Oncol. 2018;12:162–169. doi: 10.1016/j.tranon.2018.09.009. - DOI - PMC - PubMed
    1. Krzyzanowski, M. C., Levy, J., Page, G. P., Gaddis, N. C. & Clark, R. F. Using semantic web technologies to power LungMAP, a molecular data repository. In: Proceedings of The International Workshop on Semantic Big Data 1–6 (ACM). 10.1145/3066911.3066916 (2017).

Publication types