. 2023 Apr 28;14(1):2439.
doi: 10.1038/s41467-023-38132-1.

Dependency of NELF-E-SLUG-KAT2B epigenetic axis in breast cancer carcinogenesis

Affiliations

Dependency of NELF-E-SLUG-KAT2B epigenetic axis in breast cancer carcinogenesis

Jieqiong Zhang et al. Nat Commun. .

Abstract

Cancer cells undergo transcriptional reprogramming to drive tumor progression and metastasis. Using cancer cell lines and patient-derived tumor organoids, we demonstrate that loss of the negative elongation factor (NELF) complex inhibits breast cancer development through downregulating epithelial-mesenchymal transition (EMT) and stemness-associated genes. Quantitative multiplexed Rapid Immunoprecipitation Mass spectrometry of Endogenous proteins (qPLEX-RIME) further reveals a significant rewiring of NELF-E-associated chromatin partners as a function of EMT and a co-option of NELF-E with the key EMT transcription factor SLUG. Accordingly, loss of NELF-E leads to impaired SLUG binding on chromatin. Through integrative transcriptomic and genomic analyses, we identify the histone acetyltransferase, KAT2B, as a key functional target of NELF-E-SLUG. Genetic and pharmacological inactivation of KAT2B ameliorate the expression of EMT markers, phenocopying NELF ablation. Elevated expression of NELF-E and KAT2B is associated with poorer prognosis in breast cancer patients, highlighting the clinical relevance of our findings. Taken together, we uncover a crucial role of the NELF-E-SLUG-KAT2B epigenetic axis in breast cancer carcinogenesis.


Conflict of interest statement

The authors declare no competing interests.

Figures
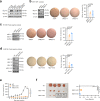
Fig. 1
Fig. 1. Abolishment of the NELF complex impairs tumorigenic properties.
a Western blot analysis of NELF-A and NELF-E in non-tumorigenic breast epithelial cell line MCF10A, as well as in different breast cancer cell lines T-47D (ER+, PR+), SK-BR-3 (HER2+), MCF7 (ER+), BT-474 (HER2+), BT-549 (triple-negative), MDA-MB-231 (triple-negative), and SUM159 (triple-negative). β-actin was used as the loading control. b, c Left: MCF7 cells (n = 3) and BT-549 cells (n = 4) were transfected with non-targeting siRNA (‘scrambled, siSCR’) and siRNAs targeting NELF-A and NELF-E, respectively, followed by western blot analysis. GAPDH was used as the loading control. Right: Representative images and quantification of soft agar assays. d Left: Western blot analysis of NELF-A, NELF-E, NELF-B, and NELF-C/D in WT and NELF-A/NELF-E KO SUM159 cells. β-actin was used as the loading control. Right: Representative images and quantification of soft agar assays (n = 4). e 5 × 106 WT, NELF-A KO, and NELF-E KO SUM159 cells were injected into the mammary fat pads of NOD/SCID mice, respectively. Tumor volume was measured every 3 days after the tumor was palpable; mean ± SEM, n = 4/group. f Left: Tumors harvested from WT, NELF-A KO, and NELF-E KO groups; Right: Quantification of tumor weights; mean ± SEM, n = 4/group. Blots and images are representative of at least three independent experiments. Data in (bd) are presented as mean ± SD. p-values are determined by a two-tailed Student’s t-test. Source data are provided as a Source Data file.
Fig. 2
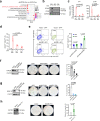
Fig. 2. NELF depletion leads to reduced stemness-like traits and downregulated EMT pathway.
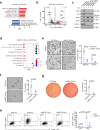
a MA plot showing gene expression changes between NELF-E KO and WT SUM159 cells. Red and blue points indicate significantly upregulated (n = 388) and downregulated (n = 540) genes, respectively. b GSEA enrichment plot for stemness and epithelial-mesenchymal transition pathways in NELF-E KO SUM159 cells. c Western blot analysis of NELF-E and NELF-A in WT, NELF-E KO, and NELF-E rescue SUM159 cells. β-actin was used as the loading control. d Quantification of wound healing assay in WT, NELF-E KO, and NELF-E rescue SUM159 cells. Scale bar = 100 μm. e Quantification of mammosphere formation assay in WT, NELF-E KO, and NELF-E rescue SUM159 cells (n = 4). Scale bar = 100 μm. f Quantification of invasion assay in WT, NELF-E KO, and NELF-E rescue SUM159 cells (n = 3). Scale bar = 100 μm. g Body weight (mean ± SEM) of mice injected with 1.25 × 106 WT and NELF-E KO SUM159 cells, respectively (n = 8, each group). h Lungs inflated and fixed with 10% neutral buffer formalin from mice in WT (n = 8) and NELF-E KO group (n = 8). i Representative images of H&E staining in lung tissues at three magnifications (mf: metastatic foci). From top to bottom, Bar = 2 mm, 500 μm, and 100 μm, respectively. j Quantitative analysis of lung metastasis presented as % of occupation by metastasis and the number of metastatic sites per lung (n = 8/group). k Graph showing quantification of mammospheres in WT, NELF-E KO, and NELF-E rescue MCF7 cells at primary (n = 3), secondary (n = 4), and tertiary passages (n = 4). l MCF7 cells from tertiary spheroids were seeded at a density of 1000 cells per well and incubated for 2 weeks. The colonies were then fixed and stained with crystal violet. m Flow cytometry analysis and quantification of the CD24low/CD44high population in MCF7 tertiary mammospheres (n = 3). Blots and images are representative of at least three independent experiments. Data in (d, e, f, j, k, m) are presented as mean ± SD. p-values are determined by a two-tailed Student’s t-test. Source data are provided as a Source Data file.
Fig. 3
Fig. 3. Loss of NELF-E suppresses EMT in a SOX9-SLUG overexpression MCF7 cell line model.
a Barplot showing the top perturbed pathways from Molecular Signatures Database (MSigDB) in Doxycycline (Dox)-treated MCF7ras+SS cells compared to the vehicle control. b Volcano plot depicting the significantly upregulated genes (n = 1750) and downregulated genes (n = 2223). Select mesenchymal/stemness-related genes are labeled in red, while epithelial genes are labeled in blue. adj. p-value ≤ 0.05; |fold change| ≥ 1.5. p-value was calculated using DESeq2 package (see details in “Methods”) c Western blot analysis for different markers in Dox-induced MCF7ras+SS cells transduced with scrambled or two independent shRNAs targeting NELF-E. GAPDH was used as the loading control. d GSEA plot of shNELF-E+Dox vs SCR+Dox cells. p-value was calculated from gene set enrichment analysis. (see detail in “Methods”). e Representative images and quantification of the migration and invasion assays. MCF7ras+SS cells were transduced with scrambled or NELF-E shRNA and treated with Dox to induce SOX9 and SLUG expression for 72 h prior to the assays (n = 3). Scale Bar = 100 μm. f Representative images and quantification of the sphere-formation assay. MCF7ras+SS cells were transduced with scrambled or NELF-E shRNA, followed by 72-h Dox treatment. Cells were seeded at a density of 10K per well, and the number of spheres was counted 5–7 days later (n = 4). Scale Bar = 100 μm. g Representative images and quantification of the soft agar assays for SCR+Dox and shNELF-E+Dox cells (n = 3). h Flow cytometry analysis and quantification of the CD24low/CD44high population in NELF-E KD+Dox cells compared to SCR+Dox cells (n = 3). Blots and images are representative of at least three independent experiments. p-values in (eh) are determined by a two-tailed Student’s t-test. Mean ± SD is represented by bar graphs. Source data are provided as a Source Data file.
Fig. 4
Fig. 4. Loss of NELF-E attenuates gene activation and RNAPII binding.
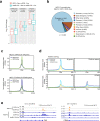
a Log2 fold change of UP-genes (n = 1750), DOWN-genes (n = 2223), and unchanged genes (n = 1581) in the two different conditions. Gene categorization was based on the condition of SCR+Dox vs SCR-Con with the cutoffs of adj. p-value ≤ 0.05 and |fold change| ≥ 1.5. Center lines show median values, box limits represent the upper and lower quartiles, and whiskers show 1.5× the interquartile range. Two-tailed Student’s t-tests were used for all comparisons. p-values were not adjusted for multiple tests, and t-statistics are provided in source data. b Genomic distribution of NELF-E binding sites in Dox-treated MCF7ras+SS cells. c Metagene plots of NELF-E ChIP-seq signals in SCR-Con and SCR+Dox cells for UP-genes (top panel) and DOWN-genes (bottom panel). d Metagene plots of RNAPII ChIP-seq signals in SCR-Con, SCR+Dox, and shNELF-E+Dox cells for UP-genes and DOWN-genes. e Genome browser tracks showing NELF-E and RNAPII occupancies at the promoters of mesenchymal gene FN1 (left) and stemness-related gene CD44 (right). Source data are provided as a Source Data file.
Fig. 5
Fig. 5. NELF-E interacts with and alters the genomic occupancy of SLUG.
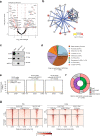
a Volcano plot of NELF-E qPLEX-RIME analysis of WT+Dox vs WT-Con. Proteins that satisfy the significance threshold of |log2(fold change)| ≥0.5 and adj. p-value <0.05 are labeled with their gene names and colored red. The p-value was adjusted by Benjamini–Hochberg multiple hypothesis correction. b Interaction network plot of proteins enriched in Dox induction by qPLEX-RIME, superimposed on the STRING interaction network. Interactions detected by qPLEX-RIME are colored in blue, while interactions from the STRING database are colored in gray. Proteins/nodes are colored based on log2(fold change) value. c Western blot analysis of SOX9, SLUG, and NELF-E following NELF-E immunoprecipitation (IP), performed on nuclear extracts from Dox-treated MCF7ras+SS cells. Blots are representative of three independent experiments. d Genomic distribution of SLUG binding sites in MCF7ras+SS cells transduced with scrambled shRNA and treated with Dox (SCR+Dox). e Metaplots of SLUG binding across the three different categories in SCR+Dox and shNELF-E+Dox MCF7ras+SS cells. f, g Pie chart and heatmap depiction of SLUG and NELF-E co-bound peaks at TSS and distal regions. Source data are provided as a Source Data file.
Fig. 6
Fig. 6. KAT2B is a key target of NELF-E and SLUG in response to EMT.
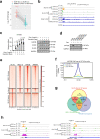
a Dot plot showing KAT2B as one of the top genes (n = 41) whose SLUG-mediated activation was most significantly attenuated by NELF-E KD. Expressions of corresponding genes in the two comparisons are connected by gray lines. b Genome browser tracks showing the occupancies of NELF-E, SLUG, and RNAPII on the KAT2B locus. c RT-qPCR analysis (left) and western blot analysis (right) of KAT2B in MCF7ras+SS cells treated with Dox for different time points (n = 3). d Western blot analysis of KAT2B in MCF7ras+SS cells transduced with scrambled shRNA or two independent NELF-E shRNAs and treated with or without Dox. GAPDH was used as the loading control. e Heatmap depiction of SLUG/NELF-E/KAT2B/RNAPII signals at NELF-E-alone, SLUG-alone and NELF-E/SLUG co-bound regions. f Metaplot of KAT2B ChIP-Seq signals over the different cohorts of SLUG-bound regions. g Venn diagram showing the overlap between SLUG-bound UP-genes and NELF-E/KAT2B targets. The percentage overlap of SLUG-bound UP-genes compared to other categories is also indicated. h Genome browser tracks showing the occupancies of NELF-E, SLUG, and KAT2B on LAMC1 and ZEB1 loci. Blots are representative of three independent experiments. p-values are determined by a two-tailed Student’s t-test. Mean ± SD is represented by bar graphs. Source data are provided as a Source Data file.
Fig. 7
Fig. 7. KAT2B activates EMT progression.
a GSEA plot showing significantly enriched pathways in siKAT2B+Dox vs siSCR+Dox MCF7ras+SS cells. p-value was calculated from gene set enrichment analysis (see details in “Methods”). b Western blot analysis of ECM1 and CD44 in MCF7ras+SS cells treated with or without GA and AA. GAPDH was used as the loading control. Images and blots are representative of three independent experiments. c qRT-PCR analysis of FN1 and ECM1 in GA- and AA-treated Dox-induced MCF7ras+SS cells (n = 3). d Flow cytometry analysis and quantification of the CD24low/CD44high population in vehicle control, GA-, and AA-treated MCF7ras+SS cells, as a function of Dox induction. e Flow cytometry analysis and quantification of the CD24low/CD44high population following KAT2B overexpression in MCF7ras+SS cells. Vector control (GFP only; pCAGIG) and KAT2B-overexpression (KAT2B+GFP; pCAGIG-KAT2B) plasmids were transfected into MCF7ras+SS cells, respectively. The GFP and GFP+ populations were isolated and analyzed for the CD24low/CD44high population (n = 3). f, g Patient-derived breast cancer organoids were transduced with scrambled shRNA or two independent KAT2B or NELF-E shRNAs, followed by western blot and sphere-formation assay (n = 3). β-actin was used as the loading control. h Patient-derived breast cancer organoids were transduced with vector control or KAT2B overexpressing plasmid, followed by western blot and sphere-formation assay (n = 4). GAPDH was used as the loading control. Blots and images are representative of at least three independent experiments. p-values in (ch) are determined by a two-tailed Student’s t-test. Mean ± SD is represented by bar graphs. Source data are provided as a Source Data file.

References

    1. Lambert SA, et al. The human transcription factors. Cell. 2018;172:650–665. doi: 10.1016/j.cell.2018.01.029. - DOI - PubMed
    1. Jones PA, Issa JP, Baylin S. Targeting the cancer epigenome for therapy. Nat. Rev. Genet. 2016;17:630–641. doi: 10.1038/nrg.2016.93. - DOI - PubMed
    1. Bradner JE, Hnisz D, Young RA. Transcriptional addiction in cancer. Cell. 2017;168:629–643. doi: 10.1016/j.cell.2016.12.013. - DOI - PMC - PubMed
    1. Whyte WA, et al. Master transcription factors and mediator establish super-enhancers at key cell identity genes. Cell. 2013;153:307–319. doi: 10.1016/j.cell.2013.03.035. - DOI - PMC - PubMed
    1. Marazzi I, Greenbaum BD, Low DHP, Guccione E. Chromatin dependencies in cancer and inflammation. Nat. Rev. Mol. Cell Biol. 2018;19:245–261. doi: 10.1038/nrm.2017.113. - DOI - PubMed

Publication types

MeSH terms