. 2023 Apr 28;14(1):2461.
doi: 10.1038/s41467-023-37031-9.

PeakDecoder enables machine learning-based metabolite annotation and accurate profiling in multidimensional mass spectrometry measurements

Affiliations

PeakDecoder enables machine learning-based metabolite annotation and accurate profiling in multidimensional mass spectrometry measurements

Aivett Bilbao et al. Nat Commun. .

Abstract

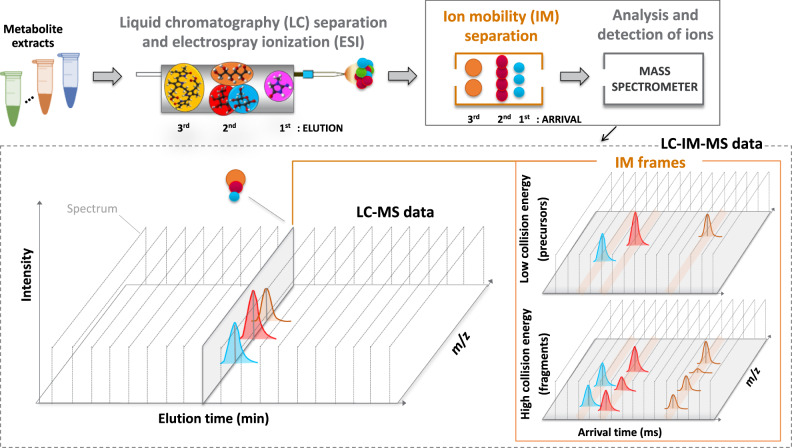
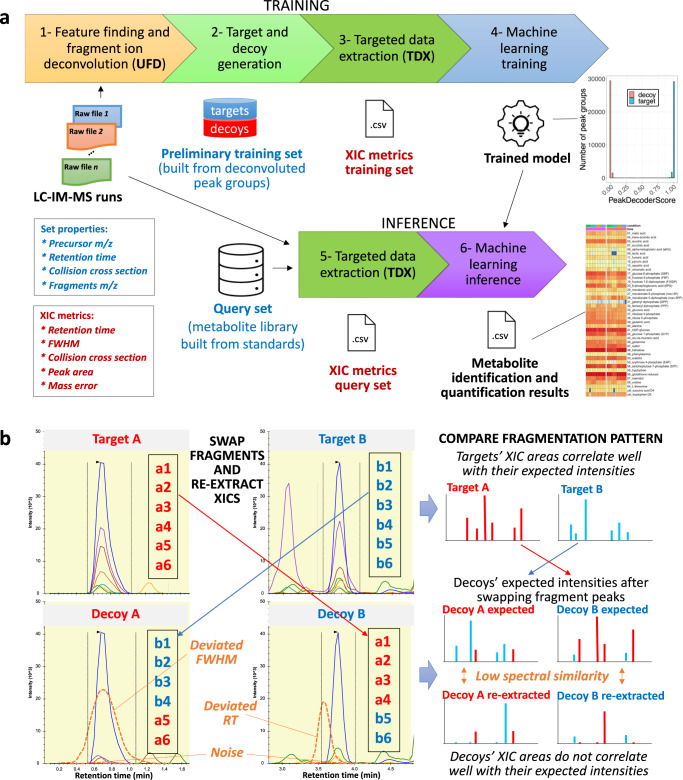
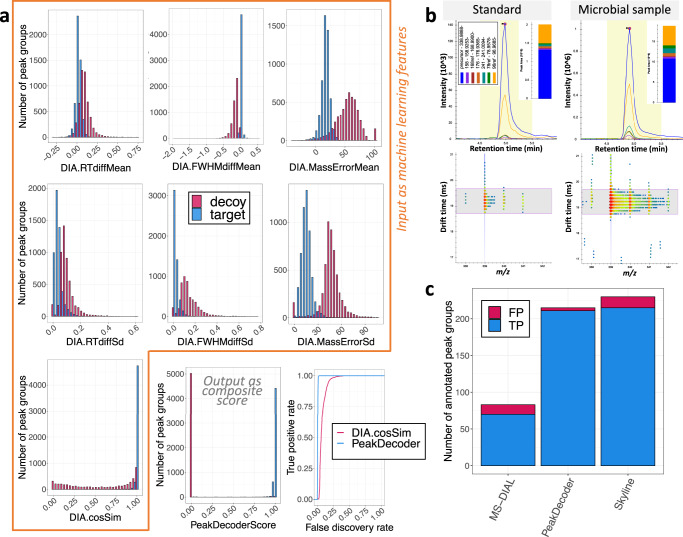
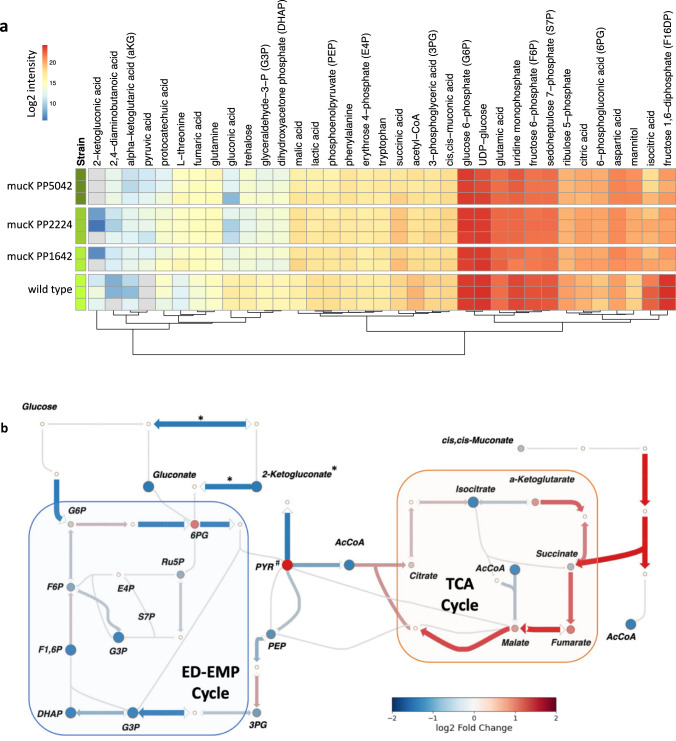
Multidimensional measurements using state-of-the-art separations and mass spectrometry provide advantages in untargeted metabolomics analyses for studying biological and environmental bio-chemical processes. However, the lack of rapid analytical methods and robust algorithms for these heterogeneous data has limited its application. Here, we develop and evaluate a sensitive and high-throughput analytical and computational workflow to enable accurate metabolite profiling. Our workflow combines liquid chromatography, ion mobility spectrometry and data-independent acquisition mass spectrometry with PeakDecoder, a machine learning-based algorithm that learns to distinguish true co-elution and co-mobility from raw data and calculates metabolite identification error rates. We apply PeakDecoder for metabolite profiling of various engineered strains of Aspergillus pseudoterreus, Aspergillus niger, Pseudomonas putida and Rhodosporidium toruloides. Results, validated manually and against selected reaction monitoring and gas-chromatography platforms, show that 2683 features could be confidently annotated and quantified across 116 microbial sample runs using a library built from 64 standards.


Conflict of interest statement

A.G., R.A.F., A.T., and A.A. are employees at Agilent Technologies. The remaining authors declare no competing interests.

Figures

Fig. 1
Fig. 1. Analytical workflow for multidimensional metabolite profiling by LC-IM-MS and data structure.
Metabolite extracts are separated by LC, followed by IM, and analyzed by MS in the All-Ions DIA mode which alternates between low and high collision energies to capture precursor and fragment ion spectra within the same run. Spectra are represented by gray dashed lines. Rather than collecting a single spectrum at every LC time point, coeluting ions (i.e., with close elution times) in this example at the 2nd order of elution and represented by spheres and peaks, in blue, red and orange colors, could be further distinguished by the ion mobility separation where multiple spectra are collected into IM frames. Fragments are detected within the same elution and mobility time window as their precursors. Figure adapted from previous work, with permission from Elsevier.
Fig. 2
Fig. 2. Computational workflow for multidimensional metabolite profiling by LC-IM-MS.
a PeakDecoder algorithm. Step-1: data is processed in untargeted mode (UFD, MS-DIAL) to extract all precursor ion features (MS1) and their respective deconvoluted fragment ions (pseudo MS2) based on co-elution and co-mobility. Step-2: a preliminary training set is generated by using the detected and deconvoluted peak-groups as targets and producing their corresponding decoys. Step-3: targeted data extraction is performed (TDX, Skyline) to extract the precursor and fragment ion signals for the training set from all the LC-IM-MS runs and export their XIC metrics. Step-4: an SVM classifier is trained using multiple scores calculated from the XIC metrics of the training set. Before training, filtering for high-quality fragments is applied to keep high-quality peak-groups as targets (i.e., based on various thresholds for metrics of precursor and at least 3 fragments; details in “Methods”) and their corresponding decoys in the final training set. The model learns to distinguish true and false co-elution and co-mobility, independently of the features’ metabolite identity. Step-5: TDX is performed to extract the signals of the query set of metabolites in the library from all the LC-IM-MS runs and export their XIC metrics. Step-6: the trained model is used to determine the PeakDecoder score of the query set of metabolites and estimate an FDR. b Example of decoy generation. The detected and deconvoluted peak-groups are associated by pairs and used as targets. For each pair of targets, A and B (fragments represented in red and blue colors, respectively), a pair of decoys is generated by keeping the same precursor and its properties and swapping the m/z values of 40–60% of the fragments (from the 6 most intense in this example). XIC metrics for targets correlate well with expected values but deviations and low spectral similarity occur for decoys (examples indicated in orange).
Fig. 3
Fig. 3. Analysis of microbial samples by LC-IM-MS using PeakDecoder.
a Comparison of scores in training. Targets and decoys are represented by blue and red colors, respectively. Distributions of LC-IM-MS peak-groups by each individual score (highlighted in orange) showed limited separation of targets and decoys. Individual scores used as machine learning features were combined into the composite PeakDecoder score providing an improved separation power and resulted in a larger number of true positives for lower FDR thresholds than the cosine similarity score, which is the best score individually. b Example of chromatograms and filtered ion mobility window. Signals for ‘fructose 1,6-diphosphate (F16DP)’ from the standard (precursor m/z 338.98877, RT 4.95 min, CCS 155.00 and 6 fragments) and corresponding peaks from a microbial sample (annotated by PeakDecoder). Chromatograms show the same relative abundances in the standard and the microbial sample confirming the correct metabolite annotation based on fragmentation pattern and RT. The IM frame at the LC apex shows the filtering window corresponding to the expected CCS and highlights the precursor with multiple isotopic peaks. c Benchmarking of identification performance compared to manual curation. True positives (TP) and false positives (FP) are represented by blue and red colors, respectively. PeakDecoder at 1% estimated FDR increased TP annotations (211) compared to MS-DIAL (TP = 70, total score > 60) and decreased by 4 compared to Skyline (TP = 215, cosine similarity > 0.8), while decreasing FP annotations (FP: PeakDecoder = 4, MS-DIAL = 13, Skyline = 15). Results from the P. putida samples (n = 22). Source data are provided as a Source data file.
Fig. 4
Fig. 4. Annotation selectivity by different analytical separations in microbial samples.
a A. pseudoterreus and A. niger (n = 46). b P. putida (n = 22). c R. toruloides (n = 48). Bars represent the number of possible LC-IM-MS peaks from untargeted feature detection results matched within tolerances. Colors represent the type of match: red=Mass, yellow = Mass-RT, blue = Mass-CCS, and purple = Mass-RT-CCS. In all three microbial datasets, using accurate mass alone resulted in the highest number of features, notably for the metabolites with smaller masses. Combining accurate mass to either RT or CCS reduced the number of matched features. By combining accurate mass with both RT and CCS, the number of possible features was reduced to one in most cases. These results illustrate the power of multidimensional separations to increase the annotation confidence and quantitation accuracy in metabolomics studies by resolving the high degree of structural diversity derived from isomers and isobars. Source data are provided as a Source data file.
Fig. 5
Fig. 5. Metabolomics profiling of 3HP-producing A. pseudoterreus and A. niger strains.
a Relative and label-free intracellular metabolites levels quantified by PeakDecoder (n = 46). Red, yellow, and blue colors indicate high, medium, and low log2 intensity values, and gray color indicates missing values. b CCS errors of the good-quality features in 24 samples confirmed the detection of 3HP (green bar, 113.8 CCS) instead of lactic acid (orange bar, 113.0 CCS), which is an isomeric molecule (same formula but with different 3D structure). c Metabolites in the 3HP production pathway and their log2 fold changes over the control sample (parent strain). Statistical analysis was performed using the IMD-ANOVA method. Stars indicate statistically significant changes (*p-value <0.05, **p-value <0.01, and ***p-value <0.001). Y-axis for pyruvic (A. pseudoterreus) and 2,4-diaminobutanoic acids represent mean log2 intensity due to no detection in the control strain. Source data are provided as a Source data file.
Fig. 6
Fig. 6. Metabolomics and proteomics profiling of P. putida wild type and engineered muconate-catabolizing strains.
a Relative and label-free intracellular metabolites levels quantified by PeakDecoder (n = 22, with 11 samples and 2 collision energies per sample). Red, yellow, and blue colors indicate high, medium, and low log2 intensity values, and gray color indicates missing values. b Glucose and muconate catabolism pathways of mucK PP5042 and fold changes compared to the wild-type strain. Circles indicate metabolites and arrows indicate proteins detected by SRM. Symbols indicate protein detection: * detected in the wild type but not detected in the mucK samples and # detected in the mucK but not in the wild type. Source data are provided as a Source data file.
Fig. 7
Fig. 7. Metabolite and enzyme levels in the mevalonate pathway of R. toruloides strains.
a Relative and label-free abundance levels are represented in blue for metabolomics (n = 48, with 24 samples and 2 collision energies per sample) and black for proteomics (n = 24 samples). Strains were grown in hydrolysates with different contents of ash and moisture and collected at 36 and 60 h. b Bisabolene production (extracellular) captured in a dodecane overlay. Data are presented as mean values with error bars from standard deviation of 3 biological replicates. Source data are provided as a Source data file.

References

    1. Liebal UW, Phan ANT, Sudhakar M, Raman K, Blank LM. Machine learning applications for mass spectrometry-based metabolomics. Metabolites. 2020;10:243. doi: 10.3390/metabo10060243. - DOI - PMC - PubMed
    1. Gowda GA, Djukovic D. Overview of mass spectrometry-based metabolomics: opportunities and challenges. Methods Mol. Biol. 2014;1198:3–12. doi: 10.1007/978-1-4939-1258-2_1. - DOI - PMC - PubMed
    1. Hillson N, et al. Building a global alliance of biofoundries. Nat. Commun. 2019;10:2040. doi: 10.1038/s41467-019-10079-2. - DOI - PMC - PubMed
    1. Chaleckis R, Meister I, Zhang P, Wheelock CE. Challenges, progress and promises of metabolite annotation for LC-MS-based metabolomics. Curr. Opin. Biotechnol. 2019;55:44–50. doi: 10.1016/j.copbio.2018.07.010. - DOI - PubMed
    1. Zhang XW, Li QH, Xu ZD, Dou JJ. Mass spectrometry-based metabolomics in health and medical science: a systematic review. RSC Adv. 2020;10:3092–3104. doi: 10.1039/C9RA08985C. - DOI - PMC - PubMed

Publication types