. 2023 Apr 28;14(1):2442.
doi: 10.1038/s41467-023-37963-2.

Pain-causing stinging nettle toxins target TMEM233 to modulate NaV1.7 function

Affiliations

Pain-causing stinging nettle toxins target TMEM233 to modulate NaV1.7 function

Sina Jami et al. Nat Commun. .

Abstract

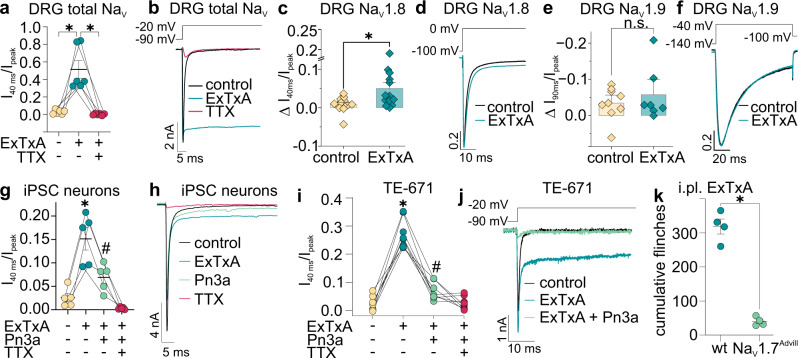
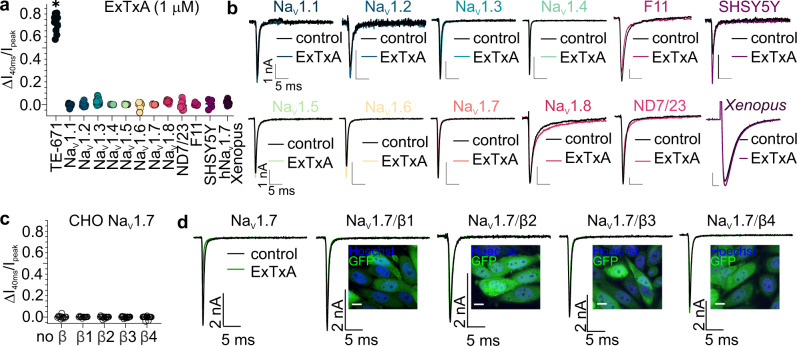
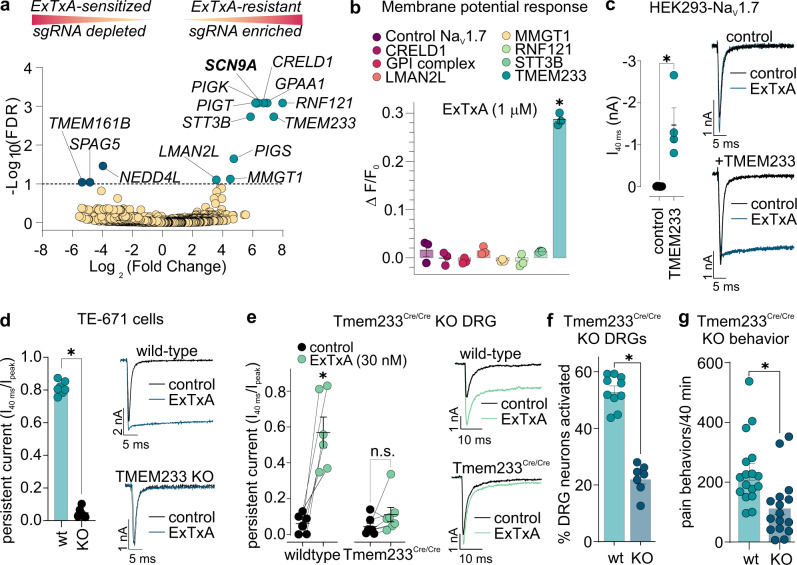
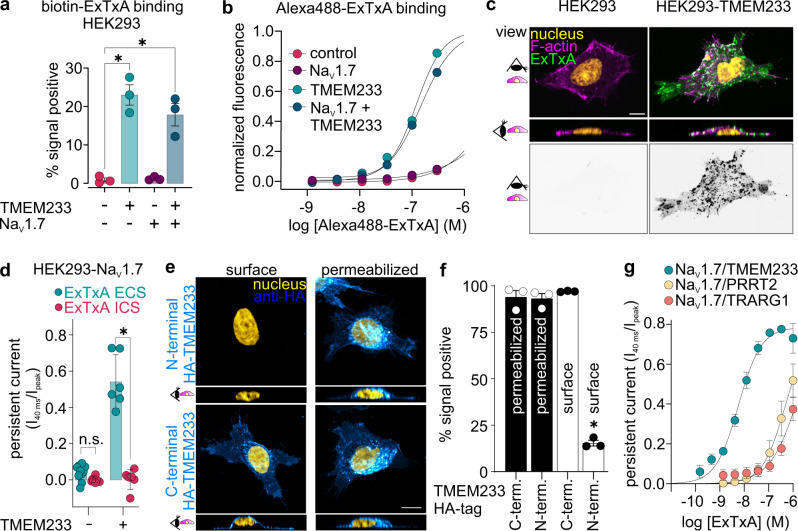
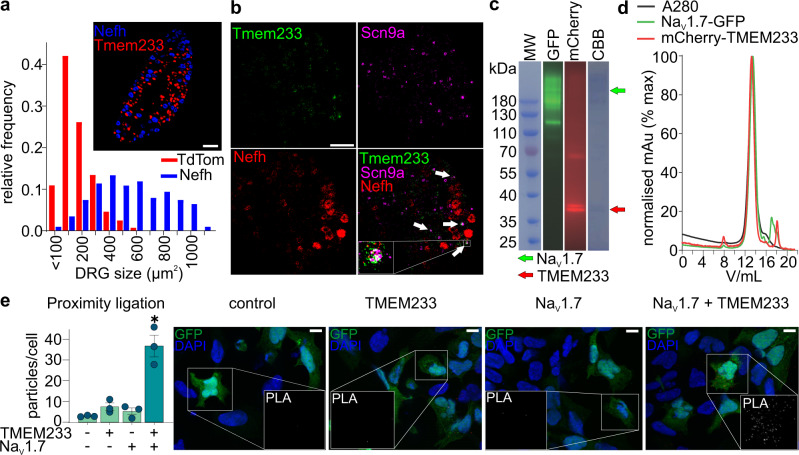
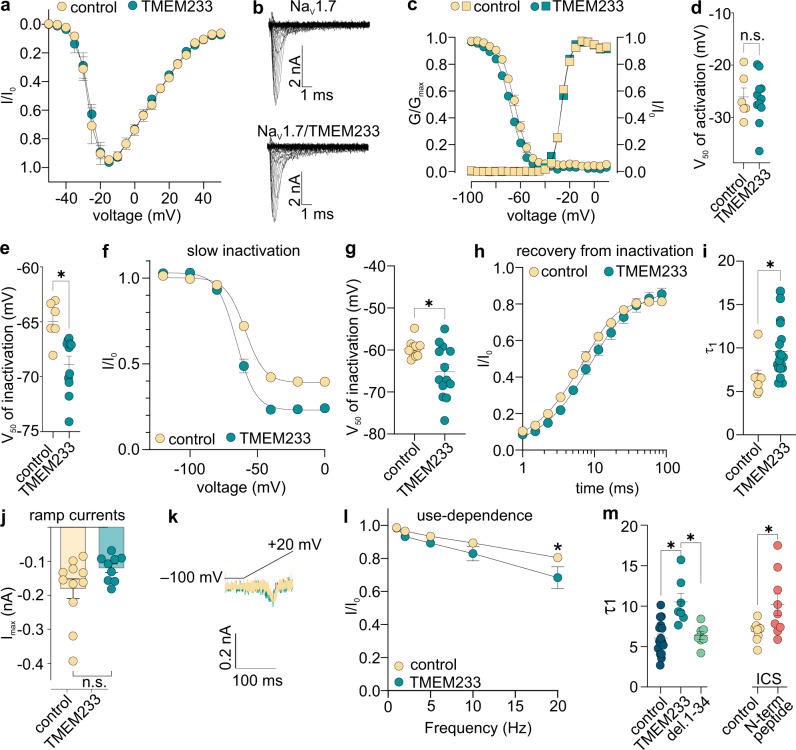
Voltage-gated sodium (NaV) channels are critical regulators of neuronal excitability and are targeted by many toxins that directly interact with the pore-forming α subunit, typically via extracellular loops of the voltage-sensing domains, or residues forming part of the pore domain. Excelsatoxin A (ExTxA), a pain-causing knottin peptide from the Australian stinging tree Dendrocnide excelsa, is the first reported plant-derived NaV channel modulating peptide toxin. Here we show that TMEM233, a member of the dispanin family of transmembrane proteins expressed in sensory neurons, is essential for pharmacological activity of ExTxA at NaV channels, and that co-expression of TMEM233 modulates the gating properties of NaV1.7. These findings identify TMEM233 as a previously unknown NaV1.7-interacting protein, position TMEM233 and the dispanins as accessory proteins that are indispensable for toxin-mediated effects on NaV channel gating, and provide important insights into the function of NaV channels in sensory neurons.


Conflict of interest statement

The authors declare no competing interests.

Figures

Fig. 1
Fig. 1. ExTxA inhibits NaV1.7 inactivation in neurons and TE-671 cells.
a Total persistent NaV current in DRG neurons after perfusion of buffer control (0.1% BSA), ExTxA (100 nM) and ExTxA + TTX (1 μM). ExTxA induces persistent NaV currents that are blocked by TTX. b Representative recording from a DRG neuron showing large TTX-s persistent current induced by ExTxA (100 nM). c Change in persistent NaV1.8 current (ΔI40 ms/Ipeak; pre- and post-perfusion of buffer control (0.1% BSA) and ExTxA (100 nM)) in DRG neurons from NaV1.9−/− mice in the presence of TTX (1 μM). ExTxA slightly increased persistent currents of NaV1.8 channels. d Representative normalized NaV1.8 currents from buffer control (0.1% BSA) and ExTxA (100 nM)-treated NaV1.9−/− DRG neurons. e Change in persistent NaV1.9 current (ΔI90 ms/Ipeak; pre- and post-perfusion of buffer control (0.1% BSA) and ExTxA (1 μM)) in DRG neurons from NaV1.8−/− mice in the presence of TTX (1 μM). ExTxA did not affect persistent currents of NaV1.9 channels. f Representative normalized NaV1.9 currents of buffer control (0.1% BSA) and ExTxA (1 μM)-treated NaV1.8−/− DRG neurons. g Effect of ExTxA (100 nM) on NaV1.7 current in human iPSC-derived sensory neurons. *p < 0.05 (control vs ExTxA); #p < 0.05 (ExTxA vs ExTxA +Pn3a). h Representative NaV current in human iPSC-derived sensory neurons showing effect of ExTxA (100 nM) as well as inhibition by the selective NaV1.7 blocker Pn3a (100 nM), and TTX (1 µM). i Effect of ExTxA (100 nM) on persistent current (I40ms/IPeak) in TE-671 cells endogenously expressing Pn3a-sensitive NaV1.7. j Representative current traces of ExTxA-induced effects on NaV1.7 endogenously expressed in TE-671 cells. k Nocifensive behaviors (cumulative paw licks and flinches over 60 min) induced by intraplantar injection of ExTxA (10 nM) in wild-type controls (wt) and NaV1.7Advill mice. n values and statistical information are detailed in Supplementary Table 1. Source data are included as a Source Data file.
Fig. 2
Fig. 2. ExTxA does not inhibit NaV1.7 inactivation heterologous expression systems.
a Persistent current (I40 ms/Ipeak) induced by ExTxA (1 μM) in TE-671 cells, HEK293 cells stably expressing β1 and hNaV1.1, hNaV1.2, hNaV1.3, hNaV1.4, hNaV1.5, hNaV1.6, hNaV1.7 or CHO cells expressing hNaV1.8/β3, ND7/23 cells, F11 cells, SH-SY5Y neuroblastoma cells and Xenopus oocytes expressing hNaV1.7. b Representative control (black) and ExTxA-treated (1 μM, colored) normalized current traces of data shown in (a). Current was elicited by a depolarizing step to −20 mV (−10 mV for oocytes) from a holding potential of −90 mV. Scale bar: all 1 nA, 5 ms except oocytes (1 µA, 5 ms). c ExTxA (1 μM) effect on persistent current (I40 ms/Ipeak) in CHO cells expressing hNaV1.7 with or without the β1, β2, β3 or β4 subunit. d Representative control (black) and ExTxA-treated (1 μM, green) current traces of data shown in (c). Inset: Expression of GFP confirming successful transfection of the GFP-IRES β subunit plasmids. Scale bar, 10 µm. Data are shown as mean ± SEM; n.s., not significant; *,#p < 0.05. n values and statistical information are detailed in Supplementary Table 1. Source data are included as a Source Data file.
Fig. 3
Fig. 3. TMEM233 is required for ExTxA-induced inhibition of NaV1.7 inactivation.
a LentiCRISPR-Cas9 TKOv3 screen showing depletion and enrichment of sgRNAs in control (veratridine, 5 μM; ouabain, 20 nM) and ExTxA-treated (ExTxA, 1 μM; veratridine, 5 μM; ouabain, 20 nM) TE-671 cells. b ExTxA (1 μM)-induced change of membrane potential dye fluorescence (ΔF/F0) in HEK293-NaV1.7 cells co-transfected with CRELD1, GPI complex (GPAA1, PIGU, PIGS, PIGK, PIGT), LMAN2L, MMGT1, RNF121, STT3B, and TMEM233. c Persistent currents (I40 ms; nA) induced by ExTxA (1 μM) in HEK293-NaV1.7 cells (control) and HEK293-NaV1.7 cells co-transfected with TMEM233 (TMEM233). Right panels, representative current traces; depolarization to −20 mV from −90 mV holding potential. d Normalized persistent currents (I40 ms/Ipeak) induced by ExTxA (1 μM) in wild-type TE-671 cells (wt) and following CRISPR/Cas9-mediated knockdown of TMEM233 (KO). Right panels, representative current traces; depolarization to −20 mV from −90 mV holding potential. e Normalized total persistent NaV current (I40 ms/Ipeak) in presence of buffer (0.1% BSA; pre) and after ExTxA (30 nM) in DRG neurons from wild-type and Tmem233Cre/Cre knockout mice. Right panels, representative current traces; depolarization to −20 mV from −80 mV holding potential. f The percentage of cultured DRG neurons from wild-type C57BL/6 (wt) and Tmem233Cre/Cre knockout (KO) mice activated by ExTxA (20 nM). g Cumulative pain behaviors (paw licks and flinches over 40 min) following intraplantar injection of ExTxA in littermate C57BL/6 (wt) and Tmem233Cre/Cre knockout mice (KO). Data are shown as mean ± SEM; *p < 0.05. n values and statistical information are detailed in Supplementary Table 1. Source data are provided as a Source Data file.
Fig. 4
Fig. 4. ExTxA interacts directly with TMEM233.
a Percentage of fluorescence signal-positive cells, determined by flow cytometry, following staining with biotinylated ExTxA (1 μM) and DyLight680-conjugated streptavidin in untransfected or TMEM233-transfected HEK293 and HEK293-NaV1.7 cells. b Fluorescence intensity following staining with Alexa488-conjugated ExTxA (1–300 nM) in mock- or TMEM233-transfected HEK293 and HEK293-NaV1.7 cells. c Confocal microscopy image showing Alexa488-streptavidin signal only in TMEM233-expressing cells following incubation with biotinylated ExTxA (1 μM). Yellow: nucleus; magenta: F-actin; green: ExTxA. Middle panels: orthogonal view. Bottom panels: inverted grayscale of ExTxA signal. Scale bar, 10 μm. Image representative of 3 independent experiments. d Normalized persistent current (I40 ms/Ipeak), induced by ExTxA (100 nM) either in the extracellular solution (ECS) or intracellular solution (ICS), in HEK293-NaV1.7 cells co-transfected with TMEM233. e Confocal microscopy image showing anti-HA immunofluorescence in non-permeabilized (surface) or permeabilized HEK293 cells transfected with either C-terminal or N-terminal HA-tagged TMEM233. Blue, anti-HA; yellow, nucleus. Scale bar, 10 μm. f Percentage of fluorescence signal-positive cells, determined by flow cytometry, of permeabilized or non-permeabilized HEK293 cells transfected with either C-terminal or N-terminal HA-tagged TMEM233 following staining with anti-HA antibody. g Concentration-response curves of ExTxA-induced normalized persistent currents (I40 ms/Ipeak) in HEK293-NaV1.7 cells co-transfected with TMEM233, PRRT2 or TRARG1. Data are shown as mean ± SEM; *p < 0.05. n values and statistical information are detailed in Supplementary Table 1. Source data are included as a Source Data file.
Fig. 5
Fig. 5. TMEM233 is expressed in dorsal root ganglion neurons and can associate with NaV1.7.
a Expression of tdTomato (red) and Nefh RNA, detected with RNAscope analysis (TS405, blue), in lumbar DRGs isolated from adult Tmem233Cre/Rosa-CAG-flox-stop-tdTomato mice. Inset, representative image of DRG section used for analysis, from 4 independent experiments. Scale bar, 200 μm. b Tmem233 and Scn9a RNA expression and localization in fresh-frozen sections of mouse DRGs determined by RNAscope analysis. Localization of Tmem233 mRNA (green, AF488) was compared to Nefh mRNA (red, Opal570) and Scn9a mRNA (far-red, Opal650, shown in magenta). Arrows, neurons expressing both Tmem233 and Scn9a leading to white signal color overlap. Scale bar, 100 μm. Image representative of 2 independent experiments. c SDS-PAGE gel of purified NaV1.7-TMEM233 complex. CBB (Coomassie brilliant blue staining), GFP (green fluorescent protein) fluorescence and mCherry fluorescence of the same SDS-PAGE gel. The green and red arrow indicate NaV1.7-GFP and mCherry-TMEM233 bands, respectively. MW, molecular weight marker (kDa). d Normalized size-exclusion chromatography profile of the purified NaV1.7-TMEM233 complex. Signals of total protein (black), GFP (green) and mCherry (red) were detected simultaneously. e Left: Quantification of proximity ligation assay signal in GFP-positive HEK293 cells transfected with GFP as well as N-terminal FLAG-tagged hNaV1.7 and N-terminal HA-tagged TMEM233 alone or in combination. Right: Representative images showing nuclei (DAPI, blue), GFP (Green) and proximity ligation signal (red channel, enlarged view in inset shown in grayscale for clarity). Scale bar, 10 μm. Data are shown as mean ± SEM; *, p < 0.05. n values and statistical information are detailed in Supplementary Table 1. Source data are included as a Source Data file.
Fig. 6
Fig. 6. Effects of TMEM233 on NaV1.7 function.
a Current-voltage relationship and (b) family of sample traces from hNaV1.7 (n = 6) co-expressed with TMEM233 (n = 11) in HEK293 cells. c Superimposed conductance–voltage (G–V, squares) and steady-state fast inactivation (circles) curves, of mock- (control, yellow) and TMEM233-transfected (teal) HEK293-NaV1.7 cells. d V50 of activation and (e) V50 of inactivation of mock- and TMEM233-transfected HEK293-NaV1.7 cells. f Voltage-dependence of slow inactivation and (g) V50 of slow inactivation in mock- and TMEM233-transfected HEK293-NaV1.7 cells. h Time-dependence and (i) time constant τ1 of recovery from fast inactivation in mock- and TMEM233-transfected HEK293-NaV1.7 cells. j Peak currents (Imax, nA) and (k) representative traces of currents elicited by slow ramp depolarizations (−100 mV to +20 mV at 1 mV/s) in control and TMEM233-transfected HEK293-NaV1.7 cells. l Peak currents of the last depolarization (30th pulse), normalized to the first pulse, from control and TMEM233-transfected HEK293-NaV1.7 cells at pulse frequencies of 1, 2, 5, 10, and 20 Hz. m Left: Time constant τ1 of recovery from fast inactivation in HEK293-NaV1.7 cells that were mock-transfected (control), transfected with full-length TMEM233 (TMEM233) or N-terminally truncated TMEM233 lacking residues 1–34 (del. 1–34). Right: Time constant τ1 of recovery from fast inactivation in HEK293-NaV1.7 cells with buffer control (0.1% BSA) or synthetic TMEM233 N-terminal peptide (100 μM) in the intracellular solution (ICS). Data are shown as mean ± SEM; n.s., not significant; *p < 0.05. n values and statistical information are detailed in Supplementary Table 1. Source data are included as a Source Data file.

References

    1. Bennett DL, Clark AJ, Huang J, Waxman SG, Dib-Hajj SD. The role of voltage-gated sodium channels in pain signaling. Physiol. Rev. 2019;99:1079–1151. doi: 10.1152/physrev.00052.2017. - DOI - PubMed
    1. Catterall WA, Lenaeus MJ, Gamal El-Din TM. Structure and pharmacology of voltage-gated sodium and calcium channels. Annu. Rev. Pharmacol. Toxicol. 2020;60:133–154. doi: 10.1146/annurev-pharmtox-010818-021757. - DOI - PubMed
    1. Catterall WA, Goldin AL, Waxman SG. International Union of Pharmacology. XLVII. Nomenclature and structure-function relationships of voltage-gated sodium channels. Pharmacol. Rev. 2005;57:397–409. doi: 10.1124/pr.57.4.4. - DOI - PubMed
    1. Guy HR, Seetharamulu P. Molecular model of the action potential sodium channel. Proc. Natl Acad. Sci. USA. 1986;83:508–512. doi: 10.1073/pnas.83.2.508. - DOI - PMC - PubMed
    1. Catterall WA. Voltage-dependent gating of sodium channels: correlating structure and function. Trends Neurosci. 1986;9:7–10. doi: 10.1016/0166-2236(86)90004-4. - DOI

Publication types