

Network Analysis of Academic Medical Center Websites in the United States
- PMID: 37117246
- PMCID: PMC10147938
- DOI: 10.1038/s41597-023-02104-3
Network Analysis of Academic Medical Center Websites in the United States
Abstract
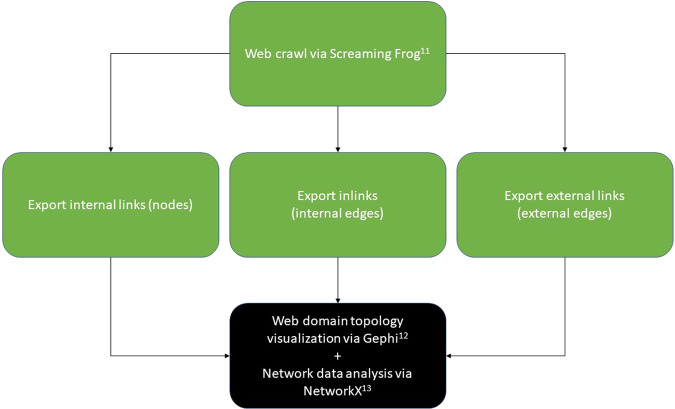
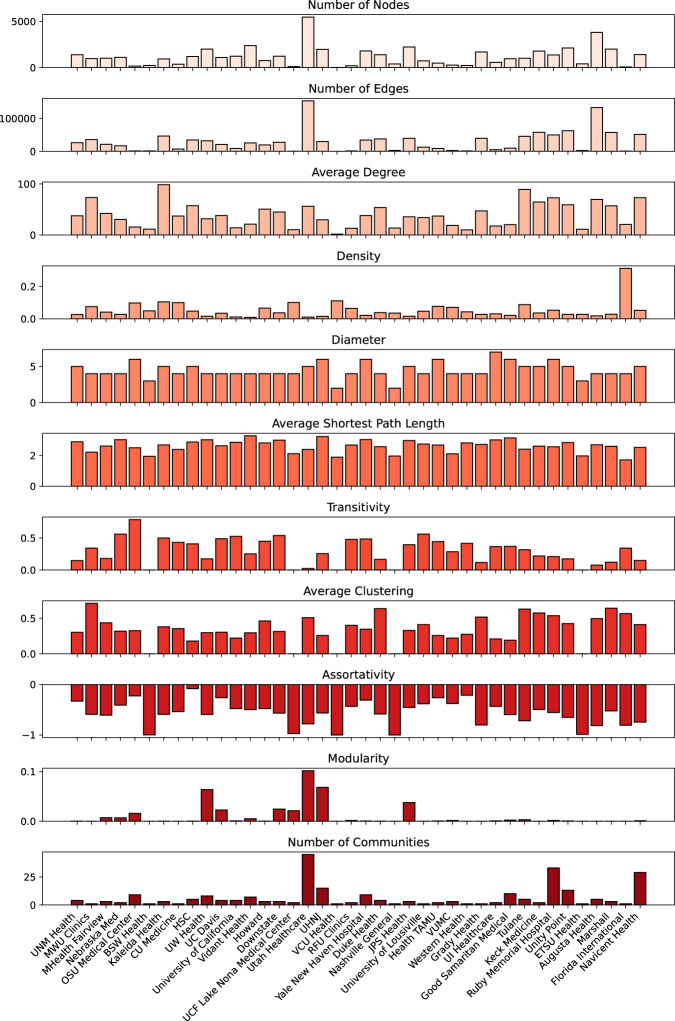
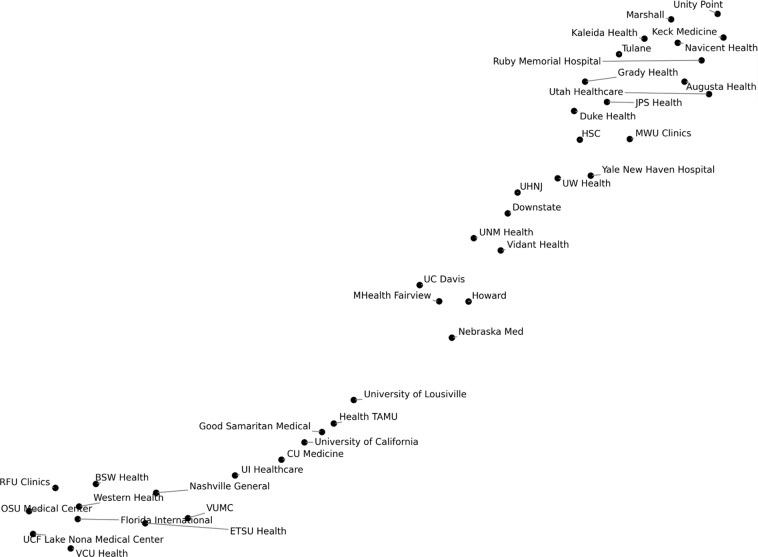
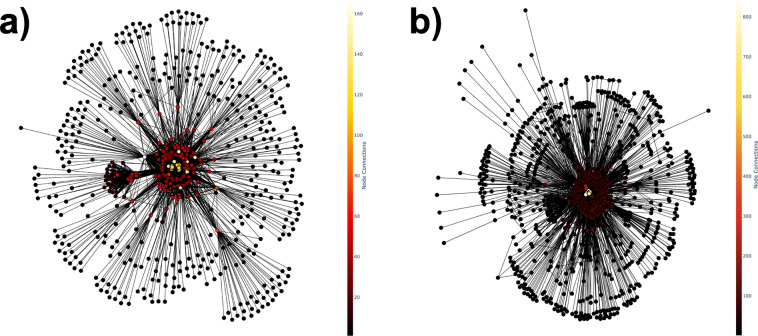
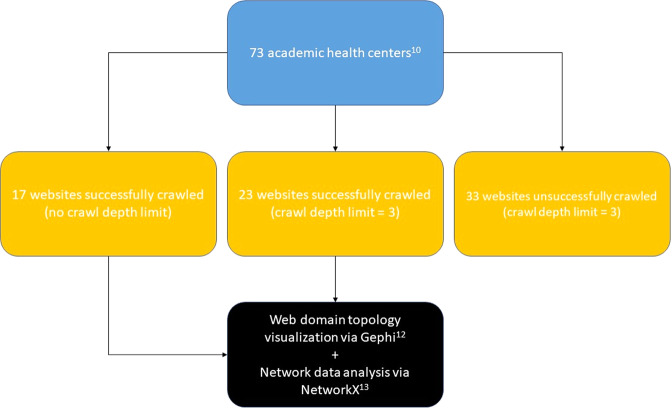
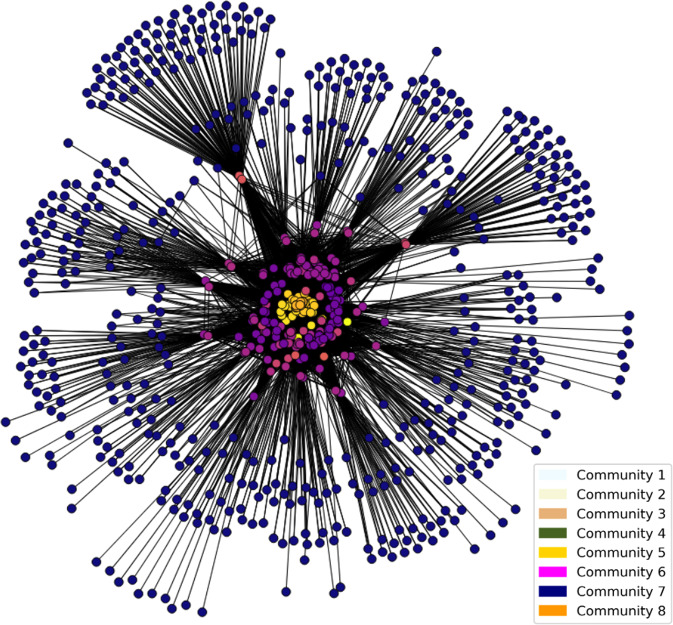
Healthcare resources are published annually in repositories such as the AHA Annual Survey DatabaseTM. However, these data repositories are created via manual surveying techniques which are cumbersome in collection and not updated as frequently as website information of the respective hospital systems represented. Also, this resource is not widely available to patients in an easy-to-use format. Network analysis techniques have the potential to create topological maps which serve to aid in pathfinding for patients in their search for healthcare services. This study explores the topological structure of forty United States academic health center websites. Network analysis is utilized to analyze and visualize 48,686 webpages. Several elements of network structure are examined including basic network properties, and centrality measures distributions. The Louvain community detection algorithm is used to examine the extent to which these techniques allow identification of healthcare resources within networks. The results indicate that websites with related healthcare services tend to form observable clusters useful in mapping key resources within a hospital system.
© 2023. The Author(s).
Conflict of interest statement
SH has the following interests to declare (below); otherwise, the authors have no competing interests to declare. SH: Unrelated: Advisory Board: Covid Act Now, Safeter.App. Co-Founder: Co-Founder, Executive Board ConductScience Inc. Committees: American College of Emergency Physician Supply Chain Task Force. Research Funding: Foundation for Opioid Response Efforts (FORE). Personal Fees: Withings Inc, Boston Globe, American College of Emergency Physicians, Maze Eng Inc, ConductScience Inc, Curative Medical Associates, VIO Med Spa New England. No other disclosures are reported. SH is a volunteer at Emojination.
Figures
References
-
- Chiesi, A. M. Network analysis. International Encyclopedia of the Social & Behavioral Sciences. 10499–10502. 10.1016/b0-08-043076-7/04211-x (2001).
-
- Baggio, R., Antonioli Corigliano, M. On the importance of hyperlinks: A network science approach. Höpken, W., Gretzel, U., Law, R. Information and Communication Technologies in Tourism 2009. 309–318. 10.1007/978-3-211-93971-0_26 (2009).
-
- Raisi H, Baggio R, Barratt-Pugh L, Willson G. Hyperlink network analysis of a tourism destination. Journal of Travel Research. 2018;57:671–686. doi: 10.1177/0047287517708256. - DOI
Publication types
LinkOut - more resources
Full Text Sources
