

Alteration of taste perception, food neophobia and oral microbiota composition in children with food allergy
- PMID: 37117251
- PMCID: PMC10147366
- DOI: 10.1038/s41598-023-34113-y
Alteration of taste perception, food neophobia and oral microbiota composition in children with food allergy
Abstract
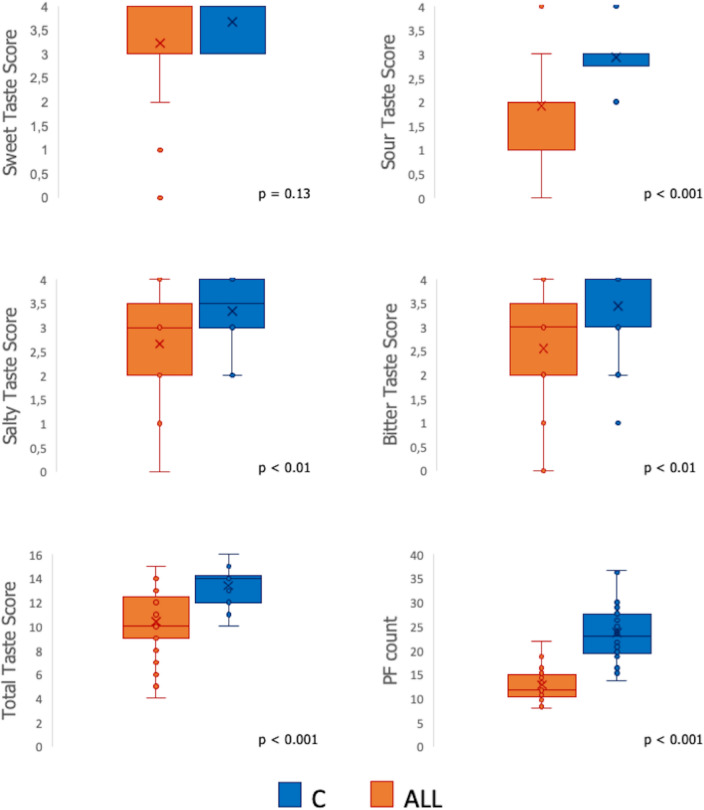
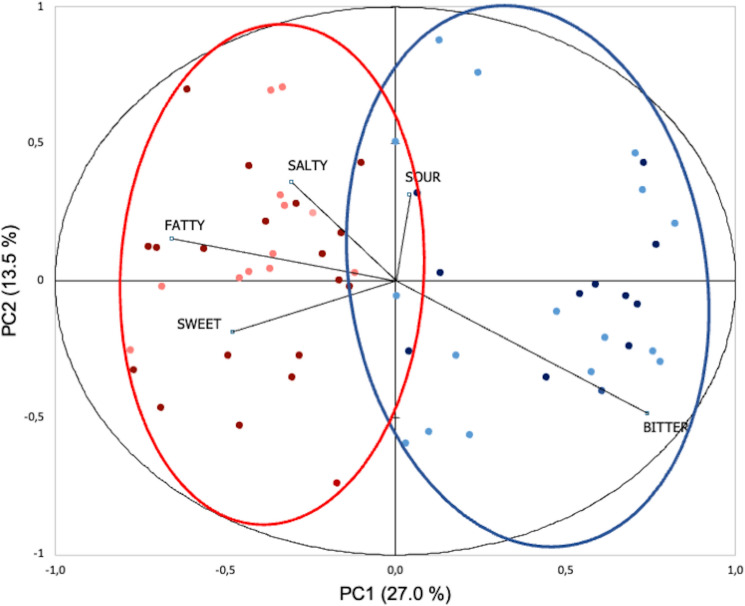
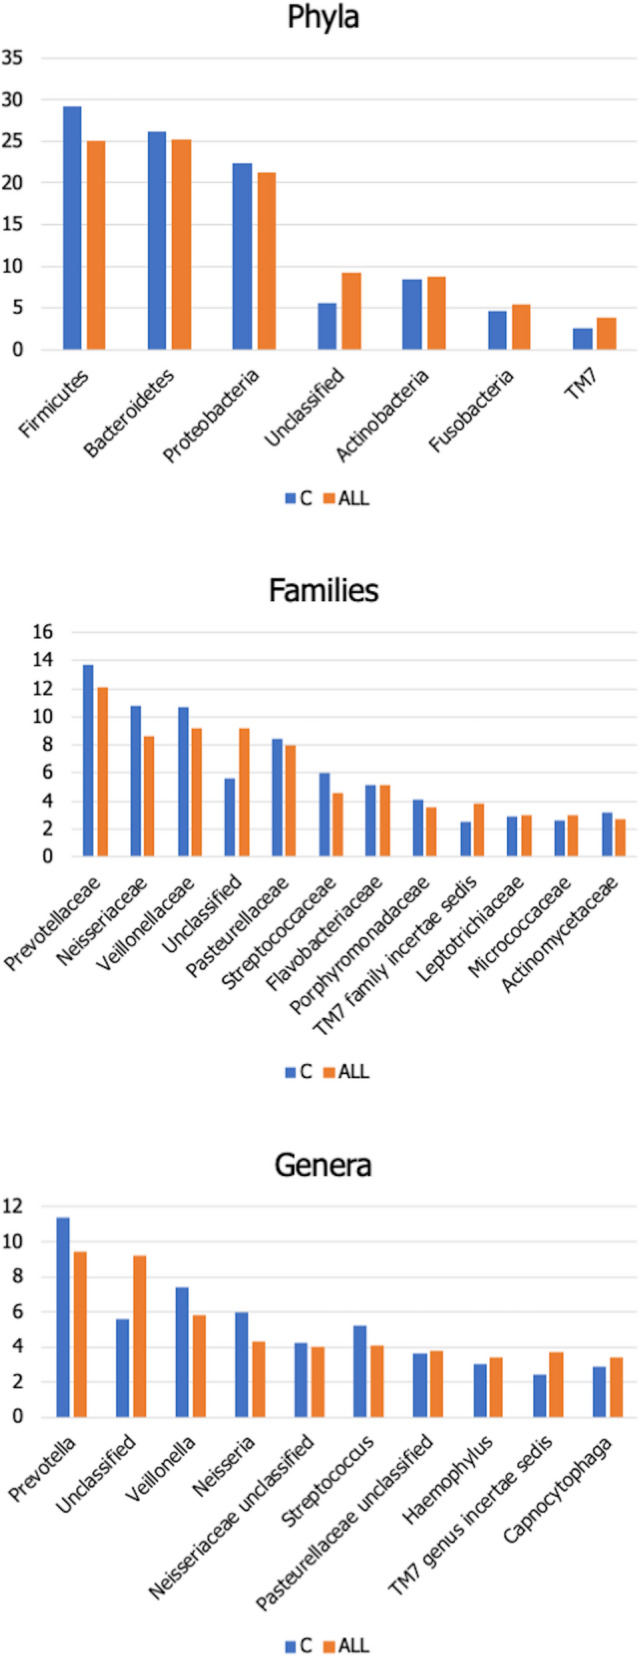
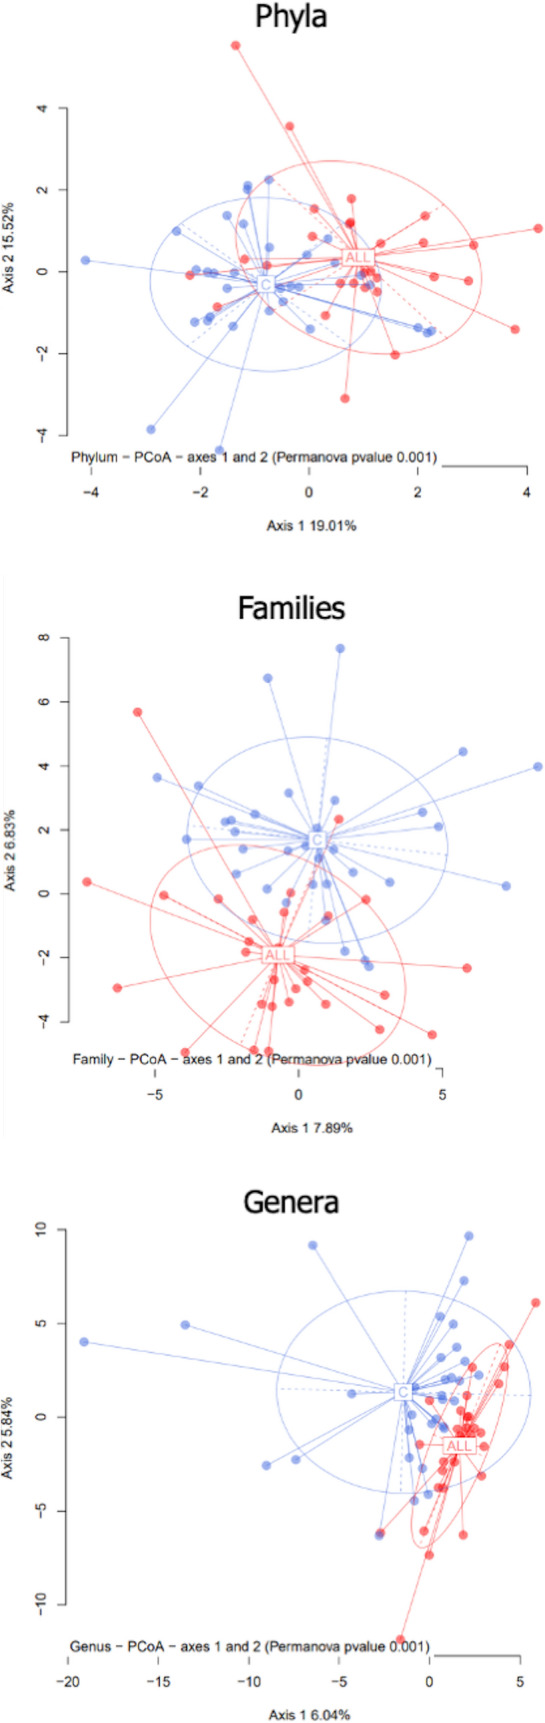
Currently, the mechanisms underlying sensory perception and sensory performance in children with food allergies are far from being understood. As well, only recently, single research afforded the oral host-commensal milieu, addressing oral microbial communities in children with peanut allergies. To bridge the current gaps in knowledge both in the sensory and microbial fields, a psychophysiological case-control study was performed in allergic children (n = 29) and a healthy sex-age-matched control group (n = 30). Taste perception, food neophobia, and liking were compared in allergic and non-allergic children. The same subjects were characterized for their oral microbiota composition by addressing saliva to assess whether specific profiles were associated with the loss of oral tolerance in children with food allergies. Our study evidenced an impaired ability to correctly identify taste qualities in the allergic group compared to controls. These results were also consistent with anatomical data related to the fungiform papillae on the tongue, which are lower in number in the allergic group. Furthermore, distinct oral microbial profiles were associated with allergic disease, with significant down-representations of the phylum Firmicutes and of the genera Veillonella spp., Streptococcus spp., Prevotella spp., and Neisseria spp. For the first time, this study emphasizes the link between sensory perception and food allergy, which is a novel and whole-organism view of this pathology. Our data indicated that an impaired taste perception, as regards both functionality and physiologically, was associated with food allergy, which marginally influences the food neophobia attitude. It is also accompanied by compositional shifts in oral microbiota, which is, in turn, another actor of this complex interplay and is deeply interconnected with mucosal immunity. This multidisciplinary research will likely open exciting new approaches to therapeutic interventions.
© 2023. The Author(s).
Conflict of interest statement
The authors declare no competing interests.
Figures
Similar articles
-
Taste perception and oral microbiota are associated with obesity in children and adolescents.PLoS One. 2019 Sep 11;14(9):e0221656. doi: 10.1371/journal.pone.0221656. eCollection 2019. PLoS One. 2019. PMID: 31509575 Free PMC article.
-
Associations Among Taste Perception, Food Neophobia and Preferences in Type 1 Diabetes Children and Adolescents: A Cross-Sectional Study.Nutrients. 2019 Dec 13;11(12):3052. doi: 10.3390/nu11123052. Nutrients. 2019. PMID: 31847252 Free PMC article.
-
Multidimensional study of the oral microbiome, metabolite, and immunologic environment in peanut allergy.J Allergy Clin Immunol. 2021 Aug;148(2):627-632.e3. doi: 10.1016/j.jaci.2021.03.028. Epub 2021 Apr 2. J Allergy Clin Immunol. 2021. PMID: 33819506 Free PMC article. Clinical Trial.
-
Biological films adhering to the oral soft tissues: Structure, composition, and potential impact on taste perception.J Texture Stud. 2019 Feb;50(1):19-26. doi: 10.1111/jtxs.12363. Epub 2018 Oct 1. J Texture Stud. 2019. PMID: 30226267 Review.
-
Emerging perspectives: the interplay of taste perception and oral microbiota composition in dietary preferences and obesity.Nutr Res Rev. 2024 Oct 21:1-10. doi: 10.1017/S0954422424000295. Online ahead of print. Nutr Res Rev. 2024. PMID: 39428655 Review.
Cited by
-
Impact of ovalbumin allergy on oral and gut microbiome dynamics in 6-week-old BALB/c mice.Front Microbiol. 2024 Sep 3;15:1439452. doi: 10.3389/fmicb.2024.1439452. eCollection 2024. Front Microbiol. 2024. PMID: 39290514 Free PMC article.
-
The bacterial species profiles of the lingual and salivary microbiota differ with basic tastes sensitivity in human.Sci Rep. 2023 Nov 20;13(1):20339. doi: 10.1038/s41598-023-47636-1. Sci Rep. 2023. PMID: 37989857 Free PMC article.
-
Food Neophobia in Brazilian Children: A Nationwide Cross-Sectional Study Comparing Neurodivergent and Neurotypical Children with and Without Dietary Restrictions.Nutrients. 2025 Apr 11;17(8):1327. doi: 10.3390/nu17081327. Nutrients. 2025. PMID: 40284192 Free PMC article.
-
Tongue coating microbial communities vary in children with Henoch-Schönlein purpura.Sci Rep. 2025 Feb 14;15(1):5466. doi: 10.1038/s41598-025-88610-3. Sci Rep. 2025. PMID: 39953112 Free PMC article.
-
Assessing Feeding Difficulties in Children Presenting with Non-IgE-Mediated Gastrointestinal Food Allergies-A Commonly Reported Problem.Nutrients. 2024 May 22;16(11):1563. doi: 10.3390/nu16111563. Nutrients. 2024. PMID: 38892497 Free PMC article.
References
MeSH terms
LinkOut - more resources
Full Text Sources
Medical
Research Materials
Miscellaneous
