. 2023 Apr;4(4):305-319.
doi: 10.1038/s43016-023-00731-y. Epub 2023 Apr 20.

Children's and adolescents' rising animal-source food intakes in 1990-2018 were impacted by age, region, parental education and urbanicity

Collaborators, Affiliations

Children's and adolescents' rising animal-source food intakes in 1990-2018 were impacted by age, region, parental education and urbanicity

Victoria Miller et al. Nat Food. 2023 Apr.

Abstract

Animal-source foods (ASF) provide nutrition for children and adolescents' physical and cognitive development. Here, we use data from the Global Dietary Database and Bayesian hierarchical models to quantify global, regional and national ASF intakes between 1990 and 2018 by age group across 185 countries, representing 93% of the world's child population. Mean ASF intake was 1.9 servings per day, representing 16% of children consuming at least three daily servings. Intake was similar between boys and girls, but higher among urban children with educated parents. Consumption varied by age from 0.6 at <1 year to 2.5 servings per day at 15-19 years. Between 1990 and 2018, mean ASF intake increased by 0.5 servings per week, with increases in all regions except sub-Saharan Africa. In 2018, total ASF consumption was highest in Russia, Brazil, Mexico and Turkey, and lowest in Uganda, India, Kenya and Bangladesh. These findings can inform policy to address malnutrition through targeted ASF consumption programmes.


Figures

Extended Data Fig. 1 ∣
Extended Data Fig. 1 ∣. National milk intake (g/d) from 185 countries, by age.
Of 185 countries, 20, representing 867 million or 34.0%, had Intakes <1 serving per day. Of 185 countries, 22 had mean intakes of at least one serving of milk (245 g) daily (representing 7.7% of the global child population), and 21 of 185 (representing 10.7% of the global child population) had mean intakes of <1 serving per week.
Extended Data Fig. 2 ∣
Extended Data Fig. 2 ∣. National cheese intake (g/d) from 185 countries, by age.
Of 185 countries, 8 had mean intakes of at least one serving of cheese (42 g) daily (representing <1% of the global child population), and 88 of 185 (representing 75.7% of the global child population) had mean intakes of <1 serving per week.
Extended Data Fig. 3 ∣
Extended Data Fig. 3 ∣. National yogurt intake (g/d) from 185 countries, by age.
Of 185 countries, 25 had mean intakes of ≥2 servings of yogurt (245 g) per week (representing 5.2% of the global child population).
Extended Data Fig. 4 ∣
Extended Data Fig. 4 ∣. National egg intake (g/d) from 185 countries, by age.
Only 5 of 185 countries consumed ≥1 egg (55 g) daily, representing 0.9% of the global child population, and 41 of 185 (representing 41.3% of the global child population) consumed <1 serving per week.
Extended Data Fig. 5 ∣
Extended Data Fig. 5 ∣. National seafood intake (g/d) from 185 countries, by age.
Only 8 of 185 countries consumed a mean of ≥2 servings of seafood (100 g each) per week, representing 2.0% of the global child population, while 56 countries representing 1.2 billion children (45.3% of the global child population) had mean intakes of <1 serving per week.
Extended Data Fig. 6 ∣
Extended Data Fig. 6 ∣. National unprocessed red meat intake (g/d) from 185 countries, by age.
Of 185 countries, 14 (representing 17.9% of the global child population) had mean consumption of ≥1 serving of unprocessed red meat (100 g) per day, and 24 of 185 (representing 33.5% of the global child population) had mean consumption of <1 serving per week.
Extended Data Fig. 7 ∣
Extended Data Fig. 7 ∣. National processed meat intake (g/d) from 185 countries, by age.
Of 185 countries, 28 (representing 9.2% of the global child population) had mean intakes of ≥1 serving of processed meat (50 g) daily, and 37 of 185 (representing 44.6% of the global child population) had mean intakes of <1 serving per week.
Fig. 1 ∣
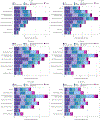
Fig. 1 ∣. Mean global and regional consumption of ASF in 2018 (servings per day) by age.
One serving of unprocessed red meat = 100 g; total processed meat = 50 g; seafood = 100 g; egg = 55 g; cheese = 42 g; yogurt = 245 g; and milk = 245 g.
Fig. 2 ∣
Fig. 2 ∣. Mean national consumption of total ASF (milk, cheese, yogurt, eggs, seafood, unprocessed red meat and processed meat) in 2018 (servings per day), by age.
Of 185 countries, 68, representing 16.3% of the global child population, had mean ASF consumption of ≥3 servings per day.
Fig. 3 ∣
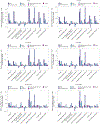
Fig. 3 ∣. Mean global and regional difference in consumption of ASF according to parental education in 2018, by age.
One serving of unprocessed red meat = 100 g; total processed meat = 50 g; seafood = 100 g; egg = 55 g; cheese = 42 g; yogurt = 245 g; and milk = 245 g. The absolute differences by parental education were computed at the stratum level and aggregated to the global and regional mean differences, comparing high education (≥12 years) to low education (<6 years).
Fig. 4 ∣
Fig. 4 ∣. Mean global and regional difference in consumption of ASF between urban residence versus rural residence in 2018 by age.
One serving of unprocessed red meat = 100 g; total processed meat = 50 g; seafood = 100 g; egg = 55 g; cheese = 42 g; yogurt = 245 g; and milk = 245 g. The absolute difference by urbanicity was computed as the difference at the stratum level and aggregated to the global and regional mean differences using weighted population proportions.
Fig. 5 ∣
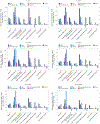
Fig. 5 ∣. Mean global and regional absolute change in consumption of ASF between 1990 and 2018 (servings per week) by age.
1 serving of unprocessed red meat = 100 g; total processed meat = 50 g; seafood = 100 g; egg = 55 g; cheese = 42 g; yogurt = 245 g; milk = 245 g. The absolute difference between 2018 and 1990 was computed as the difference at the stratum level and aggregated to the global and regional mean differences using weighted population proportions.
Fig. 6 ∣
Fig. 6 ∣. Mean national absolute change in consumption of ASF between 1990 and 2018 (servings per week) by age.
The absolute difference between 2018 and 1990 was computed as the difference at the stratum level and aggregated to the global and regional mean differences using weighted population proportions for 2018.

Comment in

References

    1. The State of the World’s Children 2019: Children, Food and Nutrition: Growing Well in a Changing World (UNICEF, 2019); https://www.unicef.org/reports/state-of-worlds-children-2019
    1. Malnutrition Data (UNICEF, WHO & World Bank, 2021); https://data.unicef.org/resources/dataset/malnutrition-data/
    1. Swinburn BA et al. The global syndemic of obesity, undernutrition, and climate change: The Lancet Commission report. Lancet 393, 791–846 (2019). - PubMed
    1. Caulfield LE et al. in Disease Control Priorities in Developing Countries (eds Jamison DT et al.) Ch. 28 (The International Bank for Reconstruction and Development/The World Bank & Oxford Univ. Press, 2006). - PubMed
    1. Global Obesity Observatory (World Obesity, 2022); https://data.worldobesity.org/tables/prevalence-of-child-overweight-incl...

Publication types

LinkOut - more resources