. 2022 Feb;2(2):105-114.
doi: 10.1038/s43587-021-00167-8. Epub 2022 Feb 10.

Intracrine activity involving NAD-dependent circadian steroidogenic activity governs age-associated meibomian gland dysfunction

Affiliations

Intracrine activity involving NAD-dependent circadian steroidogenic activity governs age-associated meibomian gland dysfunction

Lena Sasaki et al. Nat Aging. 2022 Feb.

Abstract

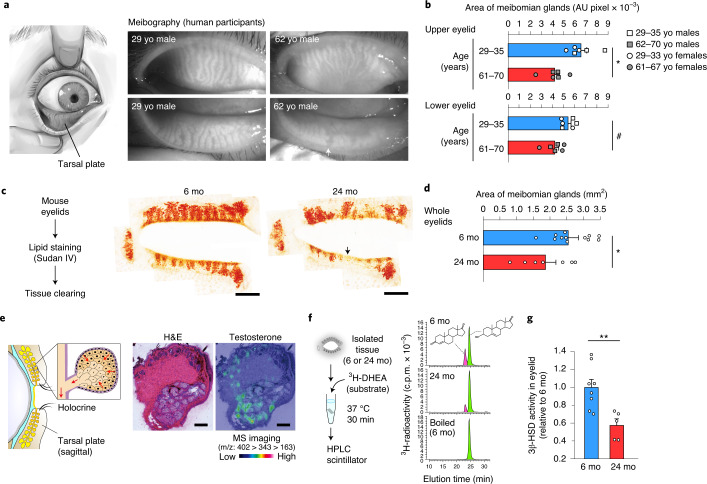
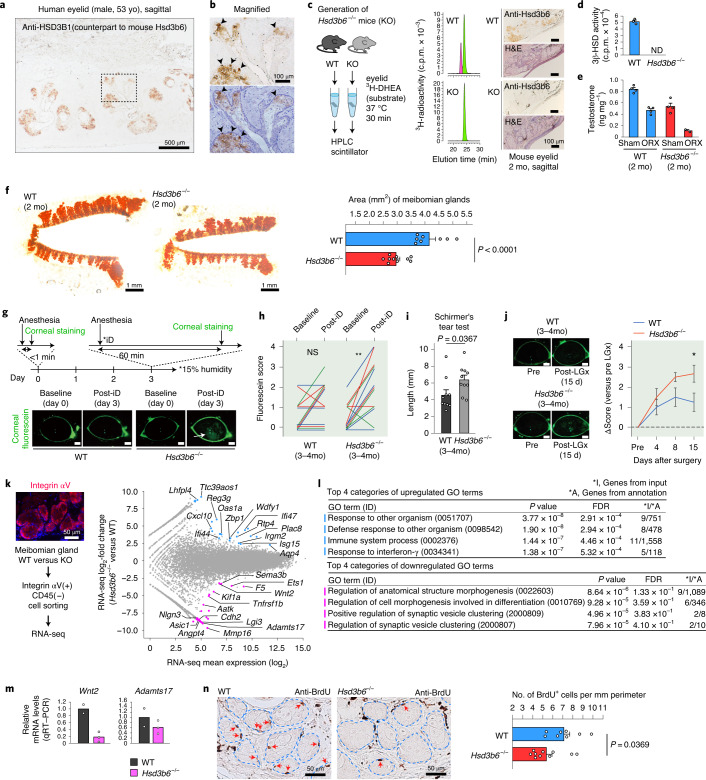
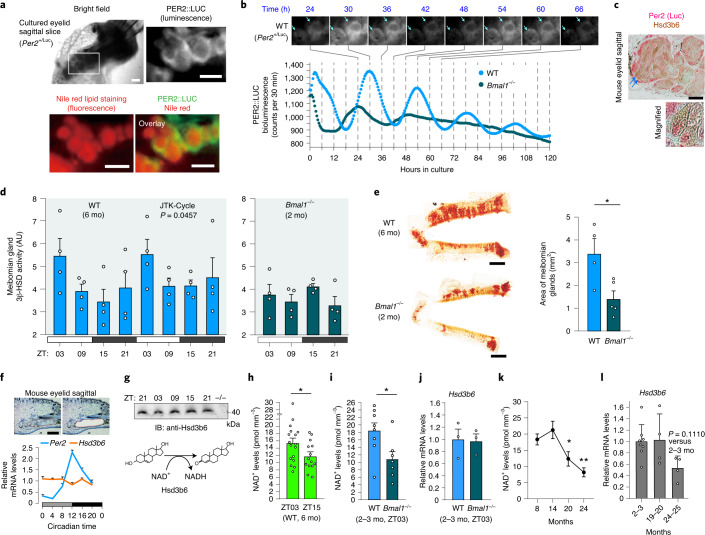
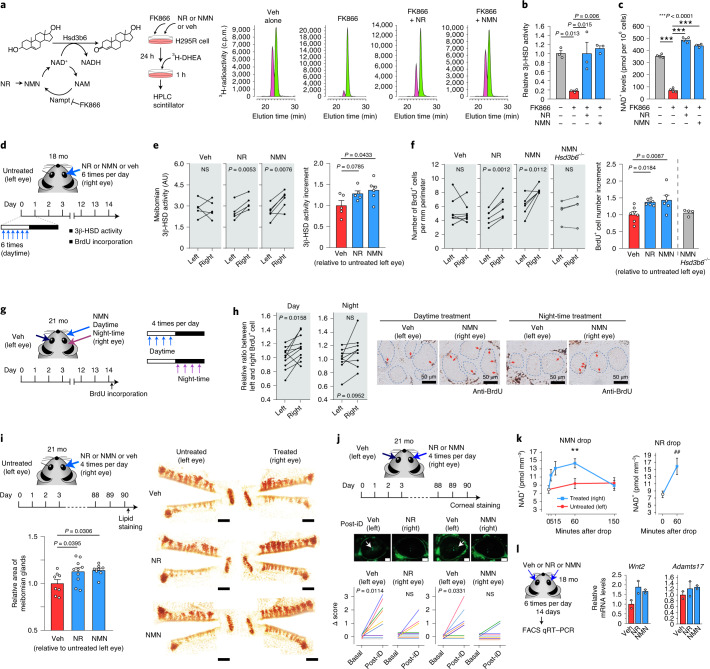
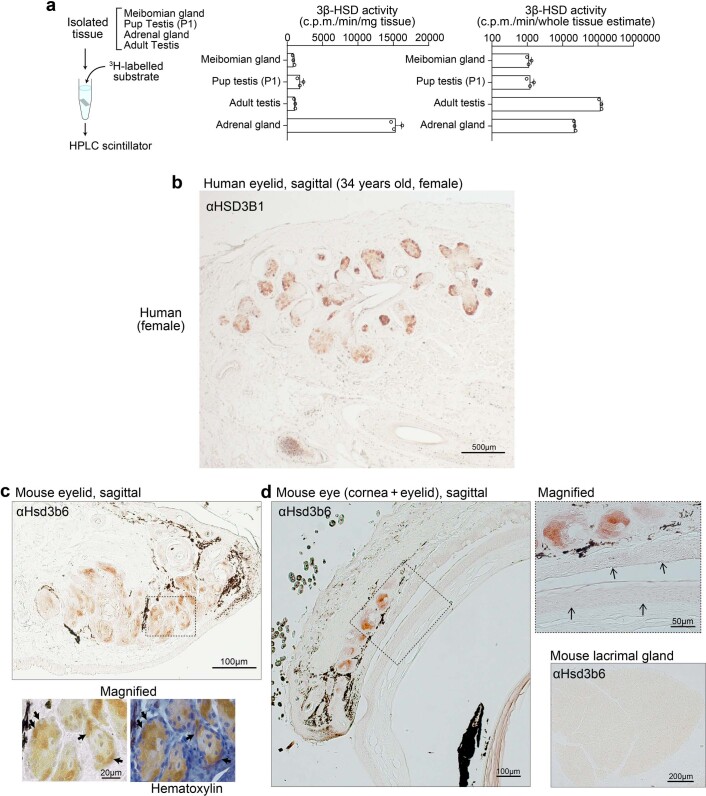
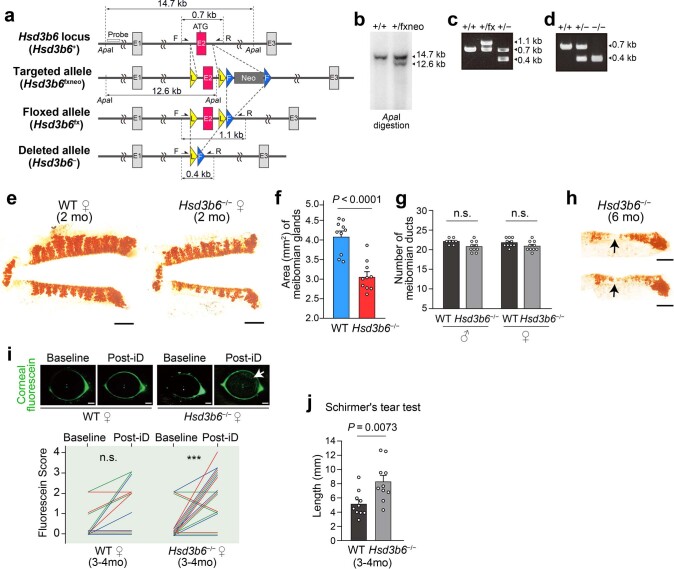
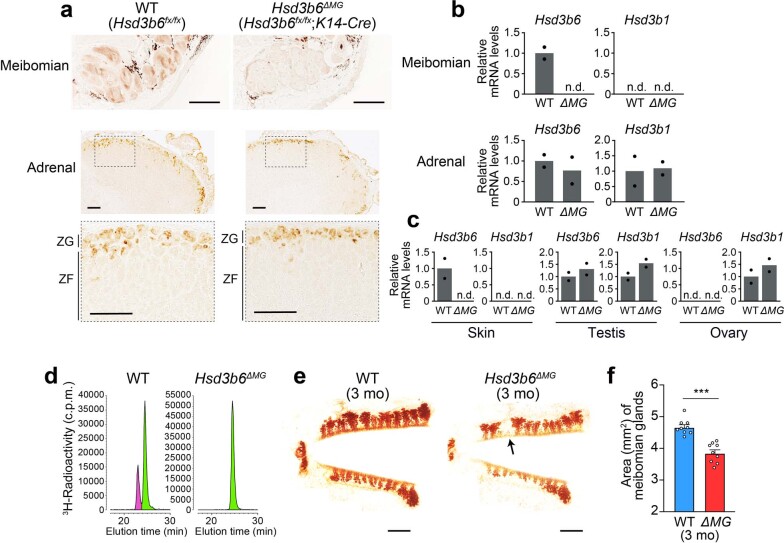
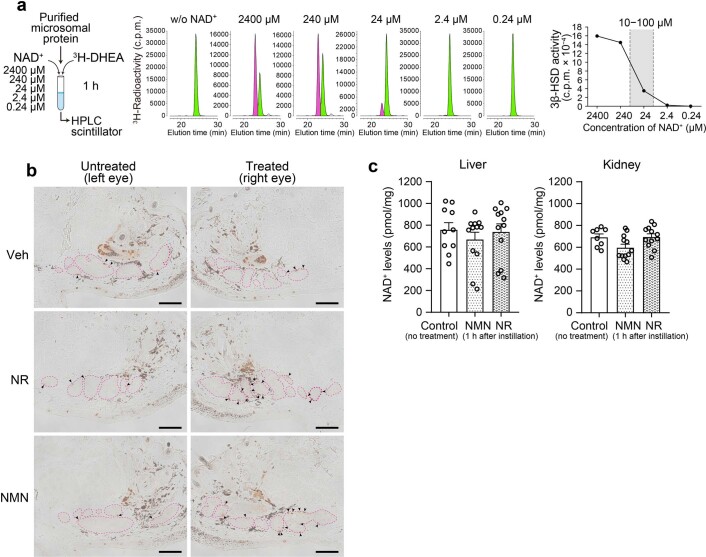
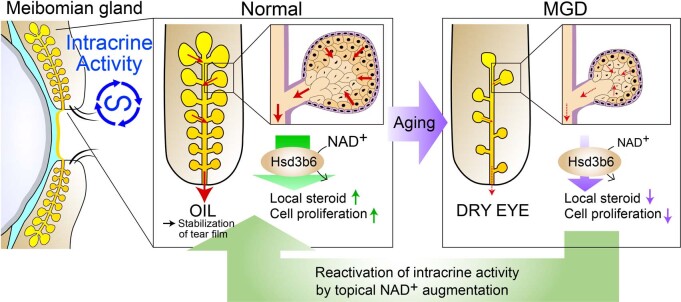
Canonically, hormones are produced in the endocrine organs and delivered to target tissues. However, for steroids, the concept of tissue intracrinology, whereby hormones are produced in the tissues where they exert their effect without release into circulation, has been proposed, but its role in physiology/disease remains unclear. The meibomian glands in the eyelids produce oil to prevent tear evaporation, which reduces with aging. Here, we demonstrate that (re)activation of local intracrine activity through nicotinamide adenine dinucleotide (NAD+)-dependent circadian 3β-hydroxyl-steroid dehydrogenase (3β-HSD) activity ameliorates age-associated meibomian gland dysfunction and accompanying evaporative dry eye disease. Genetic ablation of 3β-HSD nullified local steroidogenesis and led to atrophy of the meibomian gland. Conversely, reactivation of 3β-HSD activity by boosting its coenzyme NAD+ availability improved glandular cell proliferation and alleviated the dry eye disease phenotype. Both women and men express 3β-HSD in the meibomian gland. Enhancing local steroidogenesis may help combat age-associated meibomian gland dysfunction.


Conflict of interest statement

M.D., T.N. and M.M. have filed a patent application related to the new uses of NMN and NR (WO2020262497). M.D., T.S. and S.K. received institutional research funding from Senju Pharmaceutical Co. T.N. and M.M. are employees of Senju Pharmaceutical Co. All other authors declare no competing interests.

Figures

Fig. 1
Fig. 1. Age-associated meibomian gland atrophic changes in humans and mice.
a, Schematic of human eye emphasizing the tarsal plate. Infrared meibography images of upper and lower eyelids of young (29 years) and aged (62 years) men. yo, years old. Arrow indicates area of meibomian gland loss (right). b, Quantification of meibomian gland areas in upper and lower eyelids from nonpathological young (29–35 years; three men, three women) and aged (61–70 years; three men and three women) participants. *P = 0.0043 (top); #P = 0.0165 (bottom). AU, arbitrary unit. c, Outline of whole-mount meibomian gland staining of mouse eyelids. Pictures are representative of mouse upper and lower eyelids at 6 and 24 months of age. mo, months old. Arrow: area of meibomian gland loss. Scale bars, 1 mm. d, Quantification of meibomian gland areas of young (6 months, n = 12) and aged (24 months, n = 7) mice. *P = 0.0213. e, Local testosterone distribution in the meibomian gland using MS. Mouse eyelids were cut in a sagittal plane and counterstained with hematoxylin and eosin (H&E). Scale bar, 200 µm. Data are representative of four biologically independent eyelid samples with similar results. f, Outline of 3β-HSD activity measurements in the meibomian gland. Chromatograms show endogenous 3β-HSD activity arising from the meibomian gland of young (6 months) and aged (24 months) mice. 3β-HSD enzymatic activities were determined by measuring the conversion of 3H-DHEA (green) to 3H-androstenedione (magenta). c.p.m., counts per minute. g, Relative 3β-HSD activity in (f). Plots represent biologically independent samples of young (6 months, n = 8) and aged (24 months, n = 5) mice. **P = 0.0056. Data are the mean ± s.e.m. and were analyzed using unpaired two-sided Student’s t-test (b,d,g).
Fig. 2
Fig. 2. Meibomian gland atrophy and associated EDE in Hsd3b6−/− mice.
a, Human eyelid, immunolabelled for HSD3B1. b, Magnified view of a. Arrowheads, HSD3B1-positive acinar cells. c, Chromatograms showing loss of 3β-HSD activity in Hsd3b6−/− mice. Anti-Hsd3b6 immunohistochemistry−H&E staining of serial sections (right). KO, knockout. d, 3β-HSD activities in c. n = 3 mice for both genotypes. ND, not detectable. e, Meibomian gland tissue testosterone concentrations with or without orchidectomy (ORX). n = 4 mice per group except n = 2 for Hsd3b6−/− ORX. f, Whole-mount meibomian gland staining and quantification of gland area in WT (n = 8) and Hsd3b6−/− (n = 10) mice. g, Schematic of EDE test. Arrow indicates area of the corneal epithelial defect. Scale bars, 0.5 mm. h, Pair-wise comparison of epithelial defect score in g. WT, n = 13; Hsd3b6−/−, n = 13 mice. **P = 0.0025, three-way ANOVA with Sidak test. NS, not significant. i, Measurements of tear quantity. n = 10 mice per genotype. j, Change in fluorescein infiltration score at 4, 8 and 15 d after lacrimal gland excision, relative to previous surgery. WT, n = 8; Hsd3b6−/−, n = 6 mice. Bars, 0.5 mm. *P = 0.0340. k, FACS/RNA-seq data in MA-plot format (n = 2 biologically independent cell pools for both genotypes); significantly upregulated and downregulated transcripts (DESeq2 Padj < 0.1) are colored blue and pink, respectively. l, The top four GO terms of the genes up- or downregulated with Hsd3b6 ablation. P values were calculated by GOrilla. FDR, false discovery rate. m, Quantitative PCR with reverse transcription (qRT–PCR) validation of reduced Wnt2 and Adamts17 mRNA levels in the Hsd3b6−/− meibomian gland. WT, n = 2; Hsd3b6−/−, n = 3 biologically independent cell pools. n, Reduced BrdU incorporation in Hsd3b6−/− mice. Dashed lines indicate meibomian acini. Arrows indicate BrdU+ cells. The graph shows the numbers of BrdU-labeled cells per mm perimeter of the acini. WT, n = 8; Hsd3b6−/−, n = 10 mice. Error bars indicate s.e.m. Immunohistology data in ac,k were reproducibly obtained in four independent experiments. Statistics in f,i,j were two-way analysis of variance (ANOVA) and Bonferroni test; statistical test in n was unpaired, two-sided Student’s t-test.
Fig. 3
Fig. 3. Circadian 3β-HSD enzymatic activity and age-related decline of its coenzyme NAD+ in the meibomian gland.
a, Organotypic eyelid slice from Per2Luc/+ mice and magnified images of PER2::LUC luminescence with Nile red staining. Scale bars, 100 μm. b, Circadian oscillation of PER2::LUC. Arrows indicate representative rhythmic, basal cell layers. Bmal1−/−;Per2Luc/+ eyelid slice failed to keep oscillation. c, Dual immunolabelling of PER2::LUC and Hsd3b6. Arrows indicate representative double-labeled cells. Scale bar, 50 μm. d, Time-of-day-dependent changes in 3β-HSD activity in WT and Bmal1−/− meibomian gland (n = 4 mice per time point). e, Quantification of meibomian gland area in WT (n = 4) and Bmal1−/− (n = 5) mice. *P = 0.0229. f, 24 h mRNA expression of Per2 and Hsd3b6 in laser-microdissected meibomian gland (n = 4 mice per data point). Scale bar, 200 µm. g, 24 h temporal variations in Hsd3b6 protein expression. Immunoreactivities were abolished in Hsd3b6−/− mice. Requirement of NAD+ for dehydrogenase activity of Hsd3b6 (bottom). IB, immunoblot. h, NAD+ levels in the meibomian gland at ZT03 and ZT15. n = 17, ZT03; n = 14, ZT15; biologically independent laser-microdissected tissue samples. *P = 0.0477. i, Meibomian gland NAD+ levels in WT (n = 8) and Bmal1−/− (n = 7) mice. *P = 0.0261. j, Relative mRNA levels of Hsd3b6 in laser-microdissected meibomian gland, normalized to those of Itgav in WT and Bmal1−/− mice. n = 3 mice per group. k, Meibomian NAD+ levels at 8, 14, 20 and 24 mo. n = 8 WT mice per group except n = 7 for 24 mo. *P = 0.0301; **P = 0.0011, versus 14 mo. l, Hsd3b6 mRNA levels at 2–3, 19–20 and 24–25 months of age. n = 8, 2–3 mo; n = 4, 19–20 mo; n = 4, 24–25 mo mouse meibomian glands. Values are presented as mean ± s.e.m. Statistics in k,l were one-way ANOVA and Bonferroni test; statistical test in e,h,i was unpaired, two-sided Student’s t-test. Data presented in ac,g are representative of four biologically independent experiments with similar results.
Fig. 4
Fig. 4. Eye-drops of NAD+ precursors restore 3β-HSD activity and improve meibomian gland function in aged mice.
a, Chromatograms showing NAD+-dependent 3β-HSD enzymatic activity in H295R cells. Veh, vehicle. b, 3β-HSD activities in a. n = 3 biologically independent cell samples for each treatment. c, Intracellular NAD+ levels in a. n = 4 cell samples, except n = 3 for NMN. d, Schematic of eye-drop regimen. Left eye was untreated. e, Meibomian 3β-HSD activities in d. Veh, n = 5; NR, n = 5; NMN, n = 6 mice. f, BrdU+ acinar cells in d. Veh, n = 7; NR, n = 6; NMN, n = 6 mice. For comparison, Hsd3b6−/− mice were treated with NMN (n = 4, 2–3 mo). g, Schematic of daytime versus night-time regimen. h, Relative ratio between left and right eye BrdU+ cells in g. n = 11 (daytime) or 9 (night-time) mice. Arrows indicate BrdU+ acinar cells. i, Meibomian gland morphology after 90-d instillation of Veh, NR or NMN. Scale bars, 1 mm. The graph shows fold increases in gland area relative to that in untreated left eyes. Veh, NMN, n = 8; NR, n = 10 mice. j, EDE test after 90-d instillation. NR, n = 9; NMN, n = 8 mice. Left eye was treated with Veh. Arrows indicate area of the epithelial defect. Scale bars, 0.5 mm. The graphs represent Δscore before and after desiccation (iD). k, Meibomian NAD+ levels after single eye-drop (n = 8 eyes per time point, except n = 7 for 60 min, NMN, right, n = 6 for 150 min, NMN (right) and n = 6 for NMN (left)). **P = 0.0072, two-way ANOVA and Bonferroni test; ##P = 0.0068, unpaired two-sided Student’s t-test. l, Relative mRNA levels of Wnt2 and Adamts17 after 14-d instillation of Veh, NR or NMN. Values are mean ± variance of two biological replicates. Error bars in b,c,e,f,i,k indicate s.e.m. Statistics in b,c,i were one-way ANOVA and Bonferroni test; statistics in e,f (right) were one-way ANOVA and Holm–Sidak test; statistics in e,f (left), h,j were paired, two-sided Student’s t-tests.
Extended Data Fig. 1
Extended Data Fig. 1. Meibomian gland 3β-HSD activity and protein localization.
a, Relative intensity of local 3β-HSD activity of pup testis, adult meibomian gland, testis, and adrenal gland, related to Fig. 1f. Tissues were isolated from 3-month-old male mice except pup testis, which was isolated from P1 newborn mice. 3β-HSD activities were measured as described in Fig. 1f. Data are the mean ± SEM (n = 3 biologically independent animals for all groups). b, c, Immunolocalization of the meibomian-specific 3β-HSD enzyme in human and mouse, related to Fig. 2a-c.b, A human female eyelid section, immunolabeled for HSD3B1. Bar, 500 µm. Similar results were obtained from three independent experiments. c, Immunolocalization of Hsd3b6 in the mouse eyelid. A dotted box indicates the area of high magnification view. Arrows, Hsd3b6-immunopositive acinar cells in the meibomian gland, before and after hematoxylin counterstaining. d, Anti-Hsd3b6 immunostaining of mouse corneal plus eyelid section and extraorbital lacrimal gland section. Note that little or no appreciable Hsd3b6 immunopositive staining was observed in the cornea, lacrimal gland, or conjunctiva. Scale bars are shown on the images. Immunohistology data in bd were reproducibly observed in three independent experiments.
Extended Data Fig. 2
Extended Data Fig. 2. Generation of Hsd3b6−/− mice and phenotypic analysis of the meibomian gland function with the female mice, related to Fig. 2c-i.
a, Schematic structure of the wild-type (Hsd3b6+), targeted (Hsd3b6fxneo), floxed (Hsd3b6fx) and deleted (Hsd3b6) allele of the mouse type IV 3β-HSD encoding gene. The second exon of the gene, which contains the initiation codon (ATG), was flanked with loxP sites. b, Southern blot of ApaI-digested DNA from Hsd3b6+/+ and Hsd3b6+/fxneo mice in (a). c, d, Genotyping PCRs. Amplified DNA fragments from Hsd3b6+ (0.7 kb), Hsd3b6fx (1.1 kb), and Hsd3b6 (0.4 kb) alleles are indicated. e, Whole-mount meibomian gland staining of WT and Hsd3b6−/− female mice. Bars, 1 mm. f, Quantification of the meibomian gland area in (e) (2 mo, n = 10 mice per genotype). Male data are shown in Fig. 2f. g, The number of meibomian gland ducts. n = 8, WT male; n = 10, Hsd3b6−/− male; n = 10, WT female; n = 10, Hsd3b6−/− female mice. h, Representative area of gland drop-out of 6-mo Hsd3b6−/− mouse lower eyelids (n = 2 mice). i, Evaporative dry-eye test for female mice. Photos show representative images of corneal fluorescein staining before and after desiccation (iD). Bars, 0.5 mm. Arrow indicates the area of the epithelial defect. The graphs represent pair-wise comparison of corneal fluorescein staining scores before and after iD of WT and Hsd3b6−/− female mice (3-4 mo, n = 12, WT; n = 18, Hsd3b6−/−). Male data are shown in Fig. 2h. ***P = 0.0006. j, Schimer’s tear test of WT and Hsd3b6−/− female mice (n = 10, for each genotype). Male data are available in Fig. 2i. Error bars indicate SEM. Statistics in f-g and j: two-way ANOVA, Bonferroni test. Gel images shown in b-d are representative of three independent experiments with similar results. Data in h were reproducibly observed in four independent animals. n.s., not significant. mo, months old.
Extended Data Fig. 3
Extended Data Fig. 3. The loss of tissue-specific Hsd3b6 activity of conditional Hsd3b6ΔMG mice causes atrophy of the meibomian gland.
a, Immunohistological validation of Hsd3b6 protein expression in the meibomian gland and adrenal gland of WT (Hsd3b6fx/fx) and Hsd3b6ΔMG (Hsd3b6fx/fx;K14-Cre) mice. ZG, zona glomerulosa. ZF, zona fasciculata. Scale bars, 100 µm. Data are representative of three independent mice with similar results. b, The mRNA levels of Hsd3b6 and Hsd3b1 in the meibomian gland and adrenal gland of WT and Hsd3b6ΔMG mice (n = 2 biologically independent samples, for each tissue). n.d., not detectable. c, The mRNA levels of Hsd3b6 and Hsd3b1 in the skin, testis, and ovary of WT and Hsd3b6ΔMG mice (n = 2 biologically independent samples, for each tissue). Male mice were used for analysis except for the ovary. Values were determined by qRT-PCR and normalized to those of ribosomal protein large P0 gene. n.d., not detectable. d, Chromatograms showing the loss of local 3β-HSD activity in the meibomian gland of Hsd3b6ΔMG mice. 3β-HSD enzymatic activities in WT and Hsd3b6ΔMG eyelids were determined by measuring the conversion of 3H-DHEA (green) to 3H-androstendione (magenta). e, Representative images of whole-mount meibomian gland staining of upper and lower eyelids of WT and Hsd3b6ΔMG mice. mo, months old. Arrow indicates the area of gland dropout. Scale bars, 1 mm. f, Quantification of the area of the meibomian glands of WT and Hsd3b6ΔMG mice (n = 9 mice for each genotype, 3 mo). ***P < 0.0001, unpaired two-sided t-test. All values are presented as mean ± SEM.
Extended Data Fig. 4
Extended Data Fig. 4. Effects of NAD+ augmentation in vitro and in vivo, related Fig. 4a,f,k.
a, 3β-HSD cofactor kinetics. Purified microsomal protein fraction from the meibomian gland was incubated in vitro with different doses of NAD+. Chromatograms show NAD+ concentration-dependent 3β-HSD enzymatic activity. 3β-HSD activities were assessed as described in Fig. 1f. A drastic change in 3β-HSD activity was observed in a physiological range of intracellular NAD+ variation in mammalian cells (~10–100 µM). b, Representative immunohistochemistry images for BrdU incorporation assays shown in Fig. 4f. Dashed lines: meibomian gland acini. Arrowheads; representative BrdU-immunolabeled cells. Scale bars, 100 µm. Data are representative of mice independently treated with Veh (n = 7), NR (n = 6), or NMN (n = 6). mo, months old. c, NAD+ levels in the liver and kidney 1 h after single eye drop administration of NMN and NR, related to Fig. 4k. 18-month-old mice were used. Mice received 5 μL of 5% NMN or NR-containing phosphate buffered saline to the right eye. Data were normalized to tissue weight. Error bars show SEM; n = 12 mice per group, except n = 10 for liver control and n = 8 kidney control.
Extended Data Fig. 5
Extended Data Fig. 5. Schematic representation of the potential therapeutic utility of reactivation of local intracrine activity for treatment of age-associated MGD.
Normal 3β-HSD activity ensures the high turnover rate required by the meibomian gland to sustain its homeostasis. Aging attenuates meibomian NAD+-dependent steroidogenic activity, leading to MGD and MGD-associated dry eye disease. NAD+ precursor instillation on eyes restores NAD+-dependent enzymatic activity of 3β-HSD, which in turn recovers meibomian gland acinar cell proliferation and mitigates MGD. Hsd3b6 and its human counterpart HSD3B1 are the isozyme responsible for the meibomian gland tissue local 3β-HSD activity.

Comment in

References

    1. Labrie F. Intracrinology. Mol. Cell. Endocrinol. 1991;78:C113–C118. doi: 10.1016/0303-7207(91)90116-A. - DOI - PubMed
    1. Labrie F, Martel C, Belanger A, Pelletier G. Androgens in women are essentially made from DHEA in each peripheral tissue according to intracrinology. J. Steroid Biochem. Mol. Biol. 2017;168:9–18. doi: 10.1016/j.jsbmb.2016.12.007. - DOI - PubMed
    1. Bron AJ, et al. TFOS DEWS II pathophysiology report. Ocul. Surf. 2017;15:438–510. doi: 10.1016/j.jtos.2017.05.011. - DOI - PubMed
    1. Knop E, Knop N, Millar T, Obata H, Sullivan DA. The international workshop on meibomian gland dysfunction: report of the subcommittee on anatomy, physiology, and pathophysiology of the meibomian gland. Invest. Ophthalmol. Vis. Sci. 2011;52:1938–1978. doi: 10.1167/iovs.10-6997c. - DOI - PMC - PubMed
    1. Jones L, et al. TFOS DEWS II management and therapy report. Ocul. Surf. 2017;15:575–628. doi: 10.1016/j.jtos.2017.05.006. - DOI - PubMed

Publication types