. 2022 Jul;2(7):616-634.
doi: 10.1038/s43587-022-00241-9. Epub 2022 Jul 15.

An IL1RL1 genetic variant lowers soluble ST2 levels and the risk effects of APOE-ε4 in female patients with Alzheimer's disease

Collaborators, Affiliations

An IL1RL1 genetic variant lowers soluble ST2 levels and the risk effects of APOE-ε4 in female patients with Alzheimer's disease

Yuanbing Jiang et al. Nat Aging. 2022 Jul.

Abstract

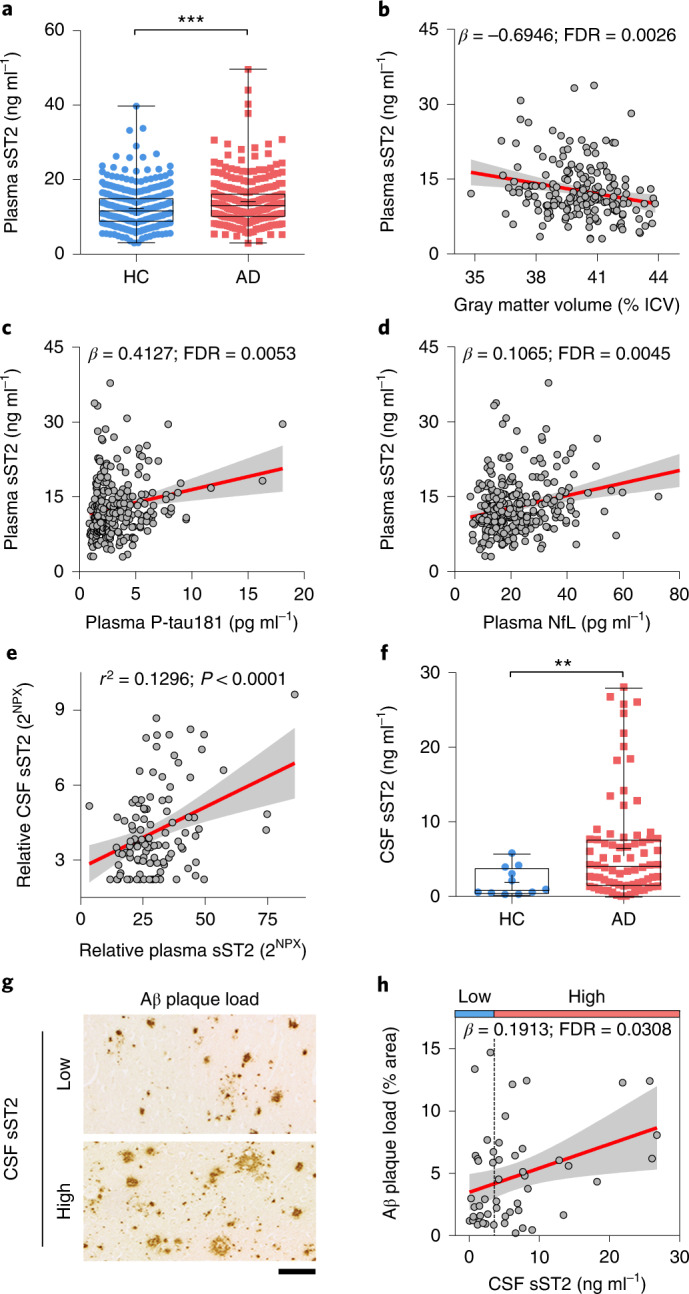
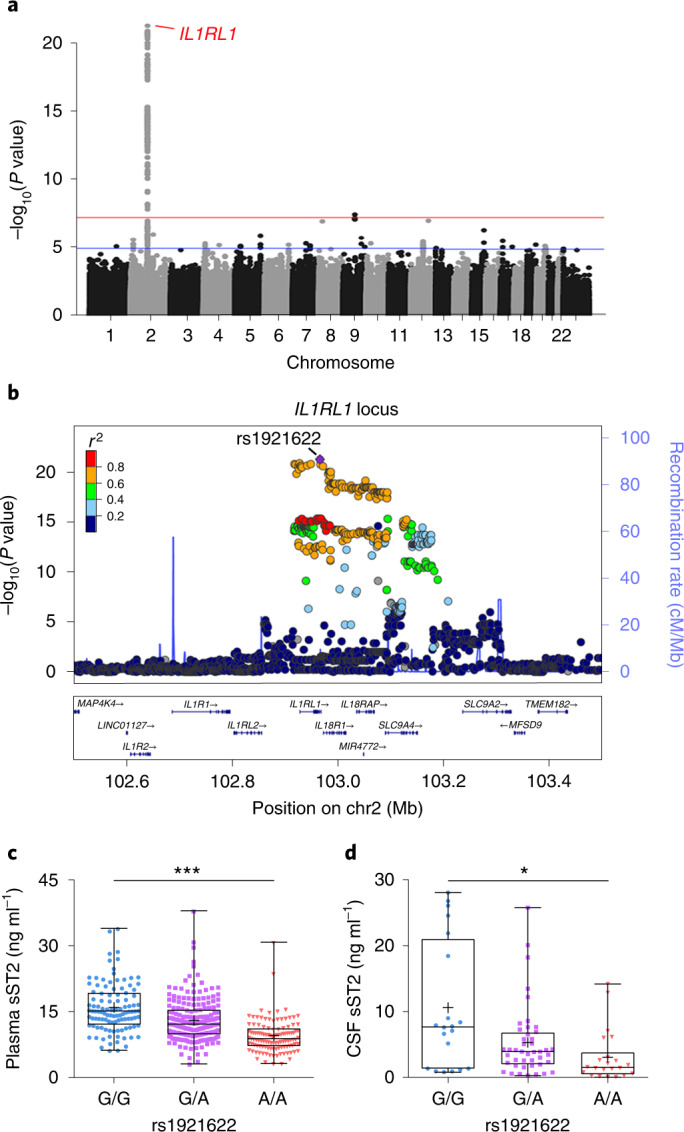
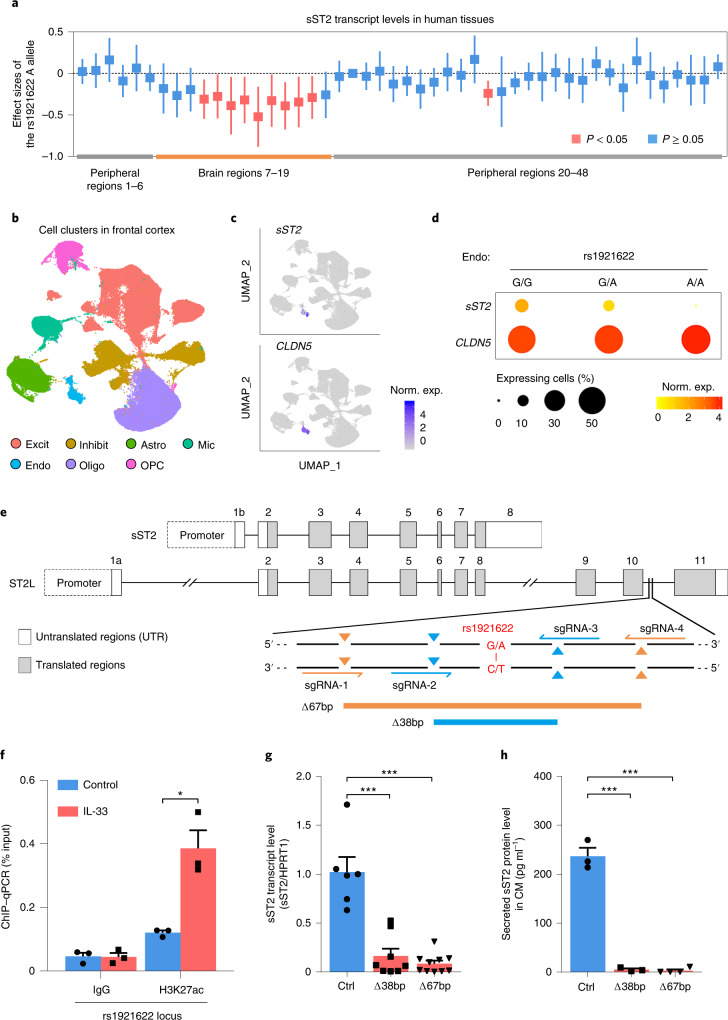
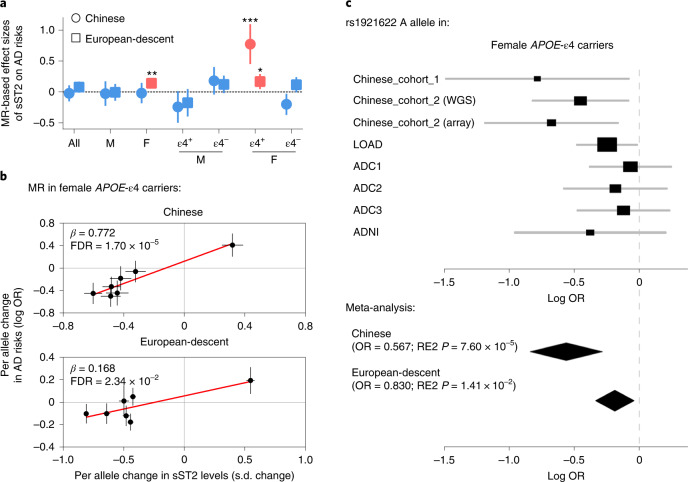
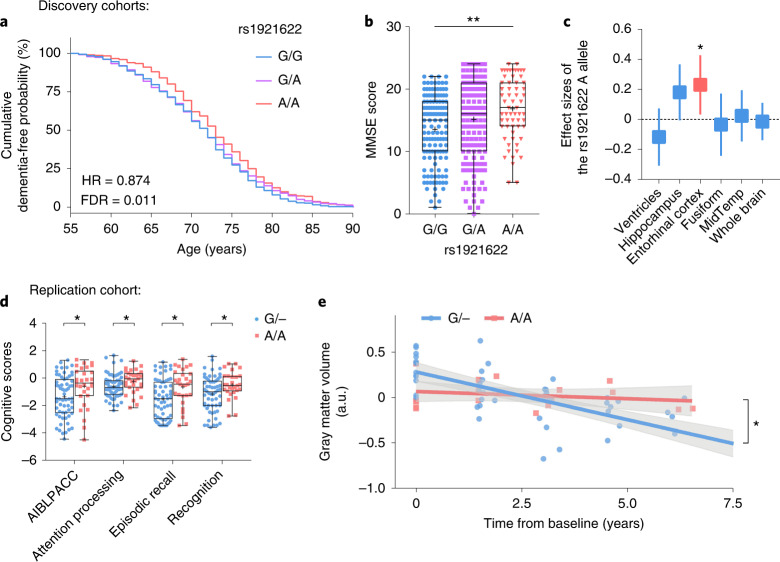
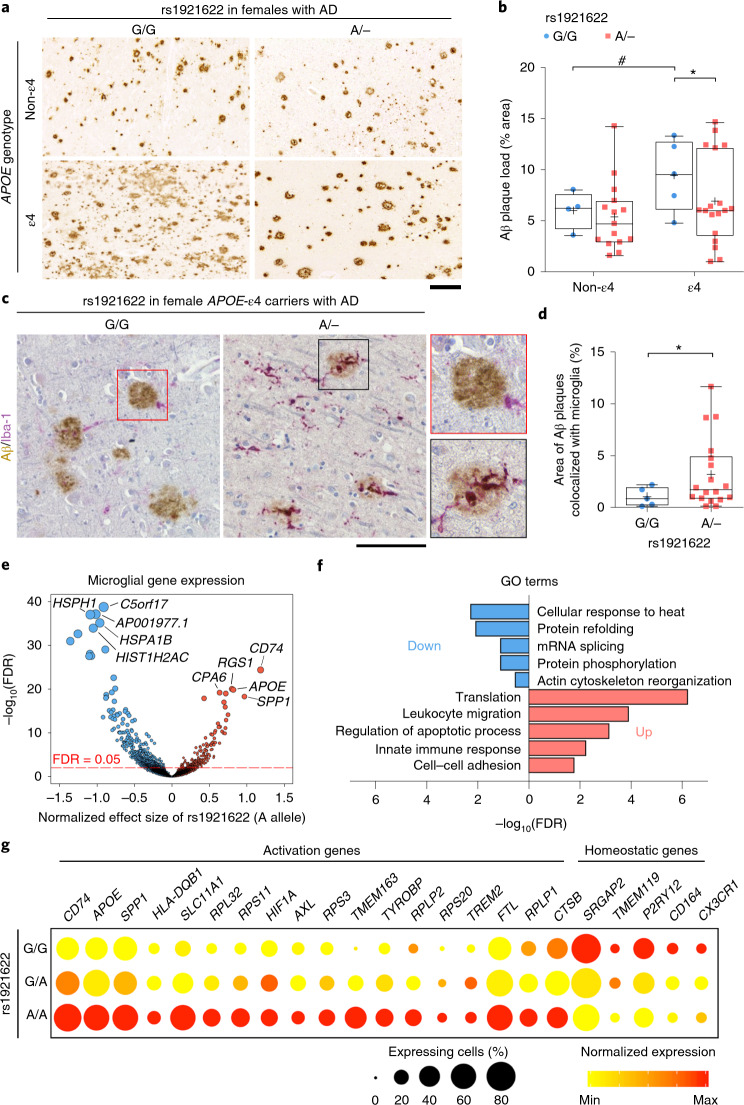
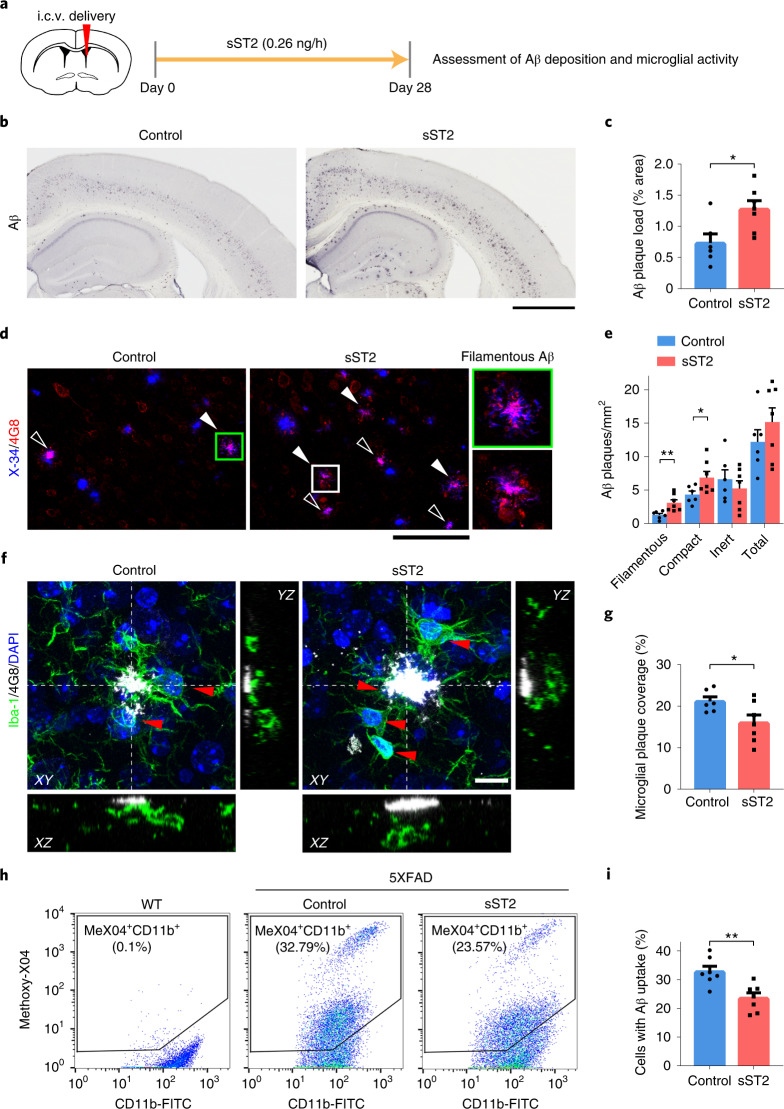
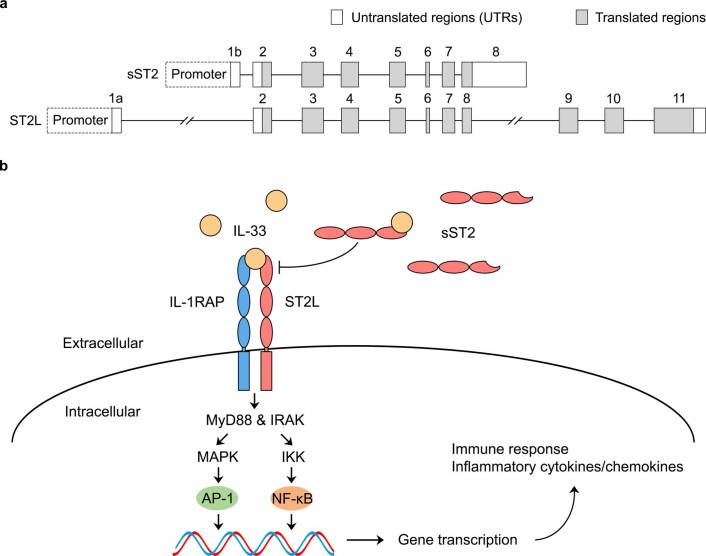
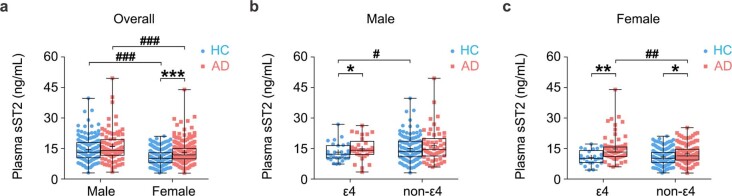
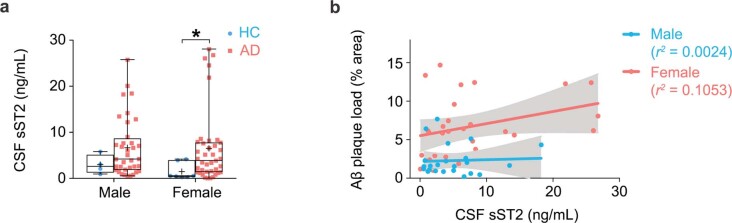
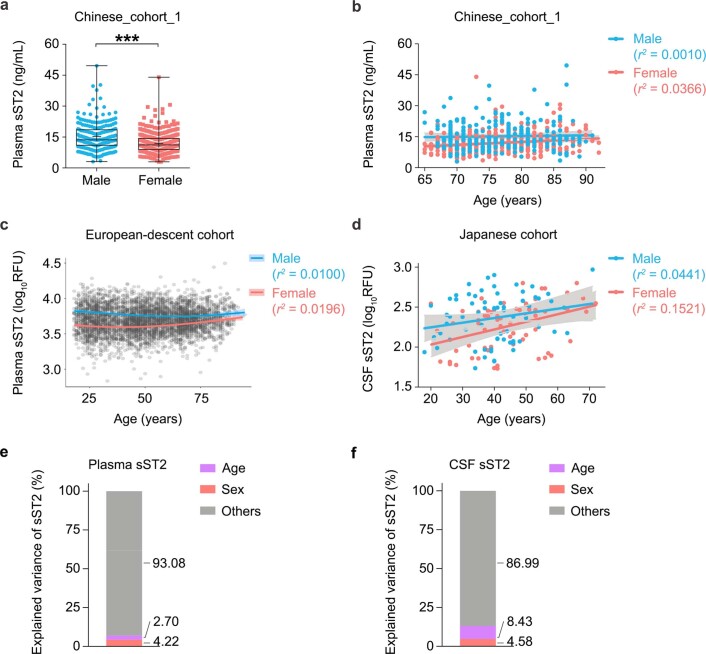
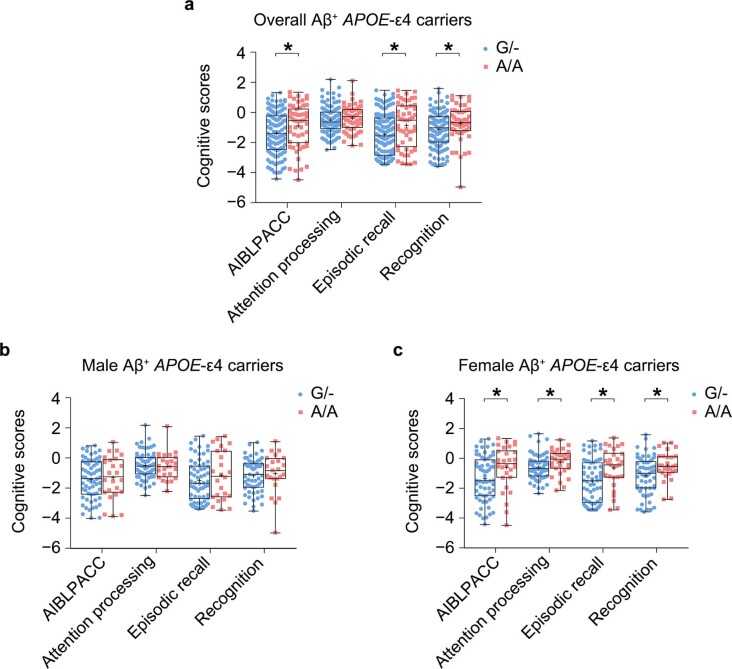
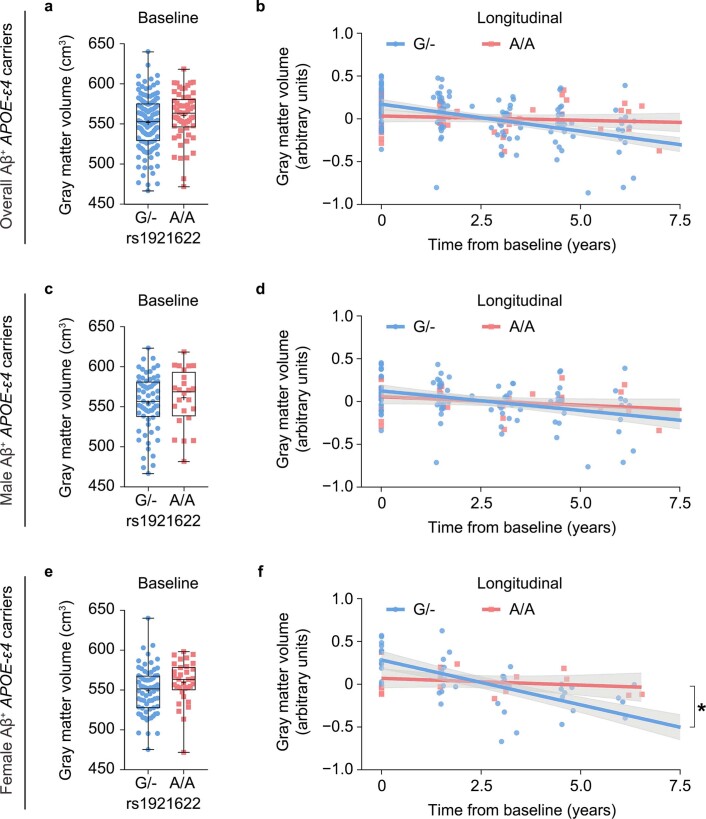
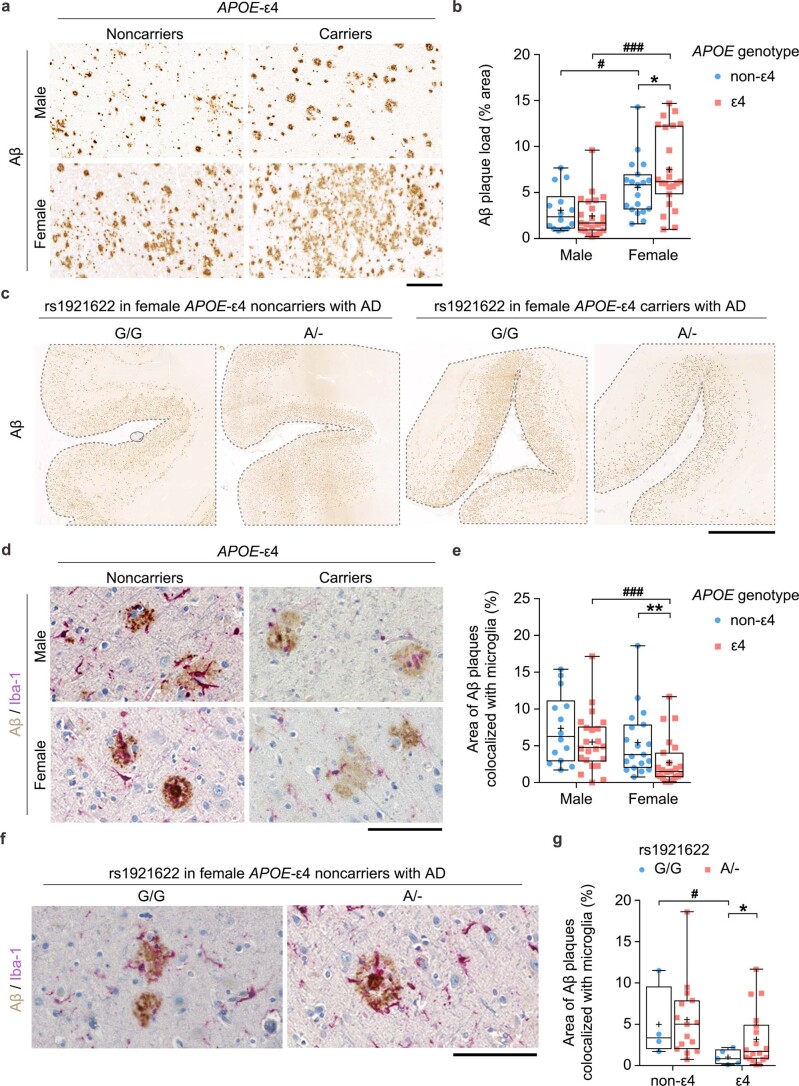
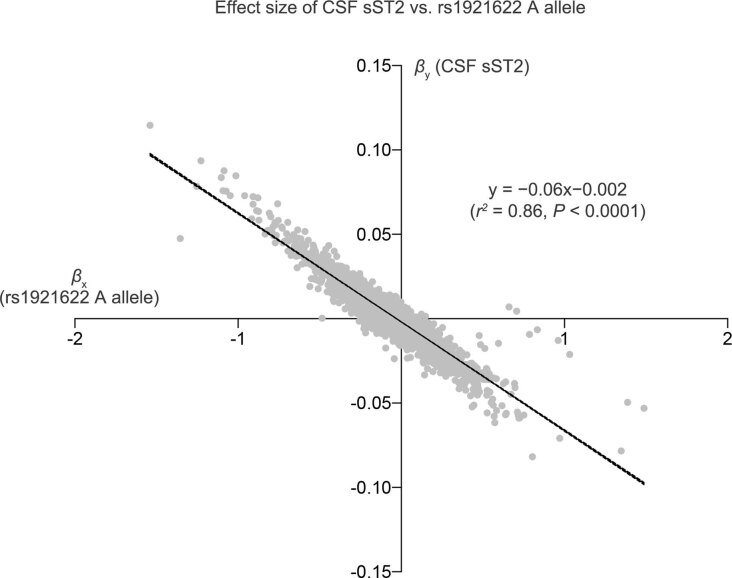
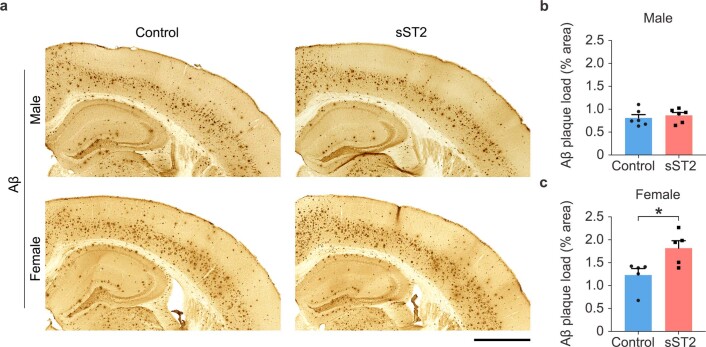
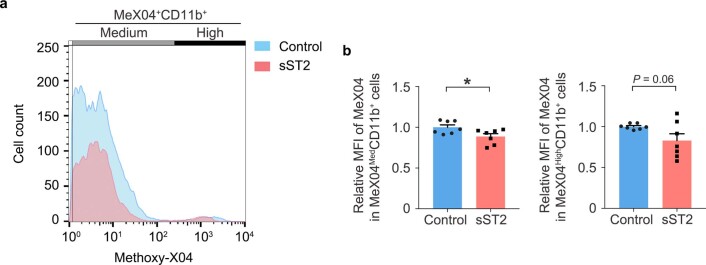
Changes in the levels of circulating proteins are associated with Alzheimer's disease (AD), whereas their pathogenic roles in AD are unclear. Here, we identified soluble ST2 (sST2), a decoy receptor of interleukin-33-ST2 signaling, as a new disease-causing factor in AD. Increased circulating sST2 level is associated with more severe pathological changes in female individuals with AD. Genome-wide association analysis and CRISPR-Cas9 genome editing identified rs1921622 , a genetic variant in an enhancer element of IL1RL1, which downregulates gene and protein levels of sST2. Mendelian randomization analysis using genetic variants, including rs1921622 , demonstrated that decreased sST2 levels lower AD risk and related endophenotypes in females carrying the Apolipoprotein E (APOE)-ε4 genotype; the association is stronger in Chinese than in European-descent populations. Human and mouse transcriptome and immunohistochemical studies showed that rs1921622 /sST2 regulates amyloid-beta (Aβ) pathology through the modulation of microglial activation and Aβ clearance. These findings demonstrate how sST2 level is modulated by a genetic variation and plays a disease-causing role in females with AD.


Conflict of interest statement

All authors declare no competing interests.

Figures

Fig. 1
Fig. 1. Soluble ST2 levels are associated with Alzheimer’s disease and its pathological changes.
a, Individual plasma sST2 levels stratified by disease phenotype (n = 336 HCs, n = 277 individuals with AD; Chinese_cohort_1). β = 2.072. bd, Associations between plasma sST2 level and AD-associated endophenotypes in Chinese_cohort_1. b, The intracranial volume (ICV)-normalized gray matter volume (n = 192). c, plasma P-tau181 levels (n = 290). d, plasma NfL levels (n = 289). e, Correlation between CSF and plasma levels of sST2 (n = 66 HCs, n = 23 individuals with MCI, and n = 18 individuals with AD; ADRC cohort). Linear regression test, adjusted for age, sex and disease diagnosis. β = 0.049; r2, Pearson’s correlation coefficient. 2NPX, linear form of normalized protein expression level. f, Individual CSF sST2 levels stratified by disease phenotype (n = 11 HCs, n = 75 individuals with AD; UKBBN cohort). β = 6.605. g,h, Associations between Aβ staining in the postmortem frontal cortex and CSF sST2 levels in individuals with AD (n = 51 individuals; UKBBN cohort). Individuals were stratified into two groups according to CSF sST2 levels: low, ≤3.6 ng ml−1; high, >3.6 ng ml−1. The vertical dashed line in h indicates the CSF sST2 level (3.6 ng ml−1) with the largest Youden’s index value for distinguishing HCs from individuals with AD. Representative images of Aβ staining in individuals with AD who had low and high CSF sST2 levels (g) and association analysis results (h). Scale bar, 100 μm. Data in box-and-whisker plots are presented with maximum, 75th percentile, median, 25th percentile and minimum values; plus signs denote mean values; data in regression lines are presented as the slope (red) and 95% confidence intervals (CIs; gray). Statistical tests for plasma sST2 were performed by linear regression analysis, adjusted for age, sex, CVD status, BMI and education level, with multiple testing correction. Statistical tests for CSF sST2 were performed by linear regression analysis, adjusted for age, sex and PMD, with multiple testing correction. *FDR < 0.05, **FDR < 0.01, ***FDR < 0.001.
Fig. 2
Fig. 2. The rs1921622 A allele is associated with lower soluble ST2 level.
a, Manhattan plot showing genetic variants at the IL1RL1 locus that are associated with plasma sST2 level, as identified by a GWAS of plasma sST2 levels in Chinese_cohort_1. Horizontal lines indicate the suggestive threshold (P = 1 × 10−5, blue) and genome-wide threshold (P = 5 × 10−8, red). Linear regression test, adjusted for age, sex, AD diagnosis and population structure. b, Regional association plot of genetic variants at the IL1RL1 locus and plasma sST2 level. The purple diamond indicates the sentinel variant rs1921622. The color scale indicates the linkage disequilibrium (LD; measured as r2) between rs1921622 and its neighboring variants. c,d, Plasma (c) and CSF (d) sST2 levels in individuals stratified by rs1921622 genotype. Measurement of plasma sST2 level (n = 107, 206 and 114 G/G, G/A and A/A carriers, respectively; Chinese_cohort_1). Linear regression test, adjusted for age, sex, AD diagnosis and population structure; β = −3.346, P = 5.35 × 10−22. Measurement of CSF sST2 level (n = 20, 44 and 22 G/G, G/A and A/A carriers, respectively; UKBBN cohort). Linear regression test, adjusted for age, sex, AD diagnosis and PMD; β = −2.244, P = 1.06 × 10−2. Data in box-and-whisker plots include maximum, 75th percentile, median, 25th percentile and minimum values; plus signs denote corresponding mean values. *P < 0.05, **P < 0.01, ***P < 0.001. Source data
Fig. 3
Fig. 3. Target deletion at rs1921622 decreases soluble ST2 expression and secretion in brain endothelial cells.
a, Effects of rs1921622 on sST2 transcript levels in human tissues. Boxes and lines indicate the effect size and 95% CIs of the rs1921622 A allele for each tissue, respectively (Supplementary Table 4). Red and blue indicate significant (P < 0.05) and nonsignificant (P ≥ 0.05) associations, respectively. Linear regression test, adjusted for age, sex, RNA integrity and population structure. bd, snRNA-seq analysis revealed an association between rs1921622 and sST2 transcript level in brain endothelial cells. b, Uniform manifold approximation and projection (UMAP) plot showing cell types in the human frontal cortex (n = 169,496 cells from 21 individuals; UKBBN cohort). Excit, excitatory neurons; Inhibit, inhibitory neurons; Astro, astrocytes; Mic, microglia; Endo, endothelial cells; Oligo, oligodendrocytes; OPCs, oligodendrocyte progenitor cells. c,d, Expression profiles (c) and dot plots (d) of sST2 and CLDN5 transcripts in the endothelial cells, stratified by rs1921622 genotype. Norm. exp., normalized expression. e, CRISPR–Cas9 genome-editing strategy and locations of the two single-guide RNA (sgRNA) pairs for 67-bp deletion (Δ67 bp) and 38-bp deletion (Δ38 bp) targeting the rs1921622-harboring region (red). f, H3K27ac analysis of the rs1921622 locus in hCMEC/D3 cells after IL-33 administration for 24 h (n = 3 per group). T = 4.593, P = 1.01 × 10−2. g,h, Deletion of the rs1921622 locus decreases transcript level and protein secretion of sST2 in hCMEC/D3 cells. g, sST2 transcript levels (n = 6, 8 and 10 clones for isogenic control, Δ38 bp and Δ67 bp, respectively). For Δ38 bp versus control, T = − 5.444, P = 1.00 × 10−4; Δ67 bp versus control, T = − 7.612, P < 1.00 × 10−4. h, Levels of sST2 protein in conditioned medium (CM; n = 3, 3 and 4 clones for isogenic control, Δ38 bp and Δ67 bp, respectively). For Δ38 bp versus control: T = −13.450, P = 2.00 × 10−4; Δ67 bp versus control: T = −16.030, P < 1.00 × 10−4. Data in bar charts are the mean + s.e.m. Statistical tests for fh were performed as two-sided unpaired Student’s t-tests. *P < 0.05, **P < 0.01, ***P < 0.001.
Fig. 4
Fig. 4. The rs1921622 A allele is associated with decreased Alzheimer’s disease risk in female APOE-ε4 carriers.
a, Two-sample MR analysis showing the effects of sST2 levels on AD risk in Chinese (circle) and European-descent (box) populations. Circles/boxes and lines indicate the effect sizes of sST2 and 95% CIs in each subgroup, respectively (Supplementary Table 6). Red and blue indicate significant (FDR < 0.05) and nonsignificant (FDR ≥ 0.05) associations, respectively. All, overall population; M, male; F, female; ε4+, APOE-ε4 carriers; ε4, APOE-ε4 noncarriers. b, Two-sample MR analysis showing the associations between sST2 level and AD risk in female APOE-ε4 carriers in Chinese and European-descent populations. Circles and lines indicate the effect sizes and standard errors of each SNP, respectively. c, Forest plot showing the meta-analysis results of the rs1921622 A allele on AD risk in female APOE-ε4 carriers (n = 912 HCs, n = 1,898 individuals with AD). Rectangles and diamonds denote the effect sizes (log OR) obtained from independent datasets and meta-analysis, respectively. For the independent datasets, horizontal lines indicate 95% CIs, and rectangle size is proportional to the weight used in the meta-analysis. RE2 P, meta-analysis P value using Han and Eskin’s random-effects model. *FDR < 0.05, **FDR < 0.01, ***FDR < 0.001.
Fig. 5
Fig. 5. The rs1921622 A allele is associated with changes of Alzheimer’s disease-related endophenotypes in female APOE-ε4 carriers.
a, Cumulative dementia-free probability in female APOE-ε4 carriers with AD stratified by rs1921622 genotype (n = 314, 568 and 300 G/G, G/A and A/A carriers, respectively; LOAD and ADC1–3 cohorts). Cox regression test, adjusted for population structure, with multiple testing correction. b, Individual Mini-Mental State Exam (MMSE) scores of female APOE-ε4 carriers with AD stratified by rs1921622 genotype (n = 131, 158 and 61 G/G, G/A and A/A carriers, respectively; Chinese_cohort_2). Linear regression test, adjusted for age and population structure, with multiple testing correction. β = 1.622. c, Effect size of the rs1921622 A allele on brain region volume in female APOE-ε4 carriers with cognitive impairment (n = 38, 86 and 57 G/G, G/A and A/A carriers, respectively; ADNI cohort). Linear regression test, adjusted for age, ICV, magnetic resonance imaging (MRI) platforms, dementia stages and population structure, with multiple testing correction. Data are presented as effect sizes (boxes) and 95% CIs (lines). Red and blue indicate significant (FDR < 0.05) and nonsignificant (FDR ≥ 0.05) associations, respectively. Fusiform, fusiform gyrus; MidTemp, middle temporal gyrus. d, Individual cognitive scores in female Aβ+ APOE-ε4 carriers stratified by rs1921622 genotype (n = 59 G carriers (G/−), n = 29 A/A carriers; AIBL cohort). Wilcoxon rank-sum test, with multiple testing correction. W = 1087.0, 1115.5, 1083.0 and 916.5 for AIBLPACC, attention processing, episodic recall and recognition scores, respectively. e, Longitudinal gray matter volume in female Aβ+ APOE-ε4 carriers stratified by rs1921622 genotype (n = 50 and 19 data points from 12 G carriers (G/−) and 5 A/A carriers, respectively; AIBL cohort). Linear mixed model test; adjusted for baseline age and MRI scanners, with multiple testing correction. β = −0.159 (G/−) and −0.027 (A/A); F = 8.804. Data in box-and-whisker plots are presented with maximum, 75th percentile, median, 25th percentile and minimum values; plus signs denote mean values; data in regression lines are presented as the slope (red/blue) and 95% CIs (gray). *FDR < 0.05, **FDR < 0.01, ***FDR < 0.001. a.u., arbitrary units.
Fig. 6
Fig. 6. The rs1921622 A allele enhances microglial activities toward Aβ in female APOE-ε4 carriers with Alzheimer’s disease.
a,b, Representative images (a) and quantification (b) showing Aβ plaque area in the frontal cortices of females with AD stratified by APOE-ε4 and rs1921622 genotypes (n = 4 G/G carriers and 15 A carriers (A/−) among APOE-ε4 noncarriers (non-ε4); n = 5 G/G carriers and 18 A/− carriers among APOE-ε4 carriers (ε4); UKBBN cohort). Test for effects of APOE-ε4: β = 3.448 (G/G) and 1.549 (A/−), P = 4.83 × 10−2 (G/G) and 2.54 × 10−1 (A/−); test for effects of rs1921622, β = 0.288 (non-ε4) and −2.262 (ε4), P = 7.02 × 101 (non-ε4) and 3.71 × 102 (ε4). Scale bar, 200 μm. c,d, Representative images (c) and quantification (d) showing colocalization between Aβ plaques (brown) and Iba-1+ microglia (purple) in the frontal cortices of female APOE-ε4 carriers with AD stratified by rs1921622 genotype (n = 5 G/G carriers, n = 18 A/− carriers; UKBBN cohort). β = 2.017, P = 2.53 × 10−2. Scale bar, 100 μm. e, Volcano plot showing the associations between rs1921622 and microglial genes in the frontal cortices of female APOE-ε4 carriers with AD (n = 2,636 microglia of eight individuals; UKBBN cohort). Blue and red dots indicate microglial genes that were negatively and positively associated with the rs1921622 A allele, respectively. Dot size is proportional to FDR (log10 scale). The top five negatively and positively associated genes are labeled. f, Representative GO terms enriched in the rs1921622-associated microglial genes. Blue and red indicate GO terms enriched for the downregulated and upregulated genes, respectively, in rs1921622 A allele carriers. g, Dot plot showing the expression levels of microglial activation genes and homeostatic genes stratified by rs1921622 genotype. Data in box-and-whisker plots are presented with maximum, 75th percentile, median, 25th percentile and minimum values; plus signs denote mean values. Statistical tests were performed by linear regression analysis, adjusted for age and PMD. *P < 0.05, **P < 0.01, ***P < 0.001; #P < 0.05, ##P < 0.01, ###P < 0.001. Source data
Fig. 7
Fig. 7. Increased brain soluble ST2 levels exacerbate Aβ accumulation and impair microglial Aβ clearance in female 5XFAD mice.
a, Intracerebroventricular (i.c.v.) delivery of sST2 to 3-month-old 5XFAD mice. be, Aβ deposition in the cortices of 4-month-old female 5XFAD mice after i.c.v. delivery of sST2-Fc or Fc as a control. b,c, Representative images (b) and quantification (c) of Aβ plaques (percentage of total cortical area; control n = 6 mice, sST2 n = 7 mice). T = 2.758, P = 1.86 × 10−2. Scale bar, 1 mm. d, Confocal images of X-34-stained (blue) and 4G8-labeled (red) Aβ. Filamentous (filled arrowheads) and compact (hollow arrowheads) Aβ plaques. Scale bar, 100 μm. e, Quantification of filamentous, compact, inert and total Aβ plaques (control n = 6 mice, sST2 n = 7 mice). T = 3.235, 2.274, −0.770 and 1.050, respectively; P = 7.95 × 10−3, 4.40 × 10−2, 4.57 × 10−1 and 3.16 × 10−1, respectively. f, Merged confocal z-stack images with orthogonal X–Z and YZ views showing co-staining of 4G8-labeled Aβ plaques (white) and Iba-1+ microglia (green; red arrowheads indicate microglial soma) in the cortices of 4-month-old female 5XFAD mice after i.c.v. delivery of sST2-Fc or Fc as a control (single-channel images in Supplementary Fig. 7). Scale bar, 10 μm. g, Quantification of microglial coverage of Aβ plaques (control n = 6 mice, sST2 n = 7 mice). T = −2.298, P = 4.22 × 10−2. h,i, Microglial Aβ uptake activity in the cortices of 4-month-old female 5XFAD mice after i.c.v. delivery of sST2-Fc or Fc as a control. Representative scatterplots (h) and quantification (i) show the percentages of CD11b+ cells containing methoxy-X04-labeled Aβ (control n = 7 mice, sST2 n = 7 mice; gating strategy in Supplementary Fig. 8). T = −3.620, P = 3.50 × 10−3. The scatterplots of wild-type (WT) mice in h were used to gate methoxy-X04+ microglia (that is, MeX04+CD11b+ cells). Data in bar charts are the mean + s.e.m. Statistical tests were performed as two-sided unpaired Student’s t-tests. *P < 0.05, **P < 0.01, ***P < 0.001.
Extended Data Fig. 1
Extended Data Fig. 1. Diagrams illustrating IL-33–ST2 signaling.
(a) Schematic showing the soluble ST2 (sST2) and full-length ST2 (ST2L) transcripts. (b) The IL-33/ST2 signaling pathways. IL-33, interleukin 33.
Extended Data Fig. 2
Extended Data Fig. 2. Associations between plasma soluble ST2 levels and Alzheimer’s disease in the Chinese_cohort_1, stratified by sex and APOE-ε4 genotypes.
(a) Individual plasma soluble ST2 (sST2) levels stratified by sex and disease phenotype (male: n = 132 healthy controls [HCs], n = 84 individuals with Alzheimer’s disease [AD]; female: n = 204 HCs, n = 193 individuals with AD). Test for effects of sex: β = −3.848 and −3.257 in HCs and individuals with AD, respectively; test for effects of AD: β = 1.926 and 2.235 in males and females, respectively. (b, c) Individual plasma sST2 levels stratified by APOE-ε4 genotypes and disease phenotype in (b) males (male ε4: n = 28 HCs, n = 29 individuals with AD; male non-ε4: n = 104 HCs, n = 55 individuals with AD), and (c) females (female ε4: n = 25 HCs, n = 71 individuals with AD; female non-ε4: n = 179 HCs, n = 122 individuals with AD). Test for effects of APOE-ε4: β = −1.809, −1.499, −0.248, and 2.425 in male HCs, male individuals with AD, female HCs, and female individuals with AD, respectively; test for effects of AD: β = 2.034, 1.098, 3.833, and 1.811 in male ε4, male non-ε4, female ε4, and female non-ε4, respectively. ε4, APOE-ε4 carriers; non-ε4, APOE-ε4 noncarriers. Data are presented as box-and-whisker plots including maximum, 75th percentile, median, 25th percentile, and minimum values; plus signs (+) denote corresponding mean values. Linear regression test, adjusted for age, cardiovascular disease status, body mass index (BMI), and education level, with multiple testing correction; #FDR < 0.05, ##FDR < 0.01, ###FDR < 0.001; *FDR < 0.05, **FDR < 0.01, ***FDR < 0.001. FDR, false discovery rate.
Extended Data Fig. 3
Extended Data Fig. 3. Associations between cerebrospinal fluid soluble ST2 levels and Alzheimer’s disease and amyloid-beta depositions in the UKBBN cohort, stratified by sex.
(a) Individual cerebrospinal fluid (CSF) soluble ST2 (sST2) levels stratified by sex and disease phenotype (n = 4 male healthy controls [HCs], n = 36 male individuals with Alzheimer’s disease [AD], n = 7 female HCs, n = 39 female individuals with AD). Test for effects of sex: β = −1.307 and −0.675 in HCs and individuals with AD, respectively; test for effects of AD: β = 4.019 and 7.766 in males and females, respectively. Data are presented as box-and-whisker plots including maximum, 75th percentile, median, 25th percentile, and minimum values; plus signs (+) denote corresponding mean values. Linear regression test, adjusted for age and postmortem duration (PMD), with multiple testing correction; *FDR < 0.05. (b) Associations between amyloid-beta (Aβ) staining in the postmortem frontal cortex and CSF sST2 levels in male and female individuals with AD (n = 23 males and 28 females in the UKBBN cohort, respectively). The regression lines and 95% confidence intervals are indicated in red/blue and gray, respectively. Linear regression test, adjusted for age and PMD, with multiple testing correction. Test in males: β = 0.0256, Pearson’s r2 = 0.0024, FDR = 0.7866; test in females: β = 0.2188, Pearson’s r2 = 0.1053, FDR = 0.0407. FDR, false discovery rate.
Extended Data Fig. 4
Extended Data Fig. 4. Effects of sex and age on soluble ST2 levels.
(a) Individual plasma sST2 levels stratified by sex (n = 216 males, and 397 females from Chinese_cohort_1). β = −3.577 for females vs. males, P = 1.58E − 12. (b) Associations between plasma sST2 levels and age in males and females (n = 216 males, and 397 females from Chinese_cohort_1). Test in males: β = 0.0134, Pearson’s r2 = 0.0010, P = 0.8661; test in females: β = 0.1256, Pearson’s r2 = 0.0366, P = 0.0016. (c) Correlations between plasma sST2 level and age in males and females from the INTERVAL and LonGenity cohort (n = 1,685 males, and 1,616 females from INTERVAL cohort; n = 432 males, and 530 females from LonGenity cohort). Test in INTERVAL cohort (ages 18–76), males: Pearson’s r2 = 0.0169, P < 0.0001; females: Pearson’s r2 = 0.0001, P = 0.7715. Test in LonGenity cohort (ages 65–94), males: Pearson’s r2 = 0.0100, P = 0.0093; females: Pearson’s r2 = 0.0196, P = 0.0001. (d) Correlations between CSF sST2 level and age in males and females from the Japanese cohort (n = 68 males, n = 65 females). Test in males: Pearson’s r2 = 0.0441, P = 0.0812; test in females: Pearson’s r2 = 0.1521, P = 0.0014. (e, f) Contributions of age and sex to the variance of sST2 levels. Numbers denote the proportions of plasma sST2 (e) and CSF sST2 (f) variance explained by age, sex, and other factors in the Chinese_cohort_1 and Japanese cohort, respectively. Data in box-and-whisker plots are presented with maximum, 75th percentile, median, 25th percentile, and minimum values; plus signs (+) denote mean values; data in regression lines are presented as slope (red/blue) and 95% CIs (gray). Statistical tests were performed by linear regression analysis, additionally adjusted for AD diagnosis, CVD status, BMI, education level in the Chinese_cohort_1. *P < 0.05, **P < 0.01, ***P < 0.001.
Extended Data Fig. 5
Extended Data Fig. 5. The rs1921622 A allele is associated with better cognitive performance in female APOE-ε4 carriers in the AIBL Aβ+ cohort.
Individual cognitive scores in (a) overall Aβ+ APOE-ε4 carriers (n = 122 G carriers [G/-], n = 53 A/A carriers), (b) male Aβ+ APOE-ε4 carriers (n = 63 G carriers [G/-], n = 24 A/A carriers), and (c) female Aβ+ APOE-ε4 carriers (n = 59 G carriers [G/-], n = 29 A/A carriers) stratified according to rs1921622 genotype. Test in the overall Aβ+ APOE-ε4 carriers, W = 3782.0, 3671.0, 3842.0, and 3319.0 for the effects of rs1921622 genotype on AIBL Preclinical Alzheimer Cognitive Composite (AIBLPACC) score, attention processing score, episodic recall score, and recognition score, respectively; test in the male Aβ+ APOE-ε4 carriers, W = 784.0, 727.0, 823.5, and 740.0 for the effects of rs1921622 genotype on AIBLPACC score, attention processing score, episodic recall score, and recognition score, respectively; test in the female Aβ+ APOE-ε4 carriers, W = 1087.0, 1115.5, 1083.0, and 916.5 for the effects of rs1921622 genotype on AIBLPACC score, attention processing score, episodic recall score, and recognition score, respectively. Data in box-and-whisker plots are presented with maximum, 75th percentile, median, 25th percentile, and minimum values; plus signs (+) denote mean values. Statistical tests are performed by Wilcoxon rank-sum test, with multiple testing correction. *FDR < 0.05, **FDR < 0.01, ***FDR < 0.001. FDR, false discovery rate.
Extended Data Fig. 6
Extended Data Fig. 6. The rs1921622 A allele is associated with slower gray matter atrophy in female APOE-ε4 carriers in the AIBL Aβ+ cohort.
(a, b) Individual baseline (a: n = 128 G carriers [G/-], and 55 A/A carriers) and longitudinal gray matter volume (b: n = 148 datapoints from 37 G/- carriers, and 55 datapoints from 14 A/A carriers) in overall Aβ+ APOE-ε4 carriers stratified by rs1921622 genotype. Test on baseline data: W = 4109.0, FDR = 0.109. Test on longitudinal data: β = −0.089 and −0.051 in G/- and A/A carriers, respectively; F = 3.830, FDR = 0.087. (c, d) Individual baseline (c: n = 64 G/- carriers, and 24 A/A carriers) and longitudinal gray matter volume (d: n = 98 datapoints from 25 G/- carriers, and 36 datapoints from 9 A/A carriers) in male Aβ+ APOE-ε4 carriers stratified by rs1921622 genotype. Test on baseline data: W = 852.0, FDR = 0.434. Test on longitudinal data: β = −0.069 and −0.053 in G/- and A/A carriers, respectively; F = 0.272, FDR = 0.607. (e, f) Individual baseline (e: n = 64 G/- carriers, and 31 A/A carriers) and longitudinal gray matter volume (f: n = 50 datapoints from 12 G/- carriers, and 19 datapoints from 5 A/A carriers) in female Aβ+ APOE-ε4 carriers stratified by rs1921622 genotype. Test on baseline data: W = 1240.0, FDR = 0.109. Test on longitudinal data: β = −0.159 and −0.027 in G/- and A/A carriers, respectively; F = 8.804. Data in box-and-whisker plots are presented with maximum, 75th percentile, median, 25th percentile, and minimum values; plus signs (+) denote mean values; data in regression lines are presented as slope (red/blue) and 95% confidence intervals (gray). Statistical tests on baseline data were performed by Wilcoxon rank-sum test, with multiple testing correction; and statistical tests on longitudinal data were performed by linear mixed model test, adjusted for baseline age and MRI scanners, with multiple testing correction. *FDR < 0.05, **FDR < 0.01, ***FDR < 0.001.
Extended Data Fig. 7
Extended Data Fig. 7. The rs1921622 A allele restores impaired microglial activities toward amyloid-beta in female APOE-ε4 carriers with Alzheimer’s disease.
(a, b) Representative images (a) and quantification (b) of Aβ plaques in the frontal cortices of individuals with AD stratified by sex and APOE-ε4 genotype (n = 14 male APOE-ε4 noncarriers [non-ε4], 22 male APOE-ε4 carriers [ε4], 19 female non-ε4, and 23 female ε4 from UKBBN cohort). Test for sex: β = 2.871 (non-APOE-ε4) and 4.927 (APOE-ε4), P = 2.09E − 2 (non-ε4) and 4.61E − 5 (ε4); for APOE-ε4: β = −0.621 (males) and 1.967 (females), P = 4.22E − 1 (males) and 4.84E − 2 (females). Scale bar, 200 μm. (c) Representative images of Aβ plaques in the frontal cortices of females with AD stratified by APOE-ε4 and rs1921622 genotype. Scale bar, 5 mm. (d, e) Representative image (d) and quantification (e) of Aβ plaques (brown) and Iba-1+ microglia (purple) in the frontal cortices of individuals with AD stratified by sex and APOE-ε4 genotype (n = 14 male non-ε4, 22 male ε4, 19 female non-ε4, and 23 female ε4). Test for sex: β = −1.214 (non-ε4) and −4.133 (ε4), P = 4.61E − 1 (non-ε4) and 3.52E − 4 (ε4); for APOE-ε4: β = −0.965 (males) and −2.818 (females), P = 3.27E − 1 (males) and 6.00E − 3 (females). Scale bar, 100 μm. (f, g) Representative image (f) and quantification (g) of Aβ plaques and microglia in the frontal cortices of females with AD stratified by APOE-ε4 and rs1921622 genotype (n = 4 G/G and 15 A/- carriers among non-ε4, 5 G/G carriers and 18 A/- carriers among ε4, respectively). Test for APOE-ε4: β = −3.745 (G/G) and −1.944 (A/-), P = 3.09E − 2 (G/G) and 9.32E − 2 (A/-); for rs1921622: β = 0.781 (non-ε4) and 2.017 (ε4), P = 7.70E − 1 (non-ε4) and 2.53E − 2 (ε4). Scale bar, 100 μm. Data in box-and-whisker plots are presented with maximum, 75th percentile, median, 25th percentile, and minimum values; plus signs (+) denote mean values. Statistical tests were performed by linear regression analysis, adjusted for age, PMD. *P < 0.05, **P < 0.01, ***P < 0.001; #P < 0.05, ##P < 0.01, ###P < 0.001.
Extended Data Fig. 8
Extended Data Fig. 8. The rs1921622 A allele and cerebrospinal fluid soluble ST2 level exhibit opposite effects on the microglial transcriptome in female APOE-ε4 carriers with Alzheimer’s disease.
Scatterplot showing the correlation between the normalized effect size (β) of cerebrospinal fluid (CSF) soluble ST2 (sST2) levels and the rs1921622 A allele on microglial gene expression in the frontal cortices of female APOE-ε4 carriers with Alzheimer’s disease (AD) (n = 2,636 microglia from 8 individuals from the UKBBN cohort).
Extended Data Fig. 9
Extended Data Fig. 9. Elevated brain soluble ST2 level exacerbates amyloid-beta deposition in female but not male 5XFAD mice.
(a, b) Amyloid-beta (Aβ) deposition in the cortices of 4-month-old male and female 5XFAD mice after 28-day intracerebroventricular delivery of soluble sST2 (sST2)-Fc or Fc as a control. (a) Representative images of Aβ staining. Scale bar, 1 mm. (b) Quantification of Aβ plaques (% of total cortical area) (control: n = 6 male and 5 female mice, sST2: n = 6 male and 5 female mice). T = 0.590 (males) and 2.721 (females); P = 0.568 (males) and 0.026 (females). Data in bar charts are mean + SEM. Statistical tests were performed as two-sided unpaired Student’s t-tests. *P < 0.05, **P < 0.01, ***P < 0.001.
Extended Data Fig. 10
Extended Data Fig. 10. Elevated brain soluble ST2 level leads to decreased amyloid-beta phagocytosis by microglia in female 5XFAD mice.
(a, b) Microglial amyloid-beta (Aβ) uptake activity in the cortices of 4-month-old female 5XFAD mice after 28-day intracerebroventricular delivery of soluble ST2 (sST2)-Fc or Fc as a control. Representative distribution (a) and quantification (b) show the mean fluorescent intensity (MFI) of methoxy-X04-labeled Aβ in the methoxy-X04+ CD11b+ microglia (control: n = 7 mice, sST2: n = 7 mice). T = − 2.490 and −2.014 for the tests in microglial with medium Aβ uptake (MeX04MedCD11b+; left) and high Aβ uptake (MeX04HighCD11b+; right), respectively; P = 0.028 and 0.067, respectively. Data in bar charts are mean + SEM. Statistical tests were performed as two-sided unpaired Student’s t-tests. *P < 0.05, **P < 0.01, ***P < 0.001.

Comment in

Similar articles

Cited by

References

    1. Alzheimer’s Association Alzheimer’s disease facts and figures. Alzheimers Dement. 2019;15:321–387.
    1. Jack CR, Jr, et al. NIA‐AA research framework: toward a biological definition of Alzheimer’s disease. Alzheimers Dement. 2018;14:535–562. doi: 10.1016/j.jalz.2018.02.018. - DOI - PMC - PubMed
    1. Lambert J-C, et al. Meta-analysis of 74,046 individuals identifies 11 new susceptibility loci for Alzheimer’s disease. Nat. Genet. 2013;45:1452–1458. doi: 10.1038/ng.2802. - DOI - PMC - PubMed
    1. Frigerio CS, et al. The major risk factors for Alzheimer’s disease: age, sex and genes modulate the microglia response to Aβ plaques. Cell Rep. 2019;27:1293–1306. doi: 10.1016/j.celrep.2019.03.099. - DOI - PMC - PubMed
    1. Yeh FL, Wang Y, Tom I, Gonzalez LC, Sheng M. TREM2 binds to apolipoproteins, including APOE and CLU/APOJ, and thereby facilitates uptake of amyloid-beta by microglia. Neuron. 2016;91:328–340. doi: 10.1016/j.neuron.2016.06.015. - DOI - PubMed

Publication types