. 2023 Apr;3(4):391-401.
doi: 10.1038/s43587-023-00380-7. Epub 2023 Mar 13.

CSF tau phosphorylation occupancies at T217 and T205 represent improved biomarkers of amyloid and tau pathology in Alzheimer's disease

Affiliations

CSF tau phosphorylation occupancies at T217 and T205 represent improved biomarkers of amyloid and tau pathology in Alzheimer's disease

Nicolas R Barthélemy et al. Nat Aging. 2023 Apr.

Abstract

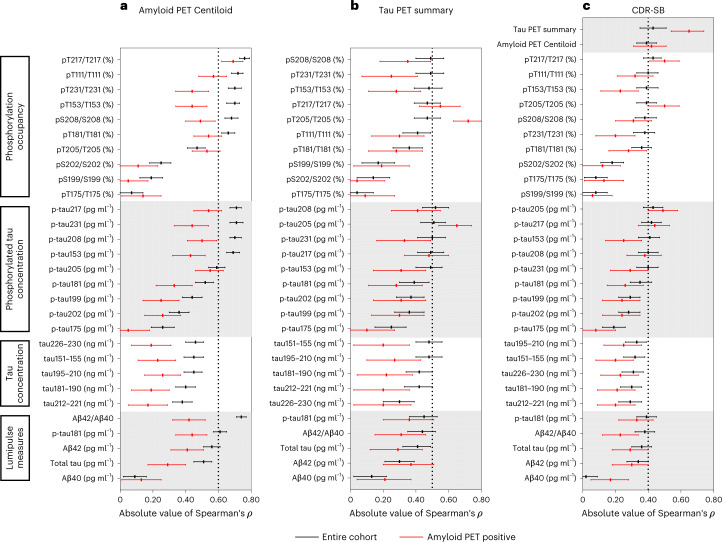
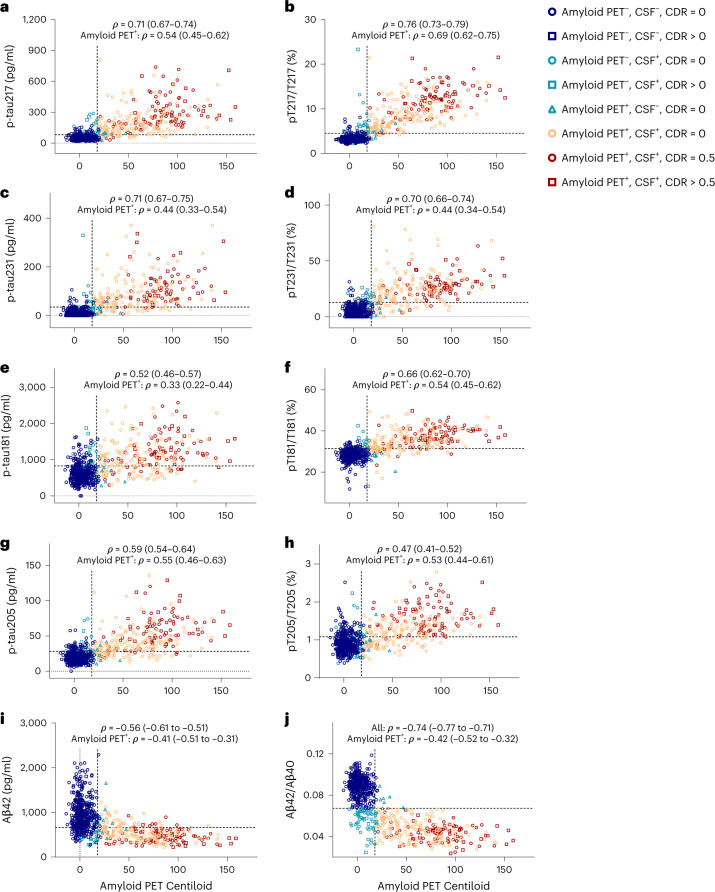
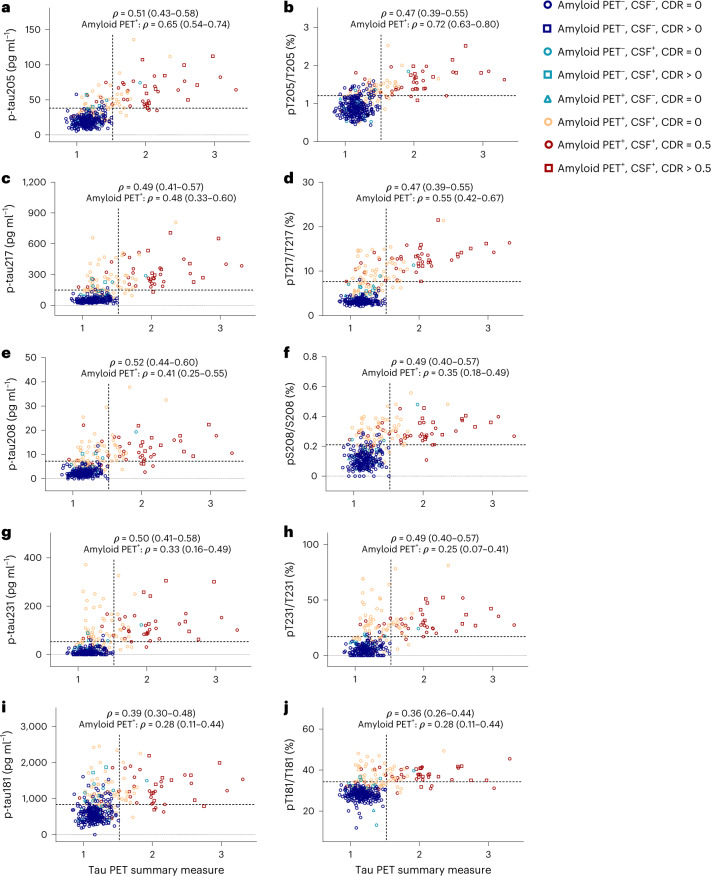
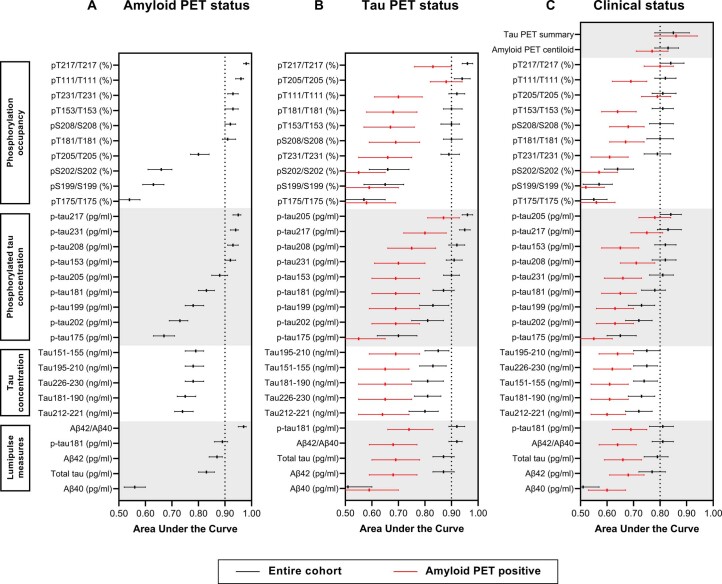
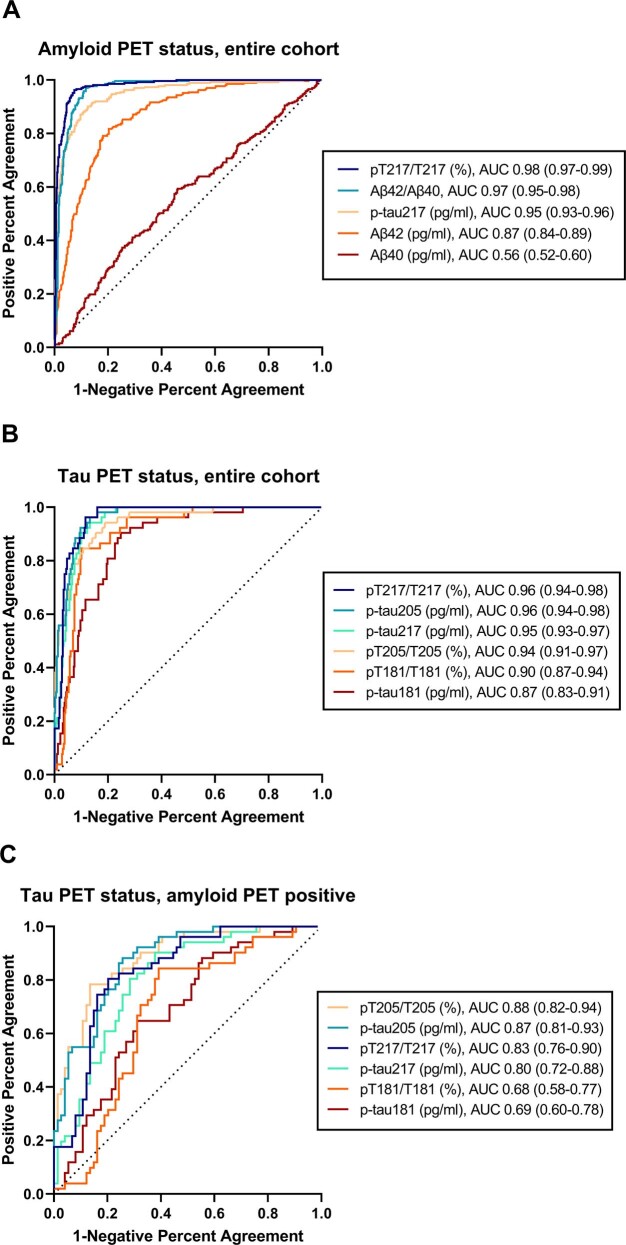
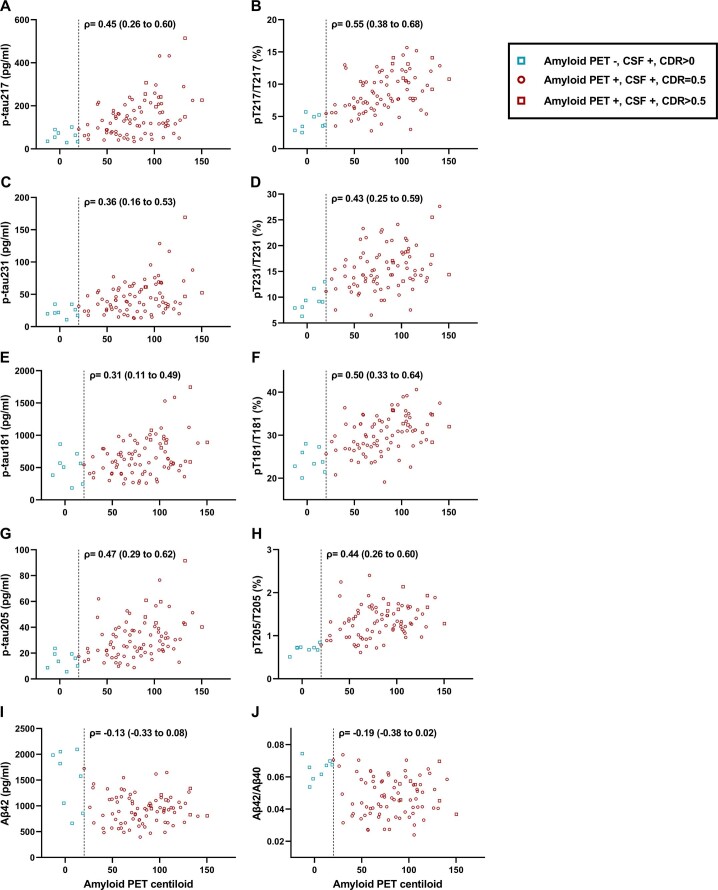
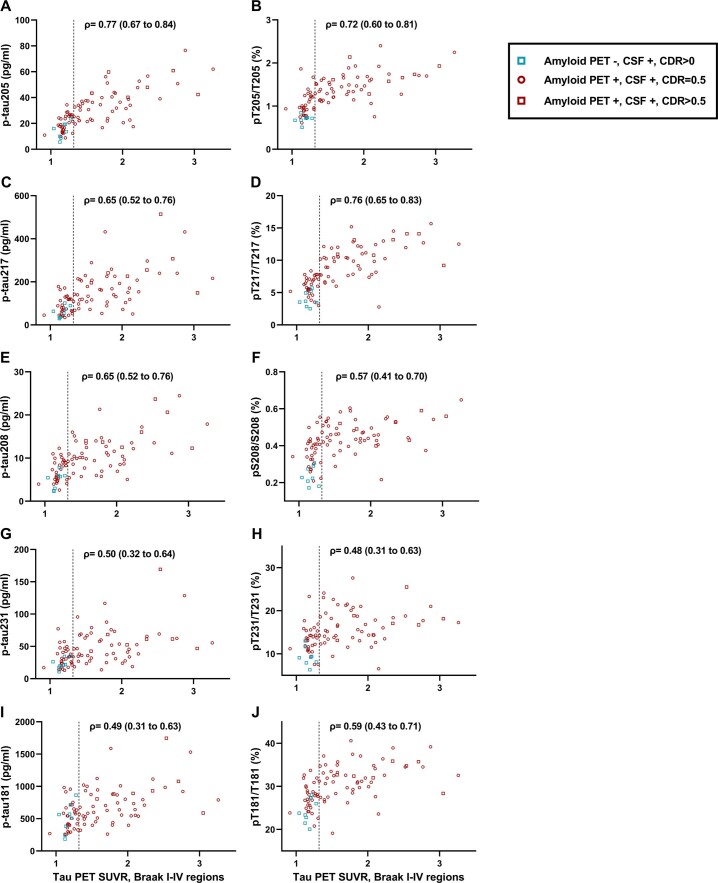
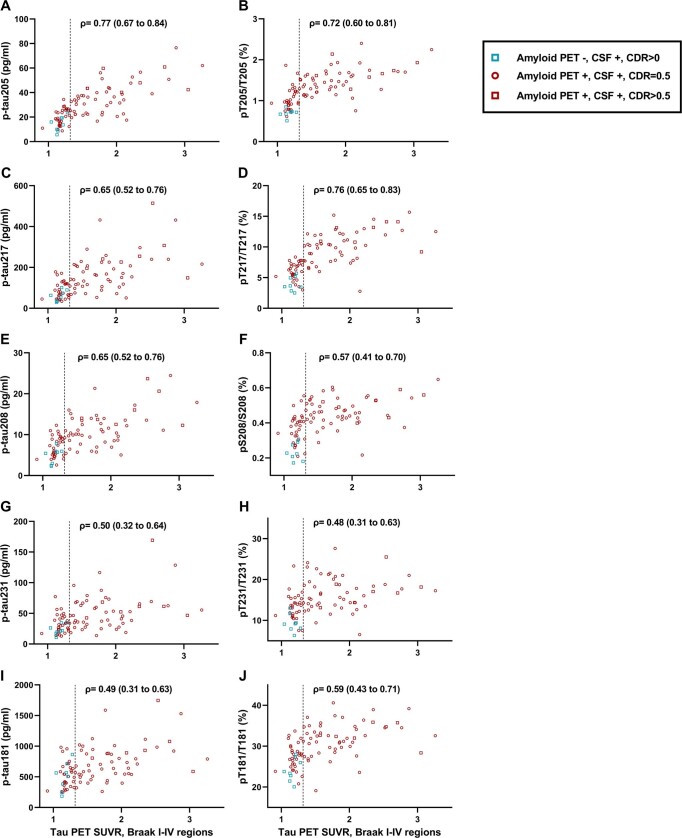
Cerebrospinal fluid (CSF) amyloid-β peptide (Aβ)42/Aβ40 and the concentration of tau phosphorylated at site 181 (p-tau181) are well-established biomarkers of Alzheimer's disease (AD). The present study used mass spectrometry to measure concentrations of nine phosphorylated and five nonphosphorylated tau species and phosphorylation occupancies (percentage phosphorylated/nonphosphorylated) at ten sites. In the present study we show that, in 750 individuals with a median age of 71.2 years, CSF pT217/T217 predicted the presence of brain amyloid by positron emission tomography (PET) slightly better than Aβ42/Aβ40 (P = 0.02). Furthermore, for individuals with positive brain amyloid by PET (n = 263), CSF pT217/T217 was more strongly correlated with the amount of amyloid (Spearman's ρ = 0.69) than Aβ42/Aβ40 (ρ = -0.42, P < 0.0001). In two independent cohorts of participants with symptoms of AD dementia (n = 55 and n = 90), CSF pT217/T217 and pT205/T205 were better correlated with tau PET measures than CSF p-tau181 concentration. These findings suggest that CSF pT217/T217 and pT205/T205 represent improved CSF biomarkers of amyloid and tau pathology in AD.


Conflict of interest statement

N.R.B., K.H., C.S., V.O. and R.J.B. are coinventors on the following US patent applications: ‘Methods to detect novel tau species in CSF and use thereof to track tau neuropathology in Alzheimer’s disease and other tauopathies’ (PCT/US2020/046224, N.R.B., K.H., C.S. and R.J.B.); ‘CSF phosphorylated tau and amyloid beta profiles as biomarkers of tauopathies’ (PCT/US2022/022906, N.R.B., C.S. and R.J.B.); ‘Plasma based methods for detecting CNS amyloid deposition’ (PCT/UC2018/030518, V.O. and R.J.B.); and ‘Methods of diagnosing and treating based on site-specific tau phosphorylation’ (PCT/US2019/030725, N.R.B. and R.J.B.). N.R.B., K.H., C.S., V.O. and R.J.B. may receive a royalty income based on technology licensed by Washington University to C2N Diagnostics. K.H. is an Eisai-sponsored voluntary research associate professor at Washington University and has received a salary from Eisai. A.M.F. has received research funding from Biogen, Centene, Fujirebio and Roche Diagnostics. She is a member of the scientific advisory boards for Roche Diagnostics, Genentech and Diadem. She consults for DiamiR and Seimens Healthcare Diagnostics Inc. T.L.S.B. has investigator-initiated research funding from the NIH, the Alzheimer’s Association, the Barnes-Jewish Hospital Foundation and Siemens. She participates as a site investigator in clinical trials sponsored by Avid Radiopharmaceuticals, Eli Lilly, Biogen, Eisai, Janssen and Roche, and serves as a consultant to Biogen, Eli Lilly, Eisai and Siemens. C.X. consulted for DIADEM and has used funding from the NIH to hire C2N Diagnostics as a vendor in another independent NIH-funded project. He received no funding from C2N Diagnostics. Neither J.C.M. nor his family owns stock or has equity interest (outside of mutual funds or other externally directed accounts) in any pharmaceutical or biotechnology company. O.H. has acquired research support (for the institution) from ADx, AVID Radiopharmaceuticals, Biogen, Eli Lilly, Eisai, Fujirebio, GE Healthcare, Pfizer and Roche. In the past 2 years, he has received consultancy/speaker fees from AC Immune, Amylyx, Alzpath, BioArctic, Biogen, Cerveau, Eisai, Fujirebio, Genentech, Novartis, Novo Nordisk, Roche and Siemens. R.J.B. cofounded C2N Diagnostics. Washington University and R.J.B. have equity ownership interest in C2N Diagnostics and receive a royalty income based on technology (stable isotope labeling kinetics, blood plasma assay and methods of diagnosing AD with phosphorylation changes) licensed by Washington University to C2N Diagnostics. R.J.B. receives an income from C2N Diagnostics for serving on the scientific advisory board, and has received research funding from Avid Radiopharmaceuticals, Janssen, Roche/Genentech, Eli Lilly, Eisai, Biogen, AbbVie, Bristol Myers Squibb and Novartis. S.E.S. has analyzed data provided by C2N Diagnostics to Washington University, but she has not received any research funding or personal compensation from C2N Diagnostics or any other for-profit organizations. The remaining authors declare no competing interests.

Figures

Fig. 1
Fig. 1. Correlations of CSF measures with amyloid PET Centiloid, the tau PET summary measure or dementia severity.
a, Correlations of the CSF measures with amyloid PET Centiloid evaluated in the amyloid PET cohort (n = 750 individuals). b, Correlations with the tau PET summary measure evaluated in the tau PET cohort (n = 371 individuals). c, Correlations with dementia severity, as measured by the CDR-SB, evaluated in the larger amyloid PET cohort (n = 750 individuals). The lines represent Spearman’s correlation (middle point) with 95% CIs. The black lines represent correlations in the entire cohort and the red lines represent correlations in amyloid PET-positive individuals.
Fig. 2
Fig. 2. Correlations of selected CSF p-tau concentrations and tau phosphorylation occupancies with amyloid PET Centiloid.
aj, CSF concentrations of p-tau217 (a), p-tau231 (c), p-tau181 (e), p-tau205 (g) and Aβ42 (i), and tau phosphorylation occupancies at T217 (b), T231 (d), T181 (f) and T205 (h), as well as Aβ42/Aβ40 (j), plotted as a function of amyloid PET Centiloid. Spearman’s correlations with 95% CIs are shown for the entire amyloid PET cohort (n = 750 individuals) and amyloid PET-positive individuals in the amyloid PET cohort (n = 263). The horizontal dashed lines denote the cut-offs that best distinguish amyloid PET status, based on combined sensitivity and specificity (Supplementary Table 3). The vertical dashed lines represent the cut-off for amyloid PET positivity. Each symbol represents one individual: blue circle: amyloid PET negative, CSF negative, CDR = 0; blue square: amyloid PET negative, CSF negative, CDR > 0; green circle: amyloid PET negative, CSF positive, CDR = 0; green square: amyloid PET negative, CSF positive, CDR > 0; green triangle: amyloid PET positive, CSF negative, CDR = 0; orange circle: amyloid PET positive, CSF positive, CDR = 0; red circle: amyloid PET positive, CSF positive, CDR = 0.5; and red square: amyloid PET positive, CSF positive, CDR > 0.5.
Fig. 3
Fig. 3. Correlations of selected CSF p-tau concentrations and tau phosphorylation occupancies with the tau PET summary measure.
aj, CSF concentrations of p-tau205 (a), p-tau217 (c), p-tau208 (e), p-tau231 (g) and p-tau181 (i), and tau phosphorylation occupancies at T205 (b), T217 (d), S208 (f), T231 (h), and T181 (j), plotted as a function of the tau PET summary measure. Spearman’s correlations with 95% CIs are shown for the entire tau PET cohort (n = 371) and amyloid PET-positive individuals in the tau PET cohort (n = 125). The horizontal dashed lines denote the cut-offs that best distinguish tau PET status, based on combined sensitivity and specificity (Supplementary Table 9). The vertical dashed lines represent the cut-off for tau PET positivity. Each symbol represents one individual: blue circle: amyloid PET negative, CSF negative, CDR = 0; blue square: amyloid PET negative, CSF negative, CDR > 0; green circle: amyloid PET negative, CSF positive, CDR = 0; green square: amyloid PET negative, CSF positive, CDR > 0; green triangle: amyloid PET positive, CSF negative, CDR = 0; orange circle: amyloid PET positive, CSF positive, CDR = 0; red circle: amyloid PET positive, CSF positive, CDR = 0.5; and red square: amyloid PET positive, CSF positive, CDR > 0.5.
Fig. 4
Fig. 4. Correlations of selected CSF tau phosphorylation occupancies with regional tau PET and regional brain volumes for amyloid PET-positive individuals.
a, Partial Spearman’s correlations of selected CSF measures with regional tau PET adjusted for age and sex shown for amyloid PET-positive individuals in the tau PET cohort (n = 125). b, Partial Spearman’s correlations of CSF measures with regional brain volumes adjusted for age and sex shown for amyloid PET-positive individuals in the larger amyloid PET cohort (n = 263).
Extended Data Fig. 1
Extended Data Fig. 1. Correspondence of CSF measures with amyloid PET status, tau PET status, or clinical status.
Correspondence of the CSF measures with amyloid PET status was evaluated in the amyloid PET cohort (n = 750 individuals) (A), and correspondence with tau PET status was evaluated in tau PET cohort (n = 371 individuals) (B). Correspondence of the CSF measures with clinical status (cognitively normal [CDR = 0] or cognitively impaired [CDR > 0]) was evaluated in the larger amyloid PET cohort (n = 750 individuals) (C). Lines represent the receiver operating characteristic area under the curve point estimate (middle point) and 95% confidence intervals. Black lines represent correspondence in the entire cohort and the red lines represent correspondence in amyloid PET positive individuals.
Extended Data Fig. 2
Extended Data Fig. 2. Receiver operating characteristic curves for selected CSF measures.
Correspondence of selected CSF measures with amyloid PET status was evaluated in the amyloid PET cohort; n = 750 for all measures shown (A). Correspondence of selected CSF measures with tau PET status was evaluated in the tau PET cohort; n = 371 for all measures shown except for pT181/T181 and p-tau181 (n = 370) (B). Correspondence of selected CSF measures with tau PET status was evaluated in the amyloid PET positive individuals in the tau PET cohort; n = 125 for all measures shown (C). For each measure, the receiver operating characteristic area under the curve with 95% confidence intervals is shown.
Extended Data Fig. 3
Extended Data Fig. 3. Correlations of selected CSF p-tau concentrations and tau phosphorylation occupancies with amyloid PET Centiloid in the BioFINDER-2 cohort.
CSF concentrations of p-tau217 (A), p-tau231 (C), p-tau181 by MS (E), p-tau205 (G), and Aβ42 (I) and tau phosphorylation occupancies at T217 (B), T231 (D), T181 (F), T205 (H), as well as Aβ42/Aβ40 (J), are plotted as a function of amyloid PET Centiloid. Spearman correlations with 95% confidence intervals are shown. Vertical dashed lines represent the cut-off for amyloid PET positivity. Each symbol represents one individual: green square: amyloid PET negative, CSF positive, CDR > 0; red circle: amyloid PET positive, CSF positive, CDR = 0.5; red square: amyloid PET positive, CSF positive, CDR > 0.5.
Extended Data Fig. 4
Extended Data Fig. 4. Correlations of selected CSF p-tau concentrations and tau phosphorylation occupancies with tau PET SUVR for Braak I-IV regions in the BioFINDER-2 cohort.
CSF concentrations of p-tau205 (A), p-tau217 (C), p-tau208 (E), p-tau231 (G), and p-tau181 by MS (I) and tau phosphorylation occupancies at T205 (B), T217 (D), S208 (F), T231 (H), as well as T181 (J), are plotted as a function of the tau PET SUVR for Braak I-IV regions. Spearman correlations with 95% confidence intervals are shown. Vertical dashed lines represent the cut-off for tau PET positivity (SUVR > 1.32 for Braak I-IV regions). Each symbol represents one individual: green square: amyloid PET negative, CSF positive, CDR > 0; red circle: amyloid PET positive, CSF positive, CDR = 0.5; red square: amyloid PET positive, CSF positive, CDR > 0.5.
Extended Data Fig. 5
Extended Data Fig. 5. Correlations of selected CSF p-tau concentrations and tau phosphorylation occupancies with tau PET SUVR for Braak V-VI regions in the BioFINDER-2 cohort.
CSF concentrations of p-tau205 (A), p-tau217 (C), p-tau208 (E), p-tau231 (G), and p-tau181 by MS (I) and tau phosphorylation occupancies at T205 (B), T217 (D), S208 (F), T231 (H), as well as T181 (J), are plotted as a function of the tau PET SUVR for Braak V-VI regions. Spearman correlations with 95% confidence intervals are shown. Each symbol represents one individual: green square: amyloid PET negative, CSF positive, CDR > 0; red circle: amyloid PET positive, CSF positive, CDR = 0.5; red square: amyloid PET positive, CSF positive, CDR > 0.5.

Similar articles

Cited by

References

    1. Villemagne VL, Dore V, Burnham SC, Masters CL, Rowe CC. Imaging tau and amyloid-beta proteinopathies in Alzheimer disease and other conditions. Nat. Rev. Neurol. 2018;14:225–236. doi: 10.1038/nrneurol.2018.9. - DOI - PubMed
    1. Ossenkoppele R, et al. Tau PET correlates with different Alzheimer’s disease-related features compared to CSF and plasma p-tau biomarkers. EMBO Mol. Med. 2021;13:e14398. doi: 10.15252/emmm.202114398. - DOI - PMC - PubMed
    1. Patterson BW, et al. Age and amyloid effects on human central nervous system amyloid-beta kinetics. Ann. Neurol. 2015;78:439–453. doi: 10.1002/ana.24454. - DOI - PMC - PubMed
    1. Mattsson-Carlgren N, et al. Cerebrospinal fluid biomarkers in autopsy-confirmed Alzheimer disease and frontotemporal lobar degeneration. Neurology. 2022;98:e1137–e1150. doi: 10.1212/WNL.0000000000200040. - DOI - PMC - PubMed
    1. Long JM, et al. Preclinical Alzheimer’s disease biomarkers accurately predict cognitive and neuropathological outcomes. Brain. 2022;145:4506–4518. doi: 10.1093/brain/awac250. - DOI - PMC - PubMed

Publication types